1. BABSON
College Fund
1
Financials Sector Team October 22/2014
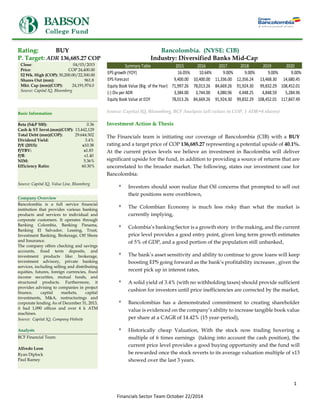
Rating: BUY Bancolombia. (NYSE: CIB)
P. Target: ADR 136,685.27 COP Industry: Diversified Banks Mid-Cap
Close: 04/03/2015
Price: COP 24,400.00
52 Wk. High (COP): 30,200.00/22,300.00
Shares Out (mm): 961.8
Mkt. Cap (mm)(COP): 24,191,974.0
Source: Capital IQ, Bloomberg
Source: Capital IQ, Bloomberg, BCF Analysis (all values in COP, 1 ADR=4 shares)
Investment Action & Thesis
The Financials team is initiating our coverage of Bancolombia (CIB) with a BUY
rating and a target price of COP 136,685.27 representing a potential upside of 40.1%.
At the current prices levels we believe an investment in Bacolombia will deliver
significant upside for the fund, in addition to providing a source of returns that are
uncorrelated to the broader market. The following, states our investment case for
Bancolombia:
* Investors should soon realize that Oil concerns that prompted to sell out
their positions were overblown,
* The Colombian Economy is much less risky than what the market is
currently implying,
* Colombia’s banking Sector is a growth story in the making, and the current
price level provides a good entry point, given long term growth estimates
of 5% of GDP, and a good portion of the population still unbanked,
* The bank’s asset sensitivity and ability to continue to grow loans will keep
boosting EPS going forward as the bank’s profitability increases , given the
recent pick up in interest rates,
* A solid yield of 3.4% (with no withholding taxes) should provide sufficient
cushion for investors until price inefficiencies are corrected by the market,
* Bancolombias has a demonstrated commitment to creating shareholder
value is evidenced on the company’s ability to increase tangible book value
per share at a CAGR of 14.42% (15 year-period),
* Historically cheap Valuation, With the stock now trading hovering a
multiple of 6 times earnings (taking into account the cash position), the
current price level provides a good buying opportunity and the fund will
be rewarded once the stock reverts to its average valuation multiple of x13
showed over the last 3 years.
Basic Information
Beta (S&P 500): 0.36
Cash & ST Invst.(mm)(COP): 13,442,129
Total Debt (mm)(COP): 29.644.502
Dividend Yield: 3.4%
P/E (2015): x10.38
P/TBV: x1.83
P/B: x1.40
NIM: 5.36%
Efficiency Ratio: 60.30%
Source: Capital IQ, Value Line, Bloomberg
Company Overview
Bancolombia is a full service financial
institution that provides various banking
products and services to individual and
corporate customers. It operates through
Banking Colombia, Banking Panama,
Banking El Salvador, Leasing, Trust,
Investment Banking, Brokerage, Off Shore
and Insurance.
The company offers checking and savings
accounts, fixed term deposits, and
investment products like: brokerage,
investment advisory, private banking
services, including selling and distributing
equities, futures, foreign currencies, fixed
income securities, mutual funds, and
structured products. Furthermore, it
provides advising to companies in project
finance, capital markets, capital
investments, M&A, restructurings and
corporate lending As of December 31, 2013,
it had 1,090 offices and over 4 k ATM
machines.
Source: Capital IQ, Company Website
Analysts
BCF Financial Team:
Alfredo Leon
Ryan Diplock
Paul Ramey
Summary Table 2015 2016 2017 2018 2019 2020
EPS growth (YOY) 16.05% 10.64% 9.00% 9.00% 9.00% 9.00%
EPS Forecast 9,400.00 10,400.00 11,336.00 12,356.24 13,468.30 14,680.45
Equity Book Value (Big. of the Year) 71,997.26 78,013.26 84,669.26 91,924.30 99,832.29 108,452.01
(-) Div per ADR 3,384.00 3,744.00 4,080.96 4,448.25 4,848.59 5,284.96
Equity Book Value at EOY 78,013.26 84,669.26 91,924.30 99,832.29 108,452.01 117,847.49
2. BABSON
College Fund
2
Financials Sector Team October 22/2014
Investment Highlights:
Oil Concerns Overblown. As showed by the graph bellow, Bancolombias stock price has a strong correlation to the price of
oil. This caused investors to sell out their positions driving the stock price down by as much as 40% before finding some
resistance at $36 US dollars per ADR from a high of $66 in August 2014.
Source: Google Finance
If we look at the big picture however, none of the fundamentals aspects of the business have changed for Bancolombia that
justifies a 40% lost in value of its shares, as the company is targeting 10-15% expansion in its core market. The contradiction
between the quality of the bank earnings, and the stock price leads us to believe that what justified the selloff of the shares
appears to be declining Oil prices and the negative effect they carry for the company and the economy. Let’s come to a more
sensible conclusion by studying the effect separately:
Effect in the Colombian Economy: Yes, a decline in Oil prices translates into a big hit for exports given that Oil accounts for
40% of exports, but the Colombian economy is a fairly closed economy where Oil revenues are not as significant as investors
are implying accounting for roughly 8% of GDP. In fact, the effect of declining oil prices will be to some extent contained (at
least in 2015), as pointed out by the Finance Minister (source) who forecasts GDP growth to slow by 0.3% for this year. This
is because the country has locked sales at higher prices that will help ease the shock. Furthermore, most analyst are
forecasting the Colombian economy (GDP) should be growing this year somewhere in the 4-5% range.
Effect in Bancolombia: Bancolombia only has 2% of
its loan book exposed to oil and gas (source,
conference call transcript). Not much to add to this,
it is clear the decline in Oil prices affects the
economy more than it affects Bancolombia. A detail
of the composition of the loan book is shown in the
left graph.
Source: Grupo Aval Presentation
3. BABSON
College Fund
3
Financials Sector Team October 22/2014
Colombia a Favorable place for Business. Colombia has had a long perception of being a risky place to invest. The influence
of terrorist groups like “LAS FARC” and the power drug cartels had until pretty much the beginning of the millennium,
made it very hard for the economy to “open up” to capital inflows, investment, and free market dynamics that are welcoming
to investors.
Much has changed from these days, while Colombia is still an emerging market, it is among the lowest risk ones out there.
There's no significant leftist political movement, the narco-terrorists are a relic of the past seen only in museum exhibits and
late-night cable documentaries, and the country's rapidly rising middle class is spending more, and using ever more banking
services along the way. Medellín, the country's commercial center (and Bancolombia's HQ) rivals any Latin American
financial center as a desirable location for business, boasting a modern metro-train system, a massive construction boom, a
huge wave of modernization, and a large state-of-the-art international airport.
Moreover, the Colombian government has a low level of debt to GDP, at a mere 32%. It also maintains a counter-cyclical
fiscal policy, and as such, will not be significantly cutting spending in response to the fall in oil revenues. Currently, the
government runs a deficit of 2.4% of GDP, giving it plenty of room for stimulatory efforts. In addition, the drop in oil has
caused the Colombian currency, the Peso, to fall significantly. This movement will greatly curtail consumers' desire to buy
imports. As such, the country's current account deficit will only modestly widen in 2015 despite the drop in oil exports.
The country is led currently by President Santos, a traditional conservative who would make US Republicans pleased with
his unflinching commitment to free trade, economic liberalization and the encouraging of more foreign investment. If you're
looking for a pro-business president, you couldn't ask for a better leader than Colombia's president. And best of all, Santos
was re-elected just last summer and will be in office through 2018.
If more tangible evidence is still required, consider that according to the Heritage Foundation's widely influential index of
economic freedom, Colombia scores # 2 in Latin America and #28 in the world, as shown in the graph below:
Source: Heritage Foundation's economic freedom index
4. BABSON
College Fund
4
Financials Sector Team October 22/2014
Bancolombia a Growth Story in the Making. Part of this stock’s appeal is its potential for growth. Bancolombia is the largest
bank (in AUM) with more than 1,000 branches and +4,000 ATM’s. In addition to this, it also holds 28% of the banking market
share in El Salvador with its banking asset there, and has recently acquired a Panamanian bank (the old HSBC Panamanian
arm) with more than 10% market share in that country as well.
Colombias growth story: Colombia offers the sort of growth that the more developed world just can't get you with a much
clearer picture. To start with, Colombian GDP has been growing and is projected to continue to grow at a long-term average
around 5% for the foreseeable future. Using the rule of 72, we can calculate that the Colombian economy should double in
size every 14 years or so. Clearly owning the country's largest bank is appealing. Buying it at around 9x 2015 earnings makes
it even nicer. This analysis gives us an idea of the runway that lies ahead.
Furthermore the Colombian loan volumes have generally grown close x3 times the economy’s growth rate. For 2015
management has issued guidance that the loan book should grow somewhere in the range of 10-15%, so in an arguably “bad
year” the loan book grows 10-15%. If we apply the same rule again, we find that under a modest scenario the loan book
should double in size every 5-6 years. If history is good guidance the company should reach these targets given that CIB has
grown assets at x2.4 times and its loan portfolio x2.6 times since the end of 2009. A comprehensive detail of this growth is
shown in this graph:
Source: Company Presentation 4Q Earnings
If we consider that shares are trading at the same price levels of that of 2009 the current entry point suggests that we will be
getting 5 years of growth pretty much free. Also, given that Colombia is still in the early stage of its move toward becoming
a modernized developed country, there are many multiples of this growth potential remaining. Going beyond loans, the
company has prioritized growing its income from banking fees. This segment, which was already growing at a respectable
6% in 2013 soared to 17% yoy growth in 2014, led by moves to push more use of debit and credit cards. For a society where
most transactions occur in cash, the push to plasticize the economy offers unfathomable upside for Bancolombia especially
when considering how quickly the average Colombian consumers’ income is rising.
The following graph from the company’s presentation for 4Q 2014, shows a market not yet fully penetrated with plenty of
room to grow. To better gauge this idea consider for a moment that there is only 1 credit card outstanding per 4 Colombian
citizens.
5. BABSON
College Fund
5
Financials Sector Team October 22/2014
At present, Bancolombia is the leader in Colombian banking market share, but it
still controls less than a quarter of the market. Also, CIB recently bought out the
operations of one of Panama's largest banks.
Panama, thanks to a larger new Panama Canal expansion project has been the
fastest growing economy in Latin America and continues to grow at 8%. This new
asset offers even more fuel to Bancolombias growth story. And, since Panama uses
the dollar, this segment's earnings and assets are denominated in dollars,
sheltering much of Bancolombia's assets from the selloff in its home currency.
Source: Company Presentation 4Q Earnings
The bank’s asset sensitivity and ability to continue to grow loans will keep boosting EPS going forward. Any investor
looking at the financial sector right now (at least in the US and Eropue) is more than concerned with headwinds regarding
government regulation, new capital requirements, fines, legal costs and compliance to new standards that are a general drag
on profitability. This level of government oversight is yet to be seen in Financial Service space in Colombia. I am not implying
government regulation don’t not have any impact, but they certainly are much less of a drag on profitability than in the
developed world.
Bancolombia is a bank in the best aspect of the word. It borrows cheap and lends really expensive. Bancolombia's Net Interest
Margin (NIM) weighs in around 5.9%. That compares favorably to the U.S. The U.S.' top large banks, like: U.S. Bancorp
(NYSE:USB) at 3.1%, while others such as Bank of America (NYSE:BAC) and JPMorgan (NYSE:JPM) score much lower at
2.3% and 2.2%. Hence, Bancolombia uses much less leverage to achieve similar levels of returns. Not surprisingly, Colombia
weighs in with a sound banking system, #30 in the world according to a recent study, compared to the USA’s #49th place
ranking. (Survey).
The company is able to achieve such high NIM because the Colombian credit markets are profoundly underdeveloped,
meaning that only high quality borrower’s can access credit at a very high cost. Since credit is not supplied at the same rate
of more developed economies banks and other financial institutions have much more pricing power. In this environment,
players like Bancolombia that are able to reach a certain scale and generate efficiencies will outperform and raise the barriers
of entry for smaller players looking to enter.
Furthermore the Colombian central bank raised rates for 5 consecutive months during 2014 to reach the desired level of
4.5%, with a focus on containing inflation that as of today stands of 4 %. Bancolombia seized on the moment locking in cheap
longer term funding prior to the rate hikes. This should cause the bank's interest margin to rise nicely over the next year.
Already, as of the last conference call, Bancolombia reports that net interest income grew 22% faster than growth of the loan
portfolio and its NIM rose sharply. A detailed chart on the Colombian interest rate and inflation rate can be found below:
Source: Company Trading Economics Website
6. BABSON
College Fund
6
Financials Sector Team October 22/2014
While inflation remains a concern, current forecast imply that inflation will remain stable at least for the next 2 years trending
downwards from the 4.36% where it stands today.
Source: Company Trading Economics Website
A solid yield of 3.4% (with now withholding tax), should provide sufficient cushion for investors until price inefficiencies
are corrected by the market. Not only does Bancolombia offer an attractive yield of 3.4%. But the company also holds a long
track record of steady dividend payments and growth, something very appealing to value investors. As we can see from the
bellow graph. This should provide comfort enough for investors looking to build a new position on CIB, until the inefficiency
is corrected by the market.
Source: Investor Relations
Another plus is that unlike other foreign stocks CIB is subject - no withholding tax - on dividends payments.(Source).
Bancolombias strong commitment to Creating Shareholder Value. Bancolombias management is known for their
conservative banking practices and the ability to create shareholder value as evidenced by the increase of tangible book
value per share at a 14.3% CAGR. Moreover, even when faced with times of trouble in the 2008 oil collapse/financial panic
the bank continued to remain profitable an increase this metric. Back then (very much like today), the peso sold off hard
reaching valuations as low as 2,500 COP/Us $ before going back to 1,800 COP/Us $. As I write this report the exchange rate
stands at 2,572 COP/Us $. A detail overview of this important financial metric is below:
Source: Bloomberg
7. BABSON
College Fund
7
Financials Sector Team October 22/2014
Company Profile:
“With 140 years of experience, BANCOLOMBIA is the largest bank in Colombia, offering a wide range of financial products and services
to a diversified individual and corporate base of more than 9 million customers. BANCOLOMBIA delivers its products and services via
its regional network comprised of Colombia´s largest non-government owned banking network, with over 1,070 branches, 4,524 ATMs,
4,202 banking agents, as well as the rest of our electronic channels. We are also in Central America, with Banagricola (El Salvador),
BAM (Guatemala), and Banistmo (Panamá), and with our off-shore banking subsidiaries in Panama, Cayman Islands, and Puerto Rico.
Together, BANCOLOMBIA and its subsidia-ries provide stock brokerage, investment banking, leasing, factoring, consumer finance,
fiduciary and trust services, asset management, and insurance, among others.” (Investor Relations, Bancolombia).
Company Segments:
Banking Colombia: This segment provides retail and corporate banking products and services to individuals, companies and
national and local governments in Colombia.
Banking Panama: This segment provides retail and commercial banking products and services to individuals and companies
in Panama through the Banistmo operation.
Banking El Salvador: This segment provides retail and commercial banking products and services to individuals, companies
and national and local governments in El Salvador.
Leasing: This segment provides financial and operational leases, including cross-border and international leasing services to
clients in Colombia, Central America, Mexico and Brazil.
Trust: This segment provides trust services and asset management to clients in Colombia and Peru.
Investment Banking: This segment provides corporate and project finance advisory, underwriting, capital markets services
and private equity management through Banca de Inversion Bancolombia S.A.
Brokerage: This segment provides brokerage, investment advisory and private banking services to individuals and
institutions.
Insurance: This segment commenced in November 2013 and provides insurance services to individuals and companies in
Panama.
Off Shore: This segment provides a complete line of offshore banking services to Colombian and Salvadorian customers.
Other: This segment includes operations of particular investment vehicles: Valores Simesa S.A., BIBA Inmobiliaria S.A.S.,
Inversiones CFNS S.A.S., CFNS Infraestructura S.A.S., Sistema de Inversiones y Negocios S.A. Sinesa, Vivayco S.A.S.,
Banagrícola S.A., Inversiones Financieras Banco Agrícola, Fondo Inmobiliario Colombia and others.
In order to put into perspective the broad structure of the different business lines of Bancolombia, it makes sense to provide
an overview of the asset base, Liabilities, Asset Quality, Capital Structure and Capital adequacy ratios.
8. BABSON
College Fund
8
Financials Sector Team October 22/2014
Asset Base:
Source: Company Reports, 4Q 2014 Presentations
Liabilities and Cost of Funding:
Source: Company Reports, 4Q 2014 Presentations
As stated before, CIB was able to lock in some funding at cheap funding taking advantage of lower interest rates in the first
part of 2014. This translated into a decrease of about 12 bps in funding costs, as seen in the above image.
9. BABSON
College Fund
9
Financials Sector Team October 22/2014
Asset Quality:
As we can see on the left and in the above graph,
credit quality has been relatively stable and even
trading downwards in 2014. Management guided
that it expects to mantain similar levels of credit
quality for 2015.
Source: Company Reports, 4Q 2014 Presentations
Capital Structure and Capital Adequacy
Source: Company Reports, 4Q 2014 Presentations
10. BABSON
College Fund
10
Financials Sector Team October 22/2014
The company offers plenty of comprehensive information about their different business line and financials, trying to capture
every detail is beyond the scope of this report that seeks to cover the most important points. However, if the reader feels
more information is needed a direct link to the web page of investor relations can be found (here). Also, this cover page
provides a very good overview (.).
We can summarize the key points of our investment thesis with the following SWOT analysis:
Investment Risks
General Market Risks and Correlation with Oil Prices: As with any other stock Bancolombia faces investment risks
associated with market movements. In the particular case of CIB, the stock price could be negatively affected if the
macroeconomic landscape in Colombia changes or growth begins to slow down. Moreover the stock shows good correlation
with oil prices. So if investors keep associating Bancoloombia with the Oil Sector potential for capital appreciation could be
limited.
Currency Exchange Risk. There is significant exposure to currency exchange risk as Bancolombia derives all of its revenues
in a foreign currency (the peso). In Colombia's case, the currency has held its value firmly against the dollar over the past
11. BABSON
College Fund
11
Financials Sector Team October 22/2014
decade. It started off at a roughly 2,200/1 exchange rate against the dollar in 2005, strengthened significantly to 1,700 during
the oil boom of 2007/08, sold off hard to 2,500 during the oil collapse/financial panic of 2008-09 and promptly recovered
back to below 2,000 pesos per dollar.
The Peso would then hold stable for several years. Recently fallen sharply, heading back to above 2,500 with the latest oil
panic. As you can see, Colombia has not had lasting devaluations from previous economic cycles, and came out of the 2008-
09 bust without any lasting loss of its currency's buying power. Furthermore if we turn our focus to the overall economy
and some relevant metrics: Colombia has higher growth forecast than most developed economies, 4% inflation, moderate to
small current account deficits plus a 32% debt/GDP ratio.
Furthermore the dollar already stretched and the peso trading in the lower limit of the historical range against the dollar, if
you couple that with strong economic fundamentals, the downside risk appears to be manageable.
Geopolitical Risk. Given that the company operates in the foreign Colombian Economy there is some exposure to
geopolitical risk in our thesis. Nonetheless, we believe this risk is minimized if you take into consideration: That Colombia
is a profoundly-closed economy, scoring at 139th of 144 countries in terms of imports as a size of GDP. (According to the
Global Competitiveness Report of 2014-2015), that the debt to GDP is manageable (32% and shrinking) and finally that the
government is running a modest deficit of 2.4% of GDP.
In addition its lead by president Santos, who vary much favors foreign investment. The president was just reelected last
summer and will be in office through 2018. Also, there is no significant leftist political movement, the narco-terrorists have
every day less of an influence, and the country's rapidly rising middle class is spending more, and using ever more banking
services along the way. All these facts mitigate this source of risk in our view.
Low Loan Growth: As with many banks CIB faces the risk of not growing loans fast enough hurting in turn the profitability
of the institution.
Credit Quality and composition of the Loan Book: Although we don’t see any factors going forward that should affect the
overall credit quality of the loan portfolio, any change in the borrower’s ability to repay these loans will cause a decrease in
profitability of the financial institution. Moreover, there is an additional risk factor to take into consideration when looking
at the portfolio. This is the high concentration towards Consumer loans that represents close to 60% of the total book. This
exposure is somewhat higher than comparable peers (Grupo Aval, Davivienda and BBVA Colombia) that range from 38%
to 56.2%. However it is understandable given that Bancolombia is Colombia's largest bank, and has an extensive network of
more than 1,000 branches and 4,000 ATMs.
NIM and Efficiency Ratio not achieving Projected Ratios: These two metrics are deeply tight to the bank profitability and
if they were not to improve in line with the projections could cause downwards pressure on the stock price.
Downside: International expansion. Bancolombia’s asset base extends further than the Colombian economy. Bancolombia
holds about 28% of the banking market share in El Salvador where it has roughly 7B of COP in assets, and 10% of the
Panamanian banking market share with the recent purchase of the old HSBC Panamanian banking arm composed of 15B of
COP in assets. Any failure to correctly integrate these acquisitions to the parent company (specially the most recent one in
Panama), and the additional geographies where CIB is exposed to because of these acquisitions, provides an additional
source of risk that should be considered.
Changes in Banking Regulations. Banks are one of the most regulated industries there is, and ass such any fundamental
change in the rules of the competitive landscape can have profound effect on CIB’s stock price. For example, recently the
government approve reform in taxes that will take the bank’s effective tax rate from 27% to around 32-33% levels according
to guidance provided by management in there last earnings call.
12. BABSON
College Fund
12
Financials Sector Team October 22/2014
Shareholder Structure:
Institutional investors own 43.71% of the shares of CIB, while public corporations own 30.25%. The remaining 26.04% is
owned by the general public. The following shows a detailed view of the ownership of the stock. It’s worth noting that
from the period beginning September to December of 2014, new and increased positions totaled 43,943,230 shares while
decreased and sold out positions sum 28,604,299 (on the Institutional side). This plus some new an increased positions
seen by Hedge Funds over this time period suggest that the following prices could represent a good buying opportunity.
Source: Capital IQ
Stock Performance:
As easily notable by the bellow chart. The company’s stock price has been really hit by the general decline in oil prices.
Furthermore, the chart reveals that the performance of the stock has little correlation with the overall US equity market.
We see this as an additional positive to our thesis because of the possibility of providing the fund with a source of
uncorrelated returns, and to some extent the hedging capabilities against a fall on the value of the dollar.
Looking at returns form a 5 year perspective the stock has significantly underperformed the S & P 500 with a negative
return of 14.94% compared to the 80% return offered by the S & P 500. From a more local perspective CIB has outperformed
the Colombian stock market index (Line in Blue) that has recently been hit hard by oil concerns and is also on negative
territory.
Source: Bloomberg
13. BABSON
College Fund
13
Financials Sector Team October 22/2014
Consensus Recommendations:
According to Bloomberg analysts covering the stock, the issue has a 12 month target price of 50.46, representing a possible
upside of 29.5%. Recent recommendations range from buy/attractive/outperform, to hold and neutral ratings. It is of
worth noting that analyst covering the stock locally have higher price targets and better ratings for the issue. An
explanation for this could be the edge gained by analyst that are closer to the developments of the Colombian economy
and the bank itself. A brief summary of the analyst coverage for CIB is summarized below:
Source: Bloomberg
In addition to using Bloomberg for analyst recommendations, and in order to gain an inside perspective of the business
environment and validate our thesis we concentrated our efforts in contacting somebody local in Colombia who provided
us with a more accurate perspective of the economy and our investment case. He is a VP of investment banking for a
Diversified Global Financial Institution and agreed to share with us any relevant information and discuss our investment
case on a “no name” bases due to company policies. The key themes and highlights from our conversation are as follows:
Oil Concerns. According to the VP, even though the decline in Oil prices will have a tangible effect on Colombian
Exports, the current valuations of some companies suggest that concerns might be a bit over-blown. After all,
even though Oil accounts for 40% of exports Colombia is pretty closed economy and Oil accounts for 8% of
Colombia’s GDP. Also, Colombia exports many other products that now are becoming much cheaper given the
influence of other rising currencies. (i.e.: coffee, pearls, tea, fruits, nuts, etc.)
Economic Outlook. According to the VP, the recent fall in Oil prices will have an effect in the economy, prompting
a slow-down in GDP growth. Yet, he is forecasting GDP to grow somewhere in the 3-4% range for 2015.
Furthermore, according to Colombia’s Finance Minister the Oil drop will only cause GDP growth to slow by 0.3%
in 2015 due to forwards sales of the commodity at higher prices that the current market is implying. He also noted
that last month of March was the first month that the country had more inflows than outflows suggesting at least
some confidence coming back to investors.
Business Environment, Geopolitical Risk. Now is as good a time as ever to consider investing in Colombia, according
to the VP. The newly re-elected president is quite market oriented and welcoming of Foreign Capital Inflows. The
big drug cartels are increasingly becoming something of the past and the terrorist Guerilla organization everyday
loses more power and leverage in peace negotiations. Although it’s hard to predict what will happened the
influence of organized crime every day is less and less.
Bancolombia. Bancolombia has one of the best reputations in financial services in Colombia and Latin America
since it’s foundation in 1945. He sees nothing material in the bank has changed that justifies the stock losing close
to 40% of its value.
14. BABSON
College Fund
14
Financials Sector Team October 22/2014
Valuation
To add some perspective to the value of the company at the current price levels, shares are trading at the same price they
did in 2009, even though the bank is x2.5 times as large as it was then. This implies that will be buying 5 years of growth
free of charge. However, a large portion of the drop has been due to the Colombian Peso. Since the company's shares are
primarily listed in Colombia, the US ADR drops as the Peso declines. Shares have only modestly declined in Colombia,
but have plunged in the US due to the currency conversion. As previously stated, historically the Colombian Peso has
shown resiliency at the 2,500-2,600 range, where we trade now, and there's no economic reason to expect much further
weakening.
Bull Case: Oil rebounds strongly and Colombian growth gets back toward the top end of recent range, EPS and the PE
multiple would likely both be significantly higher leading to a triple-digit share price. If this were to happen the following
is a feasible scenario: 5 years of around-historical average EPS and dividend growth would leave Bancolombia earning
upward of $6/share EPS and paying $2.50/share in dividends in 2020. Against a 15 PE, that leaves us with a $90 share
price and a 6% yield on investment at the current price levels.
Bear Case: Oil stays at $50/barrel through 2020, the COP doesn't recover and GDP only grows at 2% a year. Assuming
Bancolombia marginally grows earnings, producing $4.50/share EPS five years from now. At a 10x PE, we would still be
up on our investment and will have collected a nice dividend along the way.
To conclude on share price we ran three valuation models: A model that focuses on calculating the economic value added
(based upon the company’s asset base, earnings and necessary rate of return), a Dividend Discount Model and finally a
Modern Graham methodology that focuses on intrinsic value. Where: Value = Current (Normalized Earnings) X (8.5 plus
twice the expected growth rate per year). This 8.5 factor comes from Graham’s understanding that a required rate of return
in perpetuity for an investment of $8.5 is 1$. Leading to a discount factor of 11%, which is a valid assumption.
Assumptions: All values are in COP, 1 ADR = 4 shares, Ke (Cost of Equity) is calculated using CIB’s beta in relation to the
Colombian stock exchange COLCAP, the risk free rate corresponds to the yield on Colombian bonds with 10Y TTM, EPS
Growth for the first 2 years in line with estimates from Bloomberg, and growing at x3 times a conservative estimate of 3%
GDP growth, (historically CIB has grown at x3 GDP), Growth rates on DDM are much lower than the 24.52% historical
CAGR of the dividend, payout ratio is the result of the average of the past 5 years.
CAPM
Cost of Equity 8.87%
Beta (COLCAP) 0.835
Market Risk Premium 6.50%
Risk Free Rate (Col 10Y Yield) 3.44%
Modern Graham Valuation EPS
2014 7,978.12
2013 7,114.72
2012 8,051.96
2011 8,448.00
2010 7,293.44
2009 6,381.36
2008 6,552.92
2007 5,733.36
2006 4,119.28
2005 5,204.00
2004 4,012.00
EPSmg 7,779.64
Growth Rate (7-10 yrs): 5.00%
Intrinsic Value of the Stock 143,923.34
Dividend (2015) 3,384.00
Cost of Equity 8.87%
Growth Rate 5% 6% 7%
Per Share Value 87,498.38 118,012.21 181,204.82
Price Target: 127,616.08
Dividend Discount Model (DDM)
15. BABSON
College Fund
15
Financials Sector Team October 22/2014
2015 2016 2017 2018 2019 2020
All figures in Colombian Pesos, 1 ADR = 4 shares of CIB, all items on a per share bases correspond to 1 ADR that equals 4 CIB Shares
Prior Year EPS 8,100.00 9,400.00 10,400.00 11,336.00 12,356.24 13,468.30
EPS growth (1 year) 16.05% 10.64% 9.00% 9.00% 9.00% 9.00%
EPS Forecast 9,400.00 10,400.00 11,336.00 12,356.24 13,468.30 14,680.45
Equity Book Value Forecast (Beginning of the year)71,997.26 78,013.26 84,669.26 91,924.30 99,832.29 108,452.01
EPS 9,400.00 10,400.00 11,336.00 12,356.24 13,468.30 14,680.45
(-) Div per share 3,384.00 3,744.00 4,080.96 4,448.25 4,848.59 5,284.96
Equity Book Value at EOY 78,013.26 84,669.26 91,924.30 99,832.29 108,452.01 117,847.49
Abnormal Earnings
Equity Book Value Forecast (Beginning of the year)71,997.26 78,013.26 84,669.26 91,924.30 99,832.29 108,452.01
Cost of Equity 8.87% 8.87% 8.87% 8.87% 8.87% 8.87%
(=) Normal Earnings 6,384.36 6,917.83 7,508.05 8,151.39 8,852.63 9,616.98
Forecasted EPS 9,400.00 10,400.00 11,336.00 12,356.24 13,468.30 14,680.45
(-) Normal EPS 6,384.36 6,917.83 7,508.05 8,151.39 8,852.63 9,616.98
(=) Abnormal EPS 3,015.64 3,482.17 3,827.95 4,204.85 4,615.67 5,063.47
Valuation
Future Abnormal EPS 3,015.64 3,482.17 3,827.95 4,204.85 4,615.67 5,063.47
Discount Factor 8.87% 8.87% 8.87% 8.87% 8.87% 8.87%
(=) Abnormal EPS discounted to the present2,770.01 2,938.01 2,966.69 2,993.35 3,018.17 3,041.29
Abnormal Earnings in year 6 5,063.47
Long Term Growth Rate 3.00%
Value of the Terminal Year 86,296.84
Sum of Abnormal EPS 14,686.24
PV of the Terminal Year 51,832.89
(=) PV of all AE 66,519.12
Current Book Value of Equity 71,997.26
Estimated Share Price 138,516.38
Summary of Valuation Price Target Weight
Modern Graham 143,923.34 33%
DDM 127,616.08 33%
Economic Value Model 138,516.38 33%
Price Target in COP 136,685.27
ADR Price in COP 97,600.00
Implied Upside 40.05%
16. BABSON
College Fund
16
Financials Sector Team October 22/2014
Appendix 1: CIB’S Financial Statements
Source: Capital IQ
Balance Sheet
Balance Sheet as of: Restated
Dec-31-2009
Restated
Dec-31-2010
Restated
Dec-31-2011
Restated
Dec-31-2012
Reclassified
Dec-31-2013 Dec-31-2014
Currency COP COP COP COP COP COP
ASSETS
Cash And Equivalents 7,372,487.0 4,149,168.0 5,153,445.0 6,160,213.0 15,408,646.0 13,442,129.0
Investment Securities 4,551,908.0 6,201,645.0 5,968,488.0 5,749,437.0 13,805,790.0 13,677,801.0
Trading Asset Securities 2,735,932.0 3,243,024.0 4,733,606.0 7,547,383.0 - -
Mortgage Backed Securities 1,640,688.0 - - - - -
Total Investments 8,928,528.0 9,444,669.0 10,702,094.0 13,296,820.0 13,805,790.0 13,677,801.0
Gross Loans 42,048,371.0 48,611,118.0 61,400,256.0 70,016,384.0 89,459,542.0 107,553,547.0
Allow ance For Loan Losses (2,431,667.0) (2,509,213.0) (2,812,582.0) (3,249,639.0) (4,065,530.0) (4,750,173.0)
Net Loans 39,616,704.0 46,101,905.0 58,587,674.0 66,766,745.0 85,394,012.0 102,803,374.0
Gross Property, Plant & Equipment - 3,245,732.0 4,214,092.0 4,937,992.0 - -
Accumulated Depreciation - (1,064,999.0) (1,211,724.0) (1,404,366.0) - -
Net Property, Plant & Equipment 1,835,095.0 2,180,733.0 3,002,368.0 3,533,626.0 5,110,858.0 5,950,094.0
Goodw ill 855,724.0 750,968.0 679,861.0 571,373.0 3,589,203.0 3,970,690.0
Other Intangibles - 240,768.0 324,140.0 - - -
Accrued Interest Receivable 338,605.0 327,599.0 439,189.0 524,041.0 578,720.0 687,878.0
Other Receivables 472,872.0 535,350.0 654,333.0 722,373.0 497,083.0 465,097.0
Restricted Cash - 2,005,866.0 2,575,552.0 2,008,884.0 - -
Other Current Assets 313,873.0 1,400,078.0 1,992,853.0 2,589,258.0 1,016,519.0 1,172,438.0
Deferred Tax Assets, LT - - 382.0 40,257.0 - -
Other Real Estate Ow ned And Foreclosed 80,668.0 70,277.0 53,194.0 84,818.0 103,565.0 89,491.0
Deferred Charges, LT 185,811.0 40,797.0 409,819.0 699,638.0 690,932.0 546,596.0
Other Long-Term Assets 1,863,998.0 846,978.0 888,116.0 918,334.0 4,620,913.0 5,919,273.0
Total Assets 61,864,365.0 68,095,156.0 85,463,020.0 97,916,380.0 130,816,241.0 148,724,861.0
LIABILITIES
Accounts Payable 1,656,154.0 1,696,201.0 2,173,253.0 2,311,221.0 2,611,114.0 2,604,164.0
Accrued Exp. - 250,904.0 310,454.0 418,251.0 - -
Interest Bearing Deposits 35,841,550.0 24,993,284.0 30,097,696.0 34,483,800.0 71,876,092.0 79,352,328.0
Institutional Deposits - 10,913,467.0 13,522,623.0 19,876,046.0 - -
Non-Interest Bearing Deposits 6,307,780.0 7,632,216.0 8,814,173.0 9,798,874.0 14,680,487.0 15,984,894.0
Total Deposits 42,149,330.0 43,538,967.0 52,434,492.0 64,158,720.0 86,556,579.0 95,337,222.0
Short-term Borrow ings 1,342,201.0 2,559,318.0 5,010,584.0 616,304.0 1,124,802.0 2,115,104.0
Curr. Port. of LT Debt - - - 730,092.0 - -
Long-Term Debt 8,212,772.0 10,966,379.0 15,190,651.0 16,600,635.0 24,836,367.0 27,529,398.0
Curr. Income Taxes Payable - 812.0 - 470.0 - -
Accrued Interest Payable 411,796.0 296,580.0 397,412.0 523,655.0 610,511.0 638,526.0
Other Current Liabilities 47,609.0 180,033.0 139,270.0 157,899.0 464,514.0 1,320,483.0
Unearned Revenue, Non-Current - 45,926.0 45,632.0 39,332.0 - -
Pension & Other Post-Retire. Benefits - 160,489.0 173,181.0 175,663.0 - -
Def. Tax Liability, Non-Curr. - 108,440.0 167,228.0 180,615.0 - -
Other Non-Current Liabilities 905,293.0 273,355.0 354,048.0 315,174.0 1,674,060.0 1,868,223.0
Total Liabilities 54,725,155.0 60,077,404.0 76,396,205.0 86,228,031.0 117,877,947.0 131,413,120.0
Additional Paid In Capital - 1,165,617.0 1,165,617.0 - 2,812,493.0 5,389,349.0
Retained Earnings 5,601,028.0 5,668,850.0 6,720,070.0 10,397,185.0 8,440,655.0 9,987,895.0
Treasury Stock - - - - - -
Comprehensive Inc. and Other 1,037,887.0 651,989.0 646,989.0 717,086.0 813,784.0 959,196.0
Total Common Equity 7,032,829.0 7,947,140.0 8,993,360.0 11,606,955.0 12,492,846.0 16,817,354.0
Minority Interest 106,381.0 70,612.0 73,455.0 81,394.0 445,448.0 494,387.0
Total Equity 7,139,210.0 8,017,752.0 9,066,815.0 11,688,349.0 12,938,294.0 17,311,741.0
Total Liabilities And Equity 61,864,365.0 68,095,156.0 85,463,020.0 97,916,380.0 130,816,241.0 148,724,861.0
Supplemental Items
Total Shares Out. on Filing Date 787.8 787.8 851.8 851.8 851.8 961.8
Total Shares Out. on Balance Sheet Date 787.8 787.8 787.8 851.8 851.8 961.8
Book Value/Share 8,926.87 10,087.42 11,415.4 13,625.95 14,665.94 17,484.8
Tangible Book Value 6,177,105.0 6,955,404.0 7,989,359.0 11,035,582.0 8,903,643.0 12,846,664.0
Tangible Book Value/Share 7,840.69 8,828.59 10,141.01 12,955.19 10,452.41 13,356.52
Average Assets 62,629,596.0 63,355,081.0 75,759,824.0 88,656,613.0 NA NA
Average Loans 43,035,761.0 43,169,504.0 53,073,808.0 62,380,896.0 NA NA
Total Debt 9,554,973.0 13,525,697.0 20,201,235.0 17,947,031.0 25,961,169.0 29,644,502.0
Cash Deposits Int. Bearing 2,388,790.0 3,798,183.0 4,794,684.0 5,065,562.0 3,981,205.0 2,249,304.0
Net Debt (1,214,348.0) 6,133,505.0 10,314,184.0 4,239,435.0 10,552,523.0 16,202,373.0
17. BABSON
College Fund
17
Financials Sector Team October 22/2014
Source: Capital IQ
Income Statement
For the Fiscal Period Ending
Reclassified
12 months
Dec-31-2009
Reclassified
12 months
Dec-31-2010
Reclassified
12 months
Dec-31-2011
Reclassified
12 months
Dec-31-2012
Reclassified
12 months
Dec-31-2013
12 months
Dec-31-2014
Currency COP COP COP COP COP COP
Interest Income On Loans 5,622,967.0 4,464,274.0 5,320,035.0 6,902,370.0 7,641,156.0 8,840,450.0
Interest Income On Investments 804,731.0 531,065.0 653,259.0 807,123.0 552,535.0 583,495.0
Total Interest Income 6,427,698.0 4,995,339.0 5,973,294.0 7,709,493.0 8,193,691.0 9,423,945.0
Interest On Deposits 1,870,643.0 1,054,266.0 1,209,825.0 1,801,721.0 2,002,458.0 1,947,041.0
Total Interest On Borrow ings 754,773.0 517,315.0 832,181.0 1,093,139.0 1,119,668.0 1,293,746.0
Total Interest Expense 2,625,416.0 1,571,581.0 2,042,006.0 2,894,860.0 3,122,126.0 3,240,787.0
Net Interest Income 3,802,282.0 3,423,758.0 3,931,288.0 4,814,633.0 5,071,565.0 6,183,158.0
Trust Income 171,927.0 165,075.0 188,340.0 208,583.0 207,994.0 208,156.0
Credit Card Fee 577,020.0 18,355.0 634,251.0 664,584.0 690,065.0 800,066.0
Gain (Loss) on Sale of Loans (Rev) 53,784.0 85,862.0 48,714.0 43,146.0 31,593.0 18,415.0
Income on Real Estate Property (Rev) (49,779.0) (35,130.0) (2,288.0) (38,353.0) (67,921.0) (31,318.0)
Gain on Sale of Invest. & Secur (Rev) 584.0 45,716.0 121,166.0 82,187.0 3,780.0 1,670.0
Total Other Non-Interest Income 1,083,634.0 1,766,263.0 1,339,650.0 1,594,027.0 1,760,042.0 2,282,606.0
Non-Oper. Income (Exp.) 198,761.0 267,472.0 200,098.0 148,751.0 - -
Total Non Interest Income 2,035,931.0 2,313,613.0 2,529,931.0 2,702,925.0 2,625,553.0 3,279,595.0
Revenue Before Loan Losses 5,838,213.0 5,737,371.0 6,461,219.0 7,517,558.0 7,697,118.0 9,462,753.0
Provision For Loan Losses 1,103,595.0 512,585.0 596,417.0 1,072,520.0 1,162,679.0 1,373,736.0
Total Revenue 4,734,618.0 5,224,786.0 5,864,802.0 6,445,038.0 6,534,439.0 8,089,017.0
Salaries and Other Empl. Benefits 1,125,283.0 1,294,337.0 1,441,858.0 1,637,680.0 1,656,295.0 1,937,775.0
Amort. of Goodw ill & Intang. Assets 69,231.0 55,966.0 51,239.0 45,690.0 78,880.0 397,798.0
Occupancy Expense 185,027.0 195,744.0 223,003.0 319,602.0 428,856.0 537,129.0
Federal Deposit Insurance 74,228.0 84,399.0 90,769.0 105,675.0 135,816.0 160,629.0
Selling General & Admin Exp., Total 1,202,512.0 1,241,357.0 1,479,860.0 1,685,869.0 2,327,908.0 2,514,411.0
Total Other Non-Interest Expense 215,633.0 213,668.0 300,599.0 354,354.0 - -
Non Oper. (Income) Exp. 109,035.0 181,187.0 131,712.0 121,325.0 (42,902.0) (15,468.0)
Total Non-Interest Expense 2,980,949.0 3,266,658.0 3,719,040.0 4,270,195.0 4,584,853.0 5,532,274.0
EBT Excl. Unusual Items 1,753,669.0 1,958,128.0 2,145,762.0 2,174,843.0 1,949,586.0 2,556,743.0
Restructuring Charges (19,725.0) - - - - -
Impairment of Goodw ill - - - - - -
Other Unusual Items - - - - - (89,075.0)
EBT Incl. Unusual Items 1,733,944.0 1,958,128.0 2,145,762.0 2,174,843.0 1,949,586.0 2,467,668.0
Income Tax Expense 462,013.0 508,417.0 470,517.0 467,074.0 417,095.0 589,075.0
Earnings from Cont. Ops. 1,271,931.0 1,449,711.0 1,675,245.0 1,707,769.0 1,532,491.0 1,878,593.0
Earnings of Discontinued Ops. - - - - - -
Extraord. Item& Account. Change - - - - - -
Net Income to Company 1,271,931.0 1,449,711.0 1,675,245.0 1,707,769.0 1,532,491.0 1,878,593.0
Minority Int. in Earnings (15,081.0) (13,217.0) (11,351.0) (5,723.0) (17,364.0) 128.0
Net Income 1,256,850.0 1,436,494.0 1,663,894.0 1,702,046.0 1,515,127.0 1,878,721.0
Pref. Dividends and Other Adj. - - - - - -
NI to Common Incl Extra Items 1,256,850.0 1,436,494.0 1,663,894.0 1,702,046.0 1,515,127.0 1,878,721.0
NI to Common Excl. Extra Items 1,256,850.0 1,436,494.0 1,663,894.0 1,702,046.0 1,515,127.0 1,878,721.0
Per Share Items
Basic EPS 1,595.34 1,823.36 2,112.0 2,012.99 1,778.68 1,994.53
Basic EPS Excl. Extra Items 1,595.34 1,823.36 2,112.0 2,012.99 1,778.68 1,994.53
Weighted Avg. Basic Shares Out. 787.8 787.8 787.8 845.5 851.8 941.9
Diluted EPS 1,595.34 1,823.36 2,112.0 2,012.99 1,778.68 1,994.53
Diluted EPS Excl. Extra Items 1,595.34 1,823.36 2,112.0 2,012.99 1,778.68 1,994.53
Weighted Avg. Diluted Shares Out. 787.8 787.8 787.8 845.5 851.8 941.9
Normalized Basic EPS 1,372.08 1,536.65 1,687.87 1,600.83 1,410.06 1,696.6
Normalized Diluted EPS 1,372.08 1,536.65 1,687.87 1,600.83 1,410.06 1,696.6
Dividends per Share 636.8 668.64 708.0 754.0 776.0 830.0
Payout Ratio % 39.1% 34.9% 31.7% 34.3% 41.7% 38.0%
Shares per Depository Receipt 4.0 4.0 4.0 4.0 4.0 4.0
Supplemental Items
Effective Tax Rate % 26.6% 26.0% 21.9% 21.5% 21.4% 23.9%
Total Current Taxes 459,732.0 497,231.0 410,422.0 483,794.0 - -
Total Deferred Taxes 2,281.0 11,186.0 60,095.0 (16,720.0) - -
Normalized Net Income 1,080,962.1 1,210,613.0 1,329,750.3 1,353,553.9 1,201,127.3 1,598,092.4
NI per SFAS 123 (after Options) NA NA NA NA NA NA
Non-Cash Pension Expense 11,883.0 - 5,040.0 - - -
18. BABSON
College Fund
18
Financials Sector Team October 22/2014
Important Disclosures
Babson College Fund
The Babson College Fund (BCF) is an academic program in which selected students manage a portion of the Babson
College endowment. The program seeks to provide a rich educational experience through the development of investment
research skills and the acquisition of equity analysis and portfolio management experience. Please visit
http://cutler.babson.edu for more information.
Analyst Contact Information
Alfredo Leon | 7347304664 | rdiplock1@babson.edu
Paul Ramey | 6032754515 | pramey1@babson.edu
Ryan Diplock| 4136956343| rdiplock1@babson.edu
Definition of Ratings
BUY: Expected to outperform the S&P500 producing above average returns.
HOLD: Expected to perform in line with the S&P500 producing average returns.
SELL: Expected to underperform the S&P500 producing below average returns.
References
Capital IQ
Thomson ONE
S&P Net Advantage
Bloomberg
Grupo Bancolombia’s Wbesite, Letters to Shareholders, company reports.
Analysts:
VP Local Investment Banking Analyst (Colombia) (Due to company policies, his name cannot be disclosed).