SlideShare a Scribd company logo
1 of 59
Download to read offline
Equities
Nigerian Banks
Nigeria | Banks | 30 January 2015
CSL Stockbrokers is a division of FCMB (UK) Limited which is authorised by the Prudential Regulation Authority
(PRA) and regulated by the Financial Conduct Authority (FCA) in the United Kingdom.
.
A disaster is priced in. Buy.
 We have raised our forecast 2015 cost of risk (COR) for nine Nigerian
banks from an aggregate 1.1% to 4.5% (versus 6.7% in the 2008-9 crisis).
This reduces our forecast 2015e Net Profits by an aggregate 56%.
 Share prices have corrected in the face of: upcoming general elections;
falling oil prices; the deteriorating current account; naira devaluation; fiscal
retrenchment; shortages of capital; and the threat of asset quality problems.
 However, we believe the market has sold down shares excessively. Current
P/BV valuations are at historic lows and in some cases price in the loss of
all profits and of a substantial portion of equity in 2015. By contrast, we
estimate that a COR of 4.5% can largely be absorbed by 2015e earnings.
 We downgrade 2014e, 2015e and 2016e earnings but, prompted by deep
share price corrections, upgrade recommendations in most cases.
 It is one thing to identify cheap stocks: another to identify the catalyst for a
re-rate. The interbank currency market is pricing in a further devaluation of
the naira by the Central Bank of Nigeria (CBN), and we think this is likely
after February’s elections. But we believe the naira will find a level no lower
than N220/US$1 (interbank), only 16% weaker than the current rate.
 Given limited downside potential in the currency and high potential upside in
stock prices, we believe it makes sense for US dollar-based investors to
take positions on a one-year view now – albeit we recognise considerable
investor fatigue with Nigeria that could delay a rally. Conversely, buyers
attempting to participate late in a rally may encounter poor liquidity.
 Our forecasts point to an overall deficit in Nigeria’s balance of payments of
US$8.2bn in H1 2015. We therefore expect a further devaluation to take
place after elections – an initial step in this direction would be a move in the
midpoint of the official band to N183.00/US$. Over time, we think that the
market would stabilise long before it reached N222.00/US$, the ‘fair’ value
implied by inflation differentials.
Source: CSL Research
Recommendation changes
Previous
rating Rating
Current
Price, N
Previous Target
Price, N
New Target
Price, N
Upside
potential
FBNH Hold Buy 7.40 14.70 12.86 74%
Zenith Buy Buy 17.02 31.50 24.60 45%
UBA Hold Buy 3.53 7.40 5.70 61%
Guaranty Trust Bank Buy Buy 20.87 39.80 28.42 36%
Access Bank Hold Buy 5.34 11.00 7.73 45%
Diamond Bank Buy Buy 3.95 8.10 5.27 33%
Fidelity Bank Hold Buy 1.30 3.00 1.86 43%
Sterling Bank Hold Hold 2.50 2.90 1.57 -37%
Stanbic IBTC Hold Hold 27.00 15.50 32.37 20%
Recommendations
STOCK* RATING PRICE
TARGET
PRICE
FBNH Buy N7.40 N12.86
Zenith Bank Buy N17.02 N24.60
UBA Buy N3.53 N5.70
Guaranty Buy N20.87 N28.42
Access Bank Buy N5.34 N7.73
Diamond Bank Buy N3.95 N5.27
Fidelity Bank Buy N1.30 N1.86
Stanbic IBTC Hold N27.00 N32.37
Sterling Bank Hold N2.50 N1.57
* FBNH: FBN Holdings, UBA: United Bank for Africa,
Guaranty: Guaranty Trust Bank
Priced at 28 January
Contact information
Lagos: +234 (0)1 448 5436
Head of Research: Guy Czartoryski
Analysts:
Gloria Obayagbo
Sade Obilomo
Fola Abimbola
Economist: Alan Cameron
+44 (0) 20 7220 1041
Sales: Temi Popoola, CFA
+234 (0) 1 449 5420 ext. 4507
London: +44 (0) 20 7220 1043
cslresearch@fcmb.com
cslresearch@fcmbuk.com
Nigerian Banks
Page 2
Equities
CSL Stockbrokers is a division of FCMB (UK) Limited which is authorised by the Prudential Regulation Authority
(PRA) and regulated by the Financial Conduct Authority (FCA) in the United Kingdom.
.
Investment Summary
 FBN Holdings (FBNH) faced capital shortages in 2014 and has the highest
concentration of oil & gas sector lending (40.0% of Gross Loans) of the banks
in this study. It is addressing its capital issues by managing risk-weighted
assets (RWAs), disposing of – or not renewing – its largest low-yielding
institutional loans. We have modelled a high level COR for 2015e, 5.8%, and
reduced our 2015e Net Profits forecast by 99%. Yet the market prices FBNH as
if it will lose roughly half its equity, and it trades at almost three standard
deviations below its historic P/BV rating.
 Zenith Bank has sufficient capital for several years’ expansion, in our view,
and – in comparison with its peers – has moderate (17.9% of Gross Loans)
exposure to the oil & gas sector. We model a COR of 3.2% for 2015e.
Nevertheless it trades at 1.8 standard deviations lower than its historic average
P/BV and, more significantly, 2.2 standard deviations below its historic market
capitalisation/deposits (Mkt cap/deposits) rating.
 United Bank for Africa (UBA) faced capital issues in 2014 that are currently
being addressed with a 1-for-10 rights issue which we cover in this report. In
comparison with its peers it has moderate (16.0% of Gross Loans) exposure to
the oil & gas sector though, considering its provisioning history, we model a
high COR, 5.2%, in 2015e. Like Zenith Bank, it trades on much lower P/BV
and Mkt cap/deposits than its historical averages.
 Guaranty Trust Bank renews its capital sufficiently for future expansion, in our
view. It has quite high (28.0% of Gross Loans) exposure to the oil & gas
sector, but its COR history suggests that it will manage this better in 2015 than
its peers. We model a COR of 3.2% for 2015e. It trades at significant discounts
to its historic P/BV and Mkt cap/deposits ratings, though not to the same extent
as FBNH, Zenith Bank and UBA.
 Access Bank is dealing with its shortage of capital with a 1-for-3 rights issue,
recently announced and covered in this report. It has moderate to quite high
(24.7%) exposure to the oil & gas sector but a high level of non-performing
loans (NPLs), at 3.6%, in the sector and we model a COR of 4.0% for 2015e. It
trades at 2.4 standard deviations lower than its average historic P/BV.
 Diamond Bank last year dealt with its capital shortages, although we think
there is a 50% chance of a further rights issue this year. It has quite high
(27.0% of Gross Loans) exposure to the oil & gas sector and a COR history
that leads us to model a high, 5.9%, COR in 2015e. It is trading at 1.1
standard deviations lower than its average historic P/BV ratio.
 Neither Fidelity Bank nor Sterling Bank has capital issues, in our view. They
have quite different exposures to the oil & gas sector (17.0% and 33.7% of
Gross Loans, respectively) and we model COR of 3.5% and 4.0%, respectively,
for 2015e. Fidelity Bank trades at 1.8 standard deviations, and Sterling Bank at
0.9 standard deviations, lower than their average historic P/BV ratios.
 Stanbic IBTC, with Net Fees & Commissions fast approaching the level of Net
Interest Income, has implemented an entirely different business model from its
peers. Its investment banking, which includes the leading asset management
business in the country, differentiates its strategy. It is trading at 1.3 standard
deviations above its historic P/BV rating, and we think that this is appropriate.
Nigerian Banks
Page 3
Equities
CSL Stockbrokers is a division of FCMB (UK) Limited which is authorised by the Prudential Regulation Authority
(PRA) and regulated by the Financial Conduct Authority (FCA) in the United Kingdom.
.
Cost of risk – the search for granularity
Over recent weeks banks have begun to give guidance on their cost of risk
(COR) in 2015e which, while more pessimistic than previous guidance, does
not fully capture the potential for rising non-performing loans (NPL) in 2015e, in
our view.
Source: Companies, CSL estimates.
Among the nine banks covered in this report we forecast an aggregate COR of
4.5% in 2015e. This compares with an aggregate COR of some 6.9% for the
same banks during the 2008-9 banking crisis.
Source: Companies, CSL estimates. *simple averages
As with past bank crises, it will doubtless prove impossible to determine exactly
which banks will suffer the worst NPLs and the highest COR in 2015. This
observation informs our view that taking a spread of risk among Nigerian banks
at this stage is likely a better investment strategy than taking a single stock.
History is likely to prove an approximate guide, however, and in the tables
above we compare the COR during the last banking crisis with our new COR
forecasts for 2015e.
Forecast COR versus guidance
COR 2014e
Recent guidance
COR 2015e
Previous CSL
COR 2015e
New CSL
COR 2015e
FBNH 1.1% 1.5% 1.1% 5.8%
Zenith 0.7% "above 1.0%" 0.8% 3.2%
UBA 1.5% n/a 1.5% 5.2%
Guaranty Trust Bank 0.7% below 1.0% 0.5% 3.2%
Access Bank 0.6% 1.0% 0.6% 4.0%
Diamond Bank 3.1% n/a 2.9% 5.9%
Fidelity Bank 1.1% n/a 1.4% 3.5%
Sterling Bank 1.3% "below 1.0%" 1.2% 4.0%
Stanbic IBTC 0.9% 1.5% 1.5% 2.5%
Average cost of risk 1.1% n/a 1.2% 4.5%
COR history versus forecast
2008-2009 2010 2011 2012 2013 2014e 2015e 2016e 2008-12*
FBNH 6.7% 1.8% 3.0% 0.9% 1.2% 1.1% 5.8% 1.0% 3.1%
Zenith 5.3% 0.6% 2.1% 0.9% 1.0% 0.7% 3.2% 0.9% 2.2%
UBA 5.7% 2.7% 2.7% 0.7% 1.6% 1.5% 5.2% 1.7% 2.9%
Guaranty Trust Bank 7.3% 1.3% 2.8% 0.1% 0.3% 0.7% 3.2% 0.7% 2.9%
Access Bank 6.0% 1.0% 1.7% -1.6% -0.8% 0.6% 4.0% 2.5% 1.8%
Diamond Bank 12.4% 6.8% 14.8% 3.3% 3.5% 3.1% 5.9% 2.8% 9.3%
Fidelity Bank 8.4% 1.8% 6.7% 1.4% 1.9% 1.1% 3.5% 1.6% 4.6%
Sterling Bank 14.6% 1.7% 4.3% -0.1% 2.9% 1.3% 4.0% 1.9% 5.1%
Stanbic IBTC 4.2% 0.4% 1.5% 2.5% 0.9% 0.9% 2.5% 1.4% 2.2%
Aggregate 6.9% n/a n/a n/a n/a 1.1% 4.5% 1.5% 2.80%
Nigerian Banks
Page 4
Equities
CSL Stockbrokers is a division of FCMB (UK) Limited which is authorised by the Prudential Regulation Authority
(PRA) and regulated by the Financial Conduct Authority (FCA) in the United Kingdom.
.
A note on methods
As a straightforward method of augmenting forecast COR in 2015e we have
taken our existing COR assumptions and increased them by assuming that a
proportion of US dollar lending, which in many cases approximates to lending
to the oil & gas sector, become loss loans in 2015e, with no collateral collection
and therefore with 100% provisions required. Though this simplifies the risk
outlook (NPLs are likely to come from several sources) it provides a benchmark
for modelling risk across banks.
The data for the 2008-9 banking crisis is complicated by the fact that banks had
widely differing year-ends at the time, which the CBN later harmonised to 31
December. However, we have made adjustments to reach an annualised
aggregate cost of risk during this period.
How realistic is the COR history from 2009?
A notable feature of the COR history was the apparent resurfacing of relatively
high COR in 2011. This was in part due to the exceptionally large Zenon
company loan which gave rise to NPLs at several banks in 2011 as well as new
management teams at other banks that decided to clear backlogs of legacy
NPLs.
In addition, the COR data for the five banks that were taken under CBN control
as a result of the last crisis (Intercontinental Bank, Oceanic Bank, Afribank,
Spring Bank and Bank PHB) are not available, so the above table does not
represent a true crisis-versus-crisis comparison.
Will 2015 be a repeat of the 2009 crisis?
We do not think that 2015 will be as severe as 2009. The worst NPLs of the
2008-9 crisis arose from margin lending, which was widespread, and from
related-party lending. Soon after the crisis the CBN took measures to
significantly restrict, where it did not actually outlaw, both practices. As a result
we think it is unlikely that the stock market decline will, of itself, cause many
NPLs in 2015.
As for related-party lending, in 2009 the CBN required banks to provision fully
for related-party loans, whether these were performing or not. This is one
factor in our assessment that COR in 2015 may not reach the levels seen
during the 2008-9 crisis.
Reporting has significantly improved since 2009, with the introduction of IFRS,
and banks now publishing on a regular basis not only breakdowns of Gross
Loans but also breakdowns of NPLs by industry segment. However, good
reporting is the not the same thing as good credit (although it is usually a
precondition), so the prospect of high NPLs remains.
The regulatory response
The regulatory response is discussed in depth on pages 17-19. For the
purposes of comparing 2009 with 2015 we note the differing fiscal situations.
As the International Monetary Fund (IMF) puts it in the press release at the end
of its annual mission (19 December 2004):
Nigerian Banks
Page 5
Equities
CSL Stockbrokers is a division of FCMB (UK) Limited which is authorised by the Prudential Regulation Authority
(PRA) and regulated by the Financial Conduct Authority (FCA) in the United Kingdom.
.
“However, fiscal and external buffers are low and there is less policy
space for manoeuvring, compared to the onset of the 2008-9 financial
crisis – the Excess Crude Account (ECA) was $21bn compared to
$3bn now, while gross international reserves were $52bn.”
The most recent reading for gross international reserves is US$34bn. In other
words, we do not expect a fiscal stimulus to be even possible in 2015, while in
2009 a fiscal stimulus and specific liquidity measures from the CBN, and its
generally accommodative stance, were key elements of the authorities’
management of the crisis.
Another AMCON?
Could there be another Asset Management Corporation of Nigeria (AMCON), a
sort-of “AMCON 2” to deal with the upcoming crisis? We recall that banks
already pay 0.5% of total assets per annum to fund AMCON, which was set up
in 2010 to buy outstanding NPLs arising from the 2008-9, crisis.
The answer to this question is that there already is such a mechanism, the
CBN’s intervention fund to support loans to the power sector. The Power
Sector Intervention Fund, announced in September 2014, is to be financed by
the CBN in collaboration with deposit money banks. Beneficiary power
companies are to be given a moratorium and repay loans over a 10 year
period.
However, funds such as these risk re-introducing liquidity into the banking
system, creating precisely the danger the CBN addresses in the foreign
exchange market. We therefore think that the CBN will be wary of creating a
full-fledged “AMCON 2” to deal with upcoming NPLs.
Nigerian Banks
Page 6
Equities
CSL Stockbrokers is a division of FCMB (UK) Limited which is authorised by the Prudential Regulation Authority
(PRA) and regulated by the Financial Conduct Authority (FCA) in the United Kingdom.
.
Granularity – the roots of 2015’s NPLs
The obvious place to look for NPLs in 2015 is the oil & gas sector because oil
prices have declined from an average of US$98.2/bbl in 2014 to an average
US$48.3/bbl year-to-date. In conversations with banks over the past few
weeks we have learned that in upstream oil & gas their loans are predicated on
economic models in which their customers earn US$50.00-70.00/bbl. Clearly,
these stress tests are about to be put into practice. Yet the authorities, as well
as banks themselves, believe that it will be possible to restructure loans –
apparently with little effect on asset quality in the short term.
Source: Companies, CSL Research. *GTB=Guaranty Trust Bank. Data is for 9M 2014 except for
UBA and Guaranty Trust Bank where it is for H1 2014.
Remarkably, (a huge improvement on 2009) almost all the banks disclose the
NPL positions in their oil & gas NPLs.
Source: Company, CSL Research estimates. *GTB=Guaranty Trust Bank. Data is for 9M 2014
except for Guaranty Trust Bank where it is for H1 2014.
Concentration of risk: oil & gas sector loans
192%
53% 60%
87%
102%
132%
51%
65%
175%
0%
20%
40%
60%
80%
100%
120%
140%
160%
180%
200%
Oil & Gas sector exposure as percentage of equity
40.0%
17.9% 16.0%
28.0%
24.7%
27.0%
17.0% 19.0%
33.7%
0.0%
5.0%
10.0%
15.0%
20.0%
25.0%
30.0%
35.0%
40.0%
45.0%
50.0%
Oil & Gas sector exposure as percentage of gross loan book
Percentage oil & gas loans that are NPLs
1.4%
1.6%
1.3%
3.6%
0.7%
2.5%
1.2%
0.7%
0.0%
1.0%
2.0%
3.0%
4.0%
5.0%
FBNH Zenith
Bank
UBA GTB* Access
Bank
Diamond
Bank
Fidelity
Bank
Stanbic
Bank
Sterling
Bank
Oil & Gas sector NPL/Oil & Gas Loans
Nigerian Banks
Page 7
Equities
CSL Stockbrokers is a division of FCMB (UK) Limited which is authorised by the Prudential Regulation Authority
(PRA) and regulated by the Financial Conduct Authority (FCA) in the United Kingdom.
.
And from this we derive oil & gas NPLs as a percentage of Gross Loans.
Source: Company, CSL Research estimates
Clearly, this is historic information and, since most of it come from 9M 2014,
before the most severe falls in oil prices, the NPL data shows only a very small
part of the problem we expect to see in 2015. It is historic data and only an
approximate guide to what is likely to happen next.
Conclusions
At this stage, however, we can identify the outliers as FBNH, Diamond Bank
and Sterling Bank because of their overall risk exposures to oil & gas, to which
we can add Access Bank because of its historic NPL level in the sector. The
(un)available data also leaves a question mark over UBA.
Sub-sectors
Even if most of the oil & gas producers can escape problems servicing their
loans, we doubt the same will be true of their suppliers, and we already hear
reports of capital expenditure being cut and service contracts pared back or
cancelled.
We therefore expect the oil services sector to be negatively impacted. By
contrast, we do not think downstream oil will be much affected, unless
petroleum marketers have locked themselves into high crude oil prices at a
time when prices at the pump are falling (this unfortunate arrangement has
occurred in the past). But, generally, we rate oil price falls as good for
petroleum marketers as subsidies fall and they become less dependent on
government to reimburse them (government reimbursements are frequently
late, in our understanding).
Percentage of Gross Loans that are oil & gas NPLs
0.6%
0.3%
0.4%
0.9%
0.2%
0.4%
0.2% 0.2%
0.0%
0.2%
0.4%
0.6%
0.8%
1.0%
FBNH Zenith
Bank
UBA GTB* Access
Bank
Diamond
Bank
Fidelity
Bank
Stanbic
Bank
Sterling
Bank
Oil & Gas sector NPL/Gross loans
Nigerian Banks
Page 8
Equities
CSL Stockbrokers is a division of FCMB (UK) Limited which is authorised by the Prudential Regulation Authority
(PRA) and regulated by the Financial Conduct Authority (FCA) in the United Kingdom.
.
Valuation histories
Valuations of most Nigerian bank stocks (Stanbic IBTC is an important
exception) are at multi-year lows. For the four largest banks (FBNH, Zenith
Bank, UBA and Guaranty Trust Bank) we measure this in terms of both historic
P/BV and Market Capitalisation/Deposits (Mt Cap/Deposits), and for others just
historic P/BV. We take BV and Deposits at quarterly intervals 2010-Q3 2014
and use CSL 2014e BV and Deposits forecasts for the current period.
Source: Bloomberg (prices), CSL Research
FBNH trades at almost three standard deviations lower than its average historic
P/BV over the past four years, and exactly two standard deviations lower than
its average historic Mkt Cap/Deposits percentage valuation over the same
period. Even if we take our target 2015e P/BV for FBNH of 0.8x (rather than the
average 1.1x in the historical series above), the market is currently discounting
a loss of half its 2014e equity during 2015e.
Source: Bloomberg (prices), CSL Research
Zenith Bank trades at 1.8 standard deviations lower than its average historic
P/BV over the past four years, and 2.2 standard deviations lower than its
Valuation history: FBNH
0.40
0.60
0.80
1.00
1.20
1.40
1.60
1.80
Jan-10 Jul-10 Dec-10 Jun-11 Dec-11 Jun-12 Dec-12 Jun-13 Dec-13 Jun-14 Dec-14
First Bank Historic P/BV Average -1SD +1SD
5%
10%
15%
20%
25%
30%
35%
40%
45%
Jan-10 Jul-10 Dec-10 Jun-11 Dec-11 Jun-12 Dec-12 Jun-13 Dec-13 Jun-14 Dec-14
FBNH Mkt Cap/ Deposits Average -1SD +1SD
Valuation history: Zenith Bank
0.70
0.90
1.10
1.30
1.50
1.70
1.90
Jan-10 Jul-10 Dec-10Jun-11Dec-11Jun-12Dec-12Jun-13Dec-13Jun-14Dec-14
Zenith Bank Historic P/BV Average -1SD +1SD
15%
20%
25%
30%
35%
40%
45%
Jan-10 Jul-10 Dec-10 Jun-11 Dec-11 Jun-12 Dec-12 Jun-13 Dec-13 Jun-14 Dec-14
Mkt Cap/Deposits Average -1SD +1SD
Nigerian Banks
Page 9
Equities
CSL Stockbrokers is a division of FCMB (UK) Limited which is authorised by the Prudential Regulation Authority
(PRA) and regulated by the Financial Conduct Authority (FCA) in the United Kingdom.
.
average historic Mkt Cap/Deposits percentage valuation over the same period.
The results for this study for Zenith Bank are less acute than for FBNH: Zenith
Bank is better capitalised than FBNH, in our opinion, and is a much less volatile
stock.
Source: Bloomberg (prices), CSL Research
UBA trades at 1.7 standard deviations lower than its average historic P/BV over
the past four years, and 1.8 deviations lower than its average historic Mkt
Cap/Deposits percentage over the same period.
Source: Bloomberg (prices), CSL Research
Guaranty Trust Bank trades at 1.2 standard deviations lower than its average
historic P/BV over the past four years, and 1.6 standard deviations lower than
its average historic Mkt Cap/Deposits percentage over the same period.
Despite remarkably poor performance of the stock over the past three months
– the stock is down 22% – it remains true that the market has not de-rated
Guaranty Trust Bank to the same extent as other banks.
Among the biggest four banks in Nigeria, FBNH appears to be the most over-
sold in relation to its valuation history, followed by Zenith Bank, UBA and
Guaranty Trust Bank.
Valuation history: UBA
0.10
0.30
0.50
0.70
0.90
1.10
1.30
1.50
1.70
Jan-10 Jul-10 Dec-10 Jun-11 Dec-11 Jun-12 Dec-12 Jun-13 Dec-13 Jun-14 Dec-14
UBA Historic P/BV Average -1SD +1SD
0%
5%
10%
15%
20%
25%
Jan-10 Jul-10 Dec-10 Jun-11 Dec-11 Jun-12 Dec-12 Jun-13 Dec-13 Jun-14 Dec-14
UBA Mkt Cap/Deposit Average -1SD +1SD
Valuation history: Guaranty Trust Bank
0.30
0.80
1.30
1.80
2.30
2.80
3.30
Jan-10 Jul-10 Dec-10 Jun-11 Dec-11 Jun-12 Dec-12 Jun-13 Dec-13 Jun-14 Dec-14
GTB Historic P/BV Average -1SD +1SD
20%
30%
40%
50%
60%
70%
80%
Jan-10 Jul-10 Dec-10 Jun-11 Dec-11 Jun-12 Dec-12 Jun-13 Dec-13 Jun-14 Dec-14
GTB Mkt Cap/Deposits Average -1SD +1SD
Nigerian Banks
Page 10
Equities
CSL Stockbrokers is a division of FCMB (UK) Limited which is authorised by the Prudential Regulation Authority
(PRA) and regulated by the Financial Conduct Authority (FCA) in the United Kingdom.
.
With the next four banks by balance sheet size we restrict our study to historic
P/BV valuations.
Source: Bloomberg (prices), CSL Research
Access Bank trades at 2.4 standard deviations lower than its average historic
P/BV over the past four years. While this is not as acute at FBNH’s discount,
we also rate Access Bank as something of a special case. Even if we take our
target 2015e P/BV for Access Bank of 0.7x (rather than the average 0.8x in the
historical series above), the market is currently discounting a loss of about 30%
of its 2014e equity during 2015e.
Source: Bloomberg (prices), CSL Research
Diamond Bank trades at 1.1 standard deviations lower than its average historic
P/BV over the past four years.
Valuation history: Access Bank
0.30
0.40
0.50
0.60
0.70
0.80
0.90
1.00
1.10
1.20
Jan-10 Jul-10 Dec-10 Jun-11 Dec-11 Jun-12 Dec-12 Jun-13 Dec-13 Jun-14 Dec-14
Access Bank Historic P/BV Average -1SD +1SD
Valuation history: Diamond Bank
0.10
0.30
0.50
0.70
0.90
1.10
1.30
Jan-10 Jul-10 Dec-10 Jun-11 Dec-11 Jun-12 Dec-12 Jun-13 Dec-13 Jun-14 Dec-14
Diamond Bank Historic P/BV Average -1SD +1SD
Nigerian Banks
Page 11
Equities
CSL Stockbrokers is a division of FCMB (UK) Limited which is authorised by the Prudential Regulation Authority
(PRA) and regulated by the Financial Conduct Authority (FCA) in the United Kingdom.
.
Source: Bloomberg (prices), CSL Research
Fidelity Bank trades at 1.8 standard deviations lower than its average historic
P/BV over the past four years.
Source: Bloomberg (prices), CSL Research
In stark contrast to the trend in other Nigerian banks, Stanbic IBTC trades at
1.3 standard deviations above its average historic P/BV over the past four
years. This is attributable to its status as an investment bank, with its revenues
principally derived from asset management, wealth management, corporate
financial advice, stockbroking and custody. The success of these business
lines means that its Fee & Commission Income is expanding, almost reaching
the level of its Net Interest Income. It is given a premium rating by the market.
Valuation history: Fidelity Bank
0.10
0.20
0.30
0.40
0.50
0.60
0.70
0.80
Jan-10 Jul-10 Dec-10 Jun-11 Dec-11 Jun-12 Dec-12 Jun-13 Dec-13 Jun-14 Dec-14
Fidelity Bank Plc Average -1SD +1SD
Valuation history: Stanbic IBTC
0.10
0.60
1.10
1.60
2.10
2.60
3.10
Jan-10 Jul-10 Dec-10 Jun-11 Dec-11 Jun-12 Dec-12 Jun-13 Dec-13 Jun-14 Dec-14
Stanbic Bank Historic P/BV Average -1SD +1SD
Nigerian Banks
Page 12
Equities
CSL Stockbrokers is a division of FCMB (UK) Limited which is authorised by the Prudential Regulation Authority
(PRA) and regulated by the Financial Conduct Authority (FCA) in the United Kingdom.
.
Source: Bloomberg (prices), CSL Research Company, CSL Research estimates
Sterling Bank trades at 0.9 standard deviations lower than its average historic
P/BV over the past four years.
Conclusion
The clear outliers in this study are FBNH, trading at 2.9 standard deviations
lower that its average historic P/BV rating 2010-present, and Access Bank,
trading at 2.4 standard deviations lower than its average historic P/BV rating
2010-present. Closer to their average historic P/BV ratings – but still
significantly cheaper than average – are Guaranty Trust Bank, at 1.2 standard
deviations lower; Diamond Bank at 1.1 standard deviations lower; and Sterling
Bank at 0.9 standard deviations lower than their average historic P/BV ratings
2010-present. Stanbic IBTC is the exception, the only bank trading above its
historic P/BV rating.
This suggests that, should a post-election devaluation rally occur, which we
think is likely, the shares of FBNH and Access Bank could be significantly more
volatile than other bank stocks.
Valuation history: Sterling Bank
0.10
0.30
0.50
0.70
0.90
1.10
1.30
1.50
1.70
1.90
Jan-10 Jul-10 Dec-10 Jun-11 Dec-11 Jun-12 Dec-12 Jun-13 Dec-13 Jun-14 Dec-14
Sterling Bank Historic P/BV Average -1SD +1SD
Nigerian Banks
Page 13
Equities
CSL Stockbrokers is a division of FCMB (UK) Limited which is authorised by the Prudential Regulation Authority
(PRA) and regulated by the Financial Conduct Authority (FCA) in the United Kingdom.
.
The naira – finding a floor at N220/US$1
If few investors believed that Nigeria could get away with an 8% devaluation in
November 2014, when the oil price had fallen from US$110/bbl to US$78/bbl,
even fewer believe it can hang on now that oil has slumped another 40% to just
over US$45/bbl. The consensus is that it is only a matter of time before the
naira is devalued again.
In order to understand the impact of lower oil prices on the exchange rate, we
have created simplified forecasts for Nigeria’s balance of payments over H1
2015. (Official data only exist to Q2 2014, so H2 2014 figures are also
estimates.) The first and most obvious effect is a decline in export receipts from
an average of US$23.6bn over the Q1 2011-Q2 2014 to roughly half that
amount at present.
Source: Central Bank of Nigeria, CSL estimates
A weaker exchange rate may also cause a drop in imports, but the impact is
unlikely to be dramatic, at least not compared to the fall in export revenues. In
a relatively optimistic scenario, for example, a 10% devaluation of the nominal
exchange rate would deliver a 4% contraction in imports. Given the 15%
depreciation of the inter-bank FX rate from N162/US$ to 191/US$, the implied
reduction of the import bill is 6%. This would save the country roughly US$800-
850m in FX reserves per quarter – a modest sum relative to lost export
revenues of around US$11.0bn over the same period. Nigeria cannot hope to
(re)balance its external accounts simply by making imports more expensive.
The more significant changes on the imports side are likely to come from
agricultural and industrial policies encouraging the substitution of imported
goods for locally manufactured ones. Even before the recent crash in oil prices,
these policies were beginning to bear fruit: Nigeria’s quarterly import bill has
fallen from a high of US$4.8bn (on average) in 2011-2012 to US$3.7bn in 2013
and US$3.3bn in H1 2014. Although the official figures confirming this
adjustment have yet to be published – the latest national ‘food balance sheets’
from the UN’s Food and Agriculture Organisation (FAO) date back to 2012, as
do those from the Federal Ministry of Agriculture and Rural Development
Nigeria balance of payments forecasts, US$m
Q114 Q214 Q314e Q414e Q115f Q215f
Current Account 4,591 1,545 3,389 -847 -1,893 -1,240
Goods (net) 9,258 8,355 7,666 3,099 1,096 1,750
Exports 22,733 23,054 21,596 16,089 12,533 12,533
Imports -13,475 -14,699 -13,930 -12,990 -11,437 -10,784
Crude Oil & Gas Imports -2,672 -4,014 -4,332 -3,968 -2,956 -2,303
Non-Oil Imports -10,803 -10,686 -9,598 -9,022 -8,481 -8,481
Services (net) -5,436 -6,400 -5,524 -5,192 -4,881 -4,881
Income (net) -4,658 -6,125 -4,296 -4,296 -3,652 -3,652
Current Transfers (net) 5,427 5,715 5,543 5,543 5,543 5,543
Capital & Financial Account (ex Reserves) -3,066 -861 -711 -711 -711 -711
Net Errors & Omissions -6,983 -754 -3,150 -2,347 -1,828 -1,828
Overall Balance -5,458 -70 -473 -3,905 -4,433 -3,779
Nigerian Banks
Page 14
Equities
CSL Stockbrokers is a division of FCMB (UK) Limited which is authorised by the Prudential Regulation Authority
(PRA) and regulated by the Financial Conduct Authority (FCA) in the United Kingdom.
.
(FMARD) – the Nigerian corporates in our network acknowledge that significant
progress has been made.
Source: Central Bank of Nigeria
In the absence of these policies, imports would likely have grown in line with
overall economic growth, creating demand for FX and putting even greater
pressure on the naira. Now that a devaluation has occurred, their
implementation appears all the more urgent.
Elsewhere in the BOP, limited scope for adjustment
Elsewhere in the balance of payments, the impact of lower oil prices and a
weaker naira is difficult to predict, but unlikely to be great. Demand for services
may experience a modest decline as prices rise, while current transfers, made
up of remittances by Nigerians working abroad, will not be much affected, in
our view. The income account, consisting mainly of dividend repatriations, is
likely to fall in line with the depreciation of the FX rate, our assumption being
that the naira-denominated profits of foreign-owned companies will be
constant.
The prospect of uplift in the financial account, driven by fresh portfolio inflows,
is relatively small in our view. The catalysts for inflows over the past five years
were the relaxation of the one-year holding period rule (July 2011) and more
importantly Nigeria’s inclusion in the JP Morgan GBI-EM Index (announced
August in 2012, effective from October 2012). Nigeria also offered very high
nominal and real interest rates, at a time when the global search for yield was
reaching a peak (the US Fed’s ‘QE3’ was announced in September 2012).
The global environment is now much less conducive to large EM inflows. The
Fed’s QE programme is over, EM growth is decelerating and general risk
appetite has been dented by the crash of oil prices and various geopolitical
crises. According to estimates from the Institute of International Finance (IIF),
total non-resident flows to emerging markets fell by 20% last year with a further
drop of 2% expected for this year. At the same time, the list of countries
offering high nominal and real yields has multiplied (Brazil, Russia, Turkey,
India, Venezuela, etc).
Nigeria’s imports, US$m
0
2,000
4,000
6,000
8,000
Q109 Q309 Q110 Q310 Q111 Q311 Q112 Q312 Q113 Q313 Q114
Nigerian Banks
Page 15
Equities
CSL Stockbrokers is a division of FCMB (UK) Limited which is authorised by the Prudential Regulation Authority
(PRA) and regulated by the Financial Conduct Authority (FCA) in the United Kingdom.
.
We think it will be much harder for Nigeria to stand out in the current global
environment, especially as elections approach and perceptions of its political
and economic stability have been shaken. In fact, the challenge for Nigeria will
be to remain in the JP Morgan GBI-EM index, for which it was recently placed
on negative watch. At present, we estimate the total offshore positioning in the
Nigerian bond market at US$7.9bn, about the double the amount implied by its
current weight in the index. It is difficult to imagine that inflows could pick up
from here.
The only other significant change in the external accounts is likely to take place
in the net errors and omissions line, which is normally a balancing item but in
Nigeria’s case a proxy for informal imports and other ‘leakages’ (ie missing oil).
Because the market value of any stolen oil is likely to have fallen in line with its
international benchmark, the corresponding shortfall in the balance of
payments should adjust too. The same logic applies to fuel subsidy fraud,
historically a large contributor to FX demand. Now that the cost of delivering
refined fuel (N90.64/litre, as of 23 January 2015) is close to the actual retail
price (N87.00/litre), the incentive to exploit the subsidy regime has been greatly
reduced.
The collective impact of these adjustments, in our view, is an overall deficit in
the balance of payments of US$8.2bn in the first two quarters of 2015. We
think this is more than the CBN is willing to pay, and probably more than it is
able to pay over a horizon longer than two quarters. Some (further) degree of
FX depreciation must therefore be built into our forecasts.
Toward a measure of ‘fair’ value
The balance of payments projections give us some insight into the source and
scale of pressure on the FX rate but they do not, on their own, tell us what may
constitute a fair value for the naira. In order to assess the credibility of the
CBN’s exchange rate policy we look at its own balance sheet, comparing liquid
assets (FX reserves) to liquid liabilities (currency outstanding plus demand
deposits). This tells us the level at which the CBN would be capable of
converting outstanding liabilities into hard currency, if all cash and depositors
rushed for the door today.
According to data for end of December 2014, this rate had fallen to
N183.00/US$, representing an 8% discount to the official rate of N168.00/US$.
However, were it not for November’s MPR hike from 12.00% to 13.00%, we
think that the dollarization rate would have been even weaker. (MPR hikes are
implemented by OMO bill sales on behalf of the CBN, which turn cash and
demand deposits into longer-term liabilities.)
Nigerian Banks
Page 16
Equities
CSL Stockbrokers is a division of FCMB (UK) Limited which is authorised by the Prudential Regulation Authority
(PRA) and regulated by the Financial Conduct Authority (FCA) in the United Kingdom.
.
Source: Central Bank of Nigeria, CSL Research
A second method for establishing a currency’s relative value is the real
effective exchange rate index, a measure based on inflation differentials
weighted by trading partner. According to the relevant index compiled by the
IMF, the naira was overvalued by 34% in real terms in October 2014, at which
point its market rate was N165.00-166.00/US$. This implies a fair value in the
region of N221.00-222.00/US$.
Overall, our sense is that the CBN will continue to defend the naira at current
levels until after elections, using both administrative measures to curtail
demand for US$ dollars and sporadic interventions to meet shortfalls in supply.
Over time, however, the gap between demand and supply is likely to be
bridged by weakening the official exchange rate, especially if the oil price does
not recover quickly. An initial step in this direction, in our view, would be a
weakening of the official rate to bring the inter-bank rate within the targeted
band of +/- 5%. Given a current inter-bank level of N189.42/US$ (29 January),
the official rate would need to move to N182.00/US$.
Inter-bank and ‘dollarisation’ rates, N/US$
20
40
60
80
100
120
140
160
180
200
Jan-07 Jan-08 Jan-09 Jan-10 Jan-11 Jan-12 Jan-13 Jan-14
Inter-bank FX rate
Dollarisation rate
Nigerian Banks
Page 17
Equities
CSL Stockbrokers is a division of FCMB (UK) Limited which is authorised by the Prudential Regulation Authority
(PRA) and regulated by the Financial Conduct Authority (FCA) in the United Kingdom.
.
The regulatory response
In an environment of falling oil prices and rising pressure on the FX rate, there
are questions about how the CBN will respond and what impact this will have
on the profitability of the banking sector. The common assumption is that
monetary policy will remain tight – the only question is whether this would be
achieved via hikes in the benchmark interest rate or the cash reserve
requirement. The former come at the expense of the CBN: the latter come at
the expense of commercial banks.
Source: Central Bank of Nigeria, CSL Research
For most of the current era of high interest rates (starting in October 2011) the
CBN has shouldered a disproportionate share of the burden of tight monetary
policy, its outstanding OMO bills exceeding the level of statutory DMB reserves
by a comfortable margin. However the balance looks to have swung in favour
of the CBN after November’s CRR hike, which increased the level of statutory
reserves by N533bn, sterilising liquidity that banks may have put to another
purpose.
The hope among investors was that the extra burden imposed on banks by
CRR hikes would be accompanied by accommodation in a different form,
especially once Governor Lamido Sanusi had been forced out. Current CBN
Governor Godwin Emefiele, until recently a commercial banker himself, would
see the logic of re-instating COT charges, ATM fees and other lines of revenue
that enabled banks to diversify away from Net Interest Income, it was argued.
This was the path successfully followed in several other emerging markets.
The CBN’s view is in fact rather different: the message from our recent
meetings there is that the banking sector must first learn to compete in
traditional lending before they can be given handouts in the form of COT and
ATM charges. In their view, the oligopolistic structure of Nigeria’s banking
sector has undermined competition in traditional forms of lending, resulting in
CBN OMO bills and DMBs’ required reserves, Nm
0
1,000
2,000
3,000
4,000
5,000
6,000
7,000
8,000
Jan-10 Sep-10 May-11 Jan-12 Sep-12 May-13 Jan-14 Sep-14
CBN OMO Bills Outstanding
DMBs' Required Reserves
Nigerian Banks
Page 18
Equities
CSL Stockbrokers is a division of FCMB (UK) Limited which is authorised by the Prudential Regulation Authority
(PRA) and regulated by the Financial Conduct Authority (FCA) in the United Kingdom.
.
inflated profits for banks and unnecessarily high interest rates for the average
user of capital.
Although we do see the CBN’s point – spreads at Nigerian banks have
historically been quite high – the gap has been closing, and is no longer out of
step with global norms. Looking across a sample of EM economies shown in
the chart below, Nigerian banks are far from the worst offenders. In fact, the
ratio of Nigeria’s prime lending rate to policy rate is one of the lowest in sample,
behind only China and Mexico, which have considerably deeper financial
markets.
Source: National central banks, Bloomberg, IMF
Arguably the prime lending rate is available to only a small minority of bank
customers, with the median lending rate actually much higher than the figures
depicted here. It is common among colleagues in Lagos to hear of payday
loans charging interest rates of 30%, or auto loans charging 28%.
Diverging views on credit quality
To the extent that we differ with the CBN on the benefits of accommodating
banks, it is likely because we have a more bearish outlook on the sector’s
profitability this year. In our recent discussions in Abuja, it was clear that the
CBN found our baseline scenario, in which the cost of risk for the banks under
our coverage rises to 4.5% this year, a little extreme. And to be fair, the CBN
does have better access to information than most analysts and investors,
including the ability to see sector exposures on a loan by loan basis with
relevant term sheets.
Yet we are not convinced that the CBN is acknowledging the full extent of
macro prudential risks. One needs only think back to the summer of 2011 for
an example of how a single NPL – to Zenon Petroleum, in this case – took on
systemic importance, driving valuations across the sector down to historically
low levels. At the time, the Zenon loan represented less than 1% of sector-wide
Policy rates and prime lending rates, %
0.00
5.00
10.00
15.00
20.00
25.00
Poland
Mexico
Chile
Malaysia
Colombia
China
SouthAfrica
Indonesia
India
Egypt
Brazil
Nigeria
Russia
Policy Rate, %
Prime Lending Rate, %
Nigerian Banks
Page 19
Equities
CSL Stockbrokers is a division of FCMB (UK) Limited which is authorised by the Prudential Regulation Authority
(PRA) and regulated by the Financial Conduct Authority (FCA) in the United Kingdom.
.
assets, and about 6% of total shareholders’ equity, based on average values
for the year. The most recent Financial Stability Report, published by the CBN
in late 2014, does not appear to test the impact of FX rate weakness on credit
quality.
As discussed in our note on the banking sector at the end of last year (see 12
December 2014, CSL_Nigerian Banks and FX Devaluation) we are
concerned about the impact of lower oil prices and a weakening exchange rate
on the FX side of banks’ books. Although individual banks’ disclosures do not
give us the full picture, using data from the CBN database we estimate total
foreign currency loans at US$19.7bn, equal to 29% of total private sector loans
and advances. While the majority of these loans are likely to have been made
to the oil and gas sector, a sizable minority has gone to sectors with no real
source of FX revenues, in our view.
Source: Central Bank of Nigeria, CSL Research
Our view on the potential impact of lower oil prices and a weakening exchange
rate is corroborated by the outcome of stress tests conducted by the IMF in
collaboration with CBN and commercial banks. One the scenarios modelled
featured ‘multi-factor shocks’ in which the oil price dropped to US$50/bbl, the
naira depreciated by 30% and the stock market fell 30%. The result was a
200% increase in banks’ aggregate NPLs, spread evenly across the major
sectors which they finance. Working with data from Q3 2014, this would
translate in a cost of risk of approximately 3.1% for 2015.
Admittedly this is less than the 4.5% modelled in our base case scenario, but
the oil price is now below US$50/bbl, the full extent of the necessary exchange
rate adjustment is being delayed (in our view), and the stock market, while
down 30% from the highs of 2014, may continue to slide. Moreover, as the IMF
discloses in its note, data limitations mean that there was a subjective element
to its conclusions.
Nigerian banks’ FX assets and liabilities
-8,000
-6,000
-4,000
-2,000
0
2,000
4,000
6,000
8,000
Jun-09 Mar-10 Dec-10 Sep-11 Jun-12 Mar-13 Dec-13 Sep-14
Foreign Assets (Placements with Banks Abroad)
FX Loans (Implied)
FX deposits
Other foreign liabilities
Nigerian Banks
Page 20
Equities
CSL Stockbrokers is a division of FCMB (UK) Limited which is authorised by the Prudential Regulation Authority
(PRA) and regulated by the Financial Conduct Authority (FCA) in the United Kingdom.
.
Risks
Risks to our investment thesis originate in costs of risk (COR) in 2015e and
2016e that might turn out to be higher than we forecast; falls in the value of the
naira that might exceed what we forecast; the outcome of February’s general
elections (which could be delayed) and possible threats to political stability
thereafter; oil prices that might fall lower than the US$50.00-60.00/bbl that we
benchmark; the threat from the terrorist group Boko Haram which could
increase instability in the North East of Nigeria, and elsewhere, with negative
consequences for politics, security and market conditions; a possible return of
the Ebola outbreak to Nigeria; the possible inability of some banks to raise
required capital – where required – in 2015;
The Nigerian banking system last underwent major stresses in 2009 with a
non-performing loan (NPL) crisis aggravated by a high level of margin lending
and related-party lending. Since then, COR of the banks has improved
gradually, following the CBN’s intervention that led to the purchase of bad
loans through AMCON. Although recent headwinds are less likely to lead the
banks back to 2009 COR levels, a higher than forecast COR could lead to
greater declines in Net Profits than those we forecast here, and possibly
losses, particularly in FY2015e. Losses incurred by the banks could potentially
erode equity, leading to lower capital adequacy ratios and consequently,
increased pressure to raise additional capital in future years.
All the banks featured in this report, are significantly exposed to US dollar
loans, and some of them have issued dollar denominated debt to augment
regulatory capital. Further naira devaluation below the N220/US$1 we have
forecast as a base could expose banks to significant additional risks.
In the run-up to February 2015’s elections, the contest seems to be solely
between President Goodluck Jonathan of the Peoples Democratic Party (PDP)
and retired Major-General Mohammadu Buhari of the All Progressive Congress
(APC). Competition between both the political candidates is likely to be stiffer
than in previous elections, given changes in the political landscape since
2011’s elections. Although President Goodluck has the advantage of
incumbency, the chances that Buhari could find himself democratically elected
president are rising (Buhari was military Head of State 1983-5, and lost
democratic presidential elections in 2003, 2007 and 2011). An outcome that
seems to favour Buhari creates a lot of uncertainties for banks as a result of
any political changes that might alter market and regulatory conditions.
Although previous elections have been conducted in a generally peaceful
manner, notably in 2011, there remains the risk of political violence around this
time.
Declining oil prices have put pressure on government revenues, and therefore
the budget. A further decline in oil prices would have significantly negative
effects on banks both directly (because government is a major customer) and
indirectly (as spending levels in the economy would fall). NPLs could worsen to
the point where banks’ COR exceed those modelled in this report.
Nigerian Banks
Page 21
Equities
CSL Stockbrokers is a division of FCMB (UK) Limited which is authorised by the Prudential Regulation Authority
(PRA) and regulated by the Financial Conduct Authority (FCA) in the United Kingdom.
.
The COR modelled in this report could be exceeded by the covered banks in
2015e and 2016e, even if our base case naira/US$ and oil price assumptions
are attained, due to risk management factors that are not ascertainable at the
time of writing.
There has been a sharp increase in the intensity and number of attacks by the
terrorist organisation Boko Haram group in the last month. Recent attacks by
Boko Haram appear to be concentrated in the northern part of Nigeria’s North
East, and generally contained within Yobe, Borno and Adamawa states. The
next line of states towards central Nigeria (in a south-westerly direction)
consists of Bauchi, Jigawa and Gombe. The pattern this year has been for very
violent attacks (such as the destruction of the town of Baga in Borno State) in
the far north rather than an expansion of the front line southwards. There is a
risk of this violence escalating in a run-up to the 2015 elections and afterwards,
and spreading outside northern Nigeria.
Some banks might find it difficult to raise required capital in 2015. For banks
that have communicated plans to raise tier-2 capital, the US dollar market for
the subordinated debt of Nigerian banks seems unattractive at the moment.
Even though Access Bank raised US$400m in 7-yr subordinated debt in June
2014 at a coupon of 9.25%, and FBN Holdings’ raised US$450m in 7-yr
subordinated debt in July 2014 at coupon of 8.00%, banks might find it difficult
if they came to the market now. The banks would have to contend with a
sovereign yield that has been trending upwards recently. The naira
subordinated debt market is an alternative which was accessed successfully in
Q4 2014, though not so far this year.
The outbreak of Ebola Virus Disease (EVD) in Nigeria has been contained, and
Nigeria has been declared Ebola-free by the World Health Organization.
However, a renewed outbreak cannot be ruled out.
Nigerian Banks
Page 22
Equities
CSL Stockbrokers is a division of FCMB (UK) Limited which is authorised by the Prudential Regulation Authority
(PRA) and regulated by the Financial Conduct Authority (FCA) in the United Kingdom.
.
Company sections
1) FBN Holdings
2) Zenith Bank
3) United Bank for Africa
4) Guaranty Trust Bank
5) Access Bank
6) Diamond Bank
7) Fidelity Bank
8) Stanbic IBTC
9) Sterling Bank
NB Skye Bank, which is usually covered by CSL Research, is not covered in
this report as we seek clarification of its purchase of Mainstreet Bank. We
placed our recommendation on Skye Bank under review on 10 October 2014.
Nigerian Banks
Page 23
Equities
CSL Stockbrokers is a division of FCMB (UK) Limited which is authorised by the Prudential Regulation Authority
(PRA) and regulated by the Financial Conduct Authority (FCA) in the United Kingdom.
.
FBN Holdings
Revision to estimates
 We revise down our forecasts for FBN Holdings (FBNH) in light of
recent policy changes by the Central Bank of Nigeria (CBN) and the
expected impact of a further devaluation of the naira and of weak oil
prices.
 We model FBNH’s overall cost of risk (COR) rising in 2015e from our
earlier-modelled 1.1% to 5.8%. We arrive at this increment by
modelling the effect of a loss (effectively without collateral and
therefore with 100% provision) of 11.7% of its US dollar loans.
 These changes result is a reduction in our PBT forecast by 2.8% in
2014e, 98.7% in 2015e and by 12.6% in 2016e. We revise our price
target down to N12.86/s from N14.70/s (current price N7.40), based on
an implied 0.80x P/BV multiple to our FY2015e BVPS estimate.
However, given recent price performance, we upgrade our
recommendation from Hold to Buy.
 In estimating FBNH’s COR for 2015e, we have assumed FBNH’s lending
in US dollars to customers remains at FY 2013’s level of 37.4% of gross
loans. We then assume that 11.7% of these loans become loss loans and
would require 100.0% provisions, assuming no collateral collection. We
estimate this would increase the bank’s COR to 5.8% from 1.1% modelled
previously.
FBNH, Nm
2014e Old 2014e New change 2015e Old 2015e New change 2016e Old 2016e New change
Netinterestincome 242,316 228,469 -6% 276,142 261,327 -5% 315,562 279,031 -12%
NetFee and Commission Income 60,822 55,342 -9% 65,994 57,956 -12% 50,343 50,840 1%
Otherincome 14,880 29,989 102% 17,112 32,987 93% 19,679 36,286 84%
Impairmentcharge (21,534) (21,827) 1% (23,723) (134,925) 469% (25,659) (25,997) 1%
Costofrisk(COR) 1.1% 1.1% 0bps 1.1% 5.8% 470bps 1.0% 1.0% -1bps
Operating expenses (201,657) (199,806) -1% (219,806) (215,791) -2% (237,390) (233,054) -2%
PBT 94,826 92,164 -3% 115,718 1,554 -99% 122,534 107,106 -13%
Tax (19,914) (19,354) -3% (24,301) (326) -99% (25,732) (22,492) -13%
NetProfits 74,913 72,809 -3% 91,417 1,228 -99% 96,802 84,614 -13%
Source: CSL estimates
 We revise down our Net Interest Income forecasts by 6% in 2014e, 5% in
2015e and by 12% in 2016e to reflect the impact of the increase in the
cash reserve requirement (CRR) on private sector deposits in November
2014 to 20% from 15%.
Recommendation: Buy
Target: N12.86 Price: N7.40
price as at 28 Jan 2015
Year to December, Nbn
2013 2014e 2015e 2016e
Net Interest
Income 230.1 228.5 261.3 279.0
Net profits 70.6 72.8 1.2 84.8
EPS, N 2.15 2.22 0.04 2.58
P/BV 0.5 0.5 0.5 0.4
PE 3.4 3.3 185.0 2.9
Div Yield (%) 14.9 7.2 0.0 13.9
Mkt. cap. N241.5bn (US$1.3bn)
Free float 98.4%
Bloomberg FBNH NL
Reuters FBNH.LG
Three-year graph
5
10
15
20
25
Jan-12 Jan-13 Jan-14 Jan-15
First Bank First Bank rel. to Nigeria All-Share
Contact information
Lagos: +234 (0)1 448 5436
Analyst: Gloria Obayagbo
+234 (0)1 448 5436
Head of Research: Guy Czartoryski
Sales: Temi Popoola, CFA
+234 (0) 1 448 5420 ext. 4507
London: +44 (0) 20 7220 1041
Nigerian Banks
Page 24
Equities
CSL Stockbrokers is a division of FCMB (UK) Limited which is authorised by the Prudential Regulation Authority
(PRA) and regulated by the Financial Conduct Authority (FCA) in the United Kingdom.
.
 Though FBNH has made efforts to compensate for the CBN’s reduction in
commission on turnover (COT) by increasing other fees and commission,
Net Fees and Commission Income declined steeply in Q3 2014. which
prompts us to reduce our forecasts of Net Fees and Commission by 9%
for 2014e and by 12% for 2015e.
 The bank has been working on initiatives to grow Non-Interest Income and
has been quite successful, in our view. Other Income increased 97% over
FY 2013 in 9M 2014. Consequently, we have upgraded our forecasts of
Other Income over the forecast period.
 The bank increased the pace of its loan growth in Q3 and has surpassed
our FY loan growth forecast in 9M 2014, during which Net Loans were up
16%. Considering this, we have increased our loan growth estimate in
2014e to 18% from 15%. Considering capital concerns however, we revise
down our loan growth forecasts to 10% for 2014e and 2015e, from 15%
for both years.
 According to management, the total capital adequacy ratio (CAR) of the
bank post Basel II and after the US$450.0m in tier-2 capital raised, comes
to about 16.2%. Though close to the regulatory minimum of 16.0% for
systemically important banks (SIBs), of which FBNH is one, management
maintains that there are no plans to raise capital in the short term. It plans
to increase capital internally through profit retention and balance sheet
restructuring e.g. sale or non-renewal of large institutional and corporate
loans.
 Considering this, we have reduced further our dividend pay-out forecast
for FBNH to 24.0% from 48.0% in 2014e. Considering the fact that we
forecast a significantly high Impairment Charge in 2015e which would
remove almost all of the bank’s Net Profits, we do not expect any dividend
payment in 2015e.
 We revise down our price target to N12.86/s from N14.70/s previously.
However, given recent price performance, we upgrade our
recommendation from Hold to Buy. We arrive at our revised price target by
applying an implied 0.8x P/BV multiple to our FY 2015e BVPS estimate of
N15.50. Key inputs are a 20.0% cost of equity (COE) (which is based on a
13.0% risk-free rate and a 7.0% equity risk premium), 8.0% long term
growth rate, and 18.0% long term sustainable RoAE.
Nigerian Banks
Page 25
Equities
CSL Stockbrokers is a division of FCMB (UK) Limited which is authorised by the Prudential Regulation Authority
(PRA) and regulated by the Financial Conduct Authority (FCA) in the United Kingdom.
.
FBNH Financials and ratios, Nm
Income statement Nm 2010 2011 2012 2013 2014E 2015E 2016E Profitability ratios 2010 2011 2012 2013 2014E 2015E 2016E
Totalinterestincome 175,579 212,975 295,353 323,621 329,630 373,886 407,541 Netinterestmargin 7.3% 8.8% 8.6% 8.0% 7.2% 8.0% 8.1%
Interestexpense (53,912) (36,784) (68,746) (93,506) (101,162) (112,559) (128,509) Cost/incomeratio 76.2% 79.6% 67.2% 67.2% 68.4% 99.3% 68.5%
Netinterestincome 121,667 176,191 226,607 230,115 228,469 261,327 279,031 Cost/incomeratioexprov. 67.0% 66.0% 64.6% 62.6% 63.7% 61.3% 63.6%
Otherincome 11,406 -2,330 14,019 11,446 29,989 32,987 36,286 Pre-taxmargin 14.5% 12.6% 25.5% 22.8% 21.9% 0.3% 21.4%
Profitbeforeprov. 178,062 221,445 300,575 295,646 313,799 352,270 366,157 RoAA 1.3% 0.7% 2.5% 2.0% 1.9% 0.0% 1.9%
Provisions (21,590) (38,011) (12,549) (20,309) (21,827) (134,925) (25,733) RoAE 9.6% 5.0% 19.1% 15.5% 14.8% 0.2% 15.2%
Totalopex (119,274) (146,064) (193,513) (185,006) (199,806) (215,791) (233,054)
Cost/incomeratio 76.2% 79.6% 67.2% 67.2% 68.4% 99.3% 68.5% Asset quality ratios 2010 2011 2012 2013 2014E 2015E 2016E
Cost/incomeratioexprov. 67% 66% 65% 63% 64% 61% 64% NPL/Totalloans 7.7% 2.6% 2.6% 3.0% 3.5% 5.0% 4.0%
PBTbeforeexceptionalitems 33,541 37,370 94,513 90,332 92,164 1,554 107,370 Prov./Totalgrossloans 6.6% 2.6% 2.5% 2.5% 3.1% 8.1% 8.3%
PBT 33,767 35,863 93,921 91,338 92,164 1,554 107,370
Taxation (4,590) (17,227) (17,031) (20,706) (19,354) (326) (22,548) Capitalratios 2010 2011 2012 2013 2014E 2014E 2016E
Effectivetaxrate -13.6% -48.0% -18.1% 22.7% -21.0% -21.0% -21.0% Capitaladequacyratio 20.4% 22.2% 22.0% 22.0% 20.3% 21.5% 23.1%
Minorityinterest(MI) 1,933 -884 -220 496 511 9 596 Leverage 6.8x 7.8x 7.4x 8.3x 8.1x 9.1x 8.7x
PAT 29,177 18,636 76,890 70,632 72,809 1,228 84,822
EPS 0.95 0.54 2.37 2.15 2.22 0.04 2.58 Liquidity ratios 2010 2011 2012 2013 2014E 2014E 2016E
DPS 0.60 0.80 1.00 1.10 0.53 0.00 1.03 Loan/Deposit 83.8% 65.9% 64.4% 60.4% 67.9% 70.6% 67.7%
Payoutratio 0.63 1.47 0.42 0.51 0.24 0.00 0.40
Dividendsum 19,579 26,106 32,632 35,895 17,352 0 33,691 Growth - y/y 2010 2011 2012 2013 2014E 2014E 2016E
Netinterestincome -5.1% 44.8% 28.6% 1.5% -0.7% 14.4% 6.8%
Balance sheet (N millions) 2010 2011 2012 2013 2014E 2015E 2016E Otherincome 124.8% -120.4% -701.7% -18.4% 162.0% 10.0% 10.0%
cashandshorttermfunds 75,517 199,228 300,532 594,234 604,918 766,569 1,071,230 Profitbeforeprov. 4.3% 24.4% 35.7% -1.6% 6.1% 12.3% 3.9%
Duefrombanks&otherfin.inst. 550,414 462,856 439,853 430,586 515,763 567,339 624,073 Totalassets -7.1% 24.1% 12.9% 19.9% 6.0% 11.6% 14.2%
Financialassetsheldfortrading 0 5,964 6,112 10,287 12,139 13,353 14,688 Dividendsum 406.3% 33.3% 25.0% 10.0% -51.7% -100.0% #DIV/0!
Investmentsecurities 337,181 694,269 718,040 824,063 687,181 721,540 757,617 Loans&advances 4.6% 11.0% 23.1% 14.8% 18.0% 10.0% 10.0%
Assetspledgedascollateral 0 72,129 50,109 53,650 72,964 80,260 88,286 NonPerformingLoans -1.5% -63.7% 23.2% 31.0% 38.9% 65.6% -11.8%
Loans&advances 1,127,900 1,252,462 1,541,377 1,769,130 2,087,573 2,296,331 2,525,964 Totaldeposits 8.3% 34.6% 22.7% 22.3% 5.0% 15.0% 15.0%
Advancesunderfinancelease 7,581 0 0 0 0 0 0 Totalliabilities 5.5% 26.8% 11.9% 22.0% 5.6% 13.4% 13.5%
Otherassets 63,558 62,272 40,252 41,405 75,375 82,912 91,204 Shareholders'Funds 9.2% 8.7% 19.4% 6.5% 8.7% -0.7% 19.6%
Propertyandequipment 53,998 65,874 75,407 81,299 86,177 89,050 92,018
Totalassets 2,304,686 2,860,119 3,228,384 3,871,001 4,102,319 4,579,109 5,228,706
Totaldeposits 1,450,095 1,951,321 2,395,148 2,929,081 3,075,535 3,536,865 4,067,395
otherliabilities 121,026 158,771 122,202 149,859 224,174 235,383 247,152
Totalliabilities 1,965,481 2,491,589 2,787,069 3,399,224 3,589,637 4,069,301 4,619,449
Shareholders'Funds 338,057 367,616 438,767 467,272 507,727 504,357 603,261
NonPerformingLoans 92,576 33,628 41,444 54,291 75,406 124,906 110,140
BVPS 10.4 11.3 13.4 14.3 15.6 15.5 18.5
Source: Company, CSL estimates
Nigerian Banks
Page 26
Equities
CSL Stockbrokers is a division of FCMB (UK) Limited which is authorised by the Prudential Regulation Authority
(PRA) and regulated by the Financial Conduct Authority (FCA) in the United Kingdom.
.
Zenith Bank
Revision to estimates
 We revise down our estimates for Zenith Bank based on recent
changes in policies by the Central Bank of Nigeria (CBN) and on the
expected impact of naira devaluation and weak oil prices on 2015e
earnings.
 We model Zenith Bank’s overall cost of risk (COR) rising in 2015e from
our earlier-modelled 0.8% to 3.2%. We arrive at this increment by
modelling the effect of a loss (effectively without collateral and
therefore with 100% provisions) of 9.6% of its US dollar loans. By
contrast, if 10.0% of its US dollar loans were to require 100%
provisions in 2015e, then we would model an overall COR of 3.3%.
 The overall effect of these changes is a reduction in our PBT forecasts
by 7% in 2014e, 33% in 2015e, and by 8% in 2016e. We retain our Buy
recommendation on Zenith Bank with a reduced price target of N24.6/s
from N31.50/s (current price N17.02/s), based on an implied 1.3x P/BV
multiple applied to our FY2015e BVPS estimate.
 Zenith Bank’s customer lending in US dollars made up 23.2% of gross
loans in 2013. In estimating the COR for 2015e, we have assumed the
percentage of US dollar loans remains stable and that 9.6% of these loans
become loss loans and, without collateral collection, would require 100.0%
provisions. We estimate this would increase the bank’s COR to 3.2% from
0.8% modelled previously. We believe that Zenith Bank’s risk
management capabilities are superior to those of most other Nigerian
banks, and therefore our 9.6% US dollar loan default assumption reflects a
relative degree of confidence on our part.
Zenith Bank, Nm
2014e Old 2014e New change 2015e Old 2015e New change 2016e Old 2016e New change
NetinterestIncome 200,877 190,090 -5% 228,225 221,031 -3% 253,982 243,483 -4%
NetFee and Commission Income 55,482 46,612 -16% 47,479 45,722 -4% 39,010 31,993 -18%
Other income 24,818 31,190 26% 26,599 33,472 26% 27,875 35,108 26%
Impairmentcharge (11,594) (9,854) -15% (13,492) (55,809) 314% (15,516) (18,300) 18%
Costofrisk (COR) 0.8% 0.7% -10bps 0.8% 2.0% 120bps 0.8% 0.9% 10bps
Operating expenses (154,556) (151,612) -2% (165,375) (162,225) -2% (176,951) (173,580) -2%
PBT 115,027 106,426 -7% 123,436 82,192 -33% 128,400 118,703 -8%
Tax (19,555) (18,092) -7% (20,984) (13,973) -33% (21,828) (20,180) -8%
NetProfits 95,473 88,333 -7% 102,452 68,219 -33% 106,572 98,524 -8%
Source: CSL estimates
 The CBN at its November 2014 Monetary Policy Committee (MPC)
meeting increased the Cash Reserve Requirement (CRR) on private
sector deposits from 15.0% to 20.0%. We expect this to strain the bank’s
Interest Income in the last quarter of 2014, and subsequently.
Consequently, we have reduced our Interest Income forecasts for 2014e
Recommendation: Buy
Target: N24.60 Price: N17.02
price as at 28 Jan
Year to December, Nbn
2013 2014e 2015e 2016e
Net Interest
Income 189.3 190.1 221.0 243.5
Net profits 95.3 88.3 68.2 98.5
EPS, N 3.01 2.80 2.16 3.12
P/BV 1.1 1.0 0.9 0.8
PE 5.7 6.1 7.9 5.5
Div Yield (%) 10.3 7.1 5.5 8.4
Mkt. cap. N534.4bn (US$2.8bn)
Free float 84%
Bloomberg ZENITHBA NL
Reuters ZENITHB.LG
Three-year graph
10
15
20
25
30
Jan-12 Jan-13 Jan-14 Jan-15
Zenith Bnk share price Zenith Bnk rel. to Nigeria All-Share
Contact information
Lagos: +234 (0)1 448 5436
Analyst: Gloria Obayagbo
+234 (0)1 448 5436
Head of Research: Guy Czartoryski
Sales: Temi Popoola, CFA
+234 (0)1 448 5420 ext. 4507
London: +44 (0) 20 7220 1041
Nigerian Banks
Page 27
Equities
CSL Stockbrokers is a division of FCMB (UK) Limited which is authorised by the Prudential Regulation Authority
(PRA) and regulated by the Financial Conduct Authority (FCA) in the United Kingdom.
.
by 6%, and for 2015e and 2016e by 4% in each year, and we have
reduced our forecast Net Interest Income by 5% in 2014e, 3% in 2015e,
and 4% in 2016e.
 We have revised down our deposit growth forecast for 2014e to 5.0% from
10.0% due to the bank’s lacklustre deposit growth in 9M 2014 during
which deposits were up only 1.4% on the year.
 The bank’s Fee and Commission Income was declining quarterly through
9M 2014. We believe Zenith Bank is gradually beginning to feel the impact
of the declining permitted commission on turnover COT (now 2 per mille).
The bank previously did not suffer much from the reduction in COT to 3
per mille from 5 per mille in 2013, due to its high percentage of corporate
clients which already had COT concessions at about 3 per mille. Based on
this, we have revised down our Net Fees and Commissions Income
estimate by 16% in 2014e, 4% in 2015e and by 18% in 2016e when COT,
according to CBN regulations, will no longer be charged.
 FX trading income helped increase Zenith Bank’s Other Income in 9M
2014. Though the CBN, in a circular released towards the end of 2014,
reviewed downwards the daily foreign exchange trading position of
individual authorised dealers to zero percent of shareholders’ funds from
one percent previously, and only recently increased it slightly to 0.1%, we
do not expect any significant impact on banks’ 2014e earnings considering
the timing of the circular. The impact on 2015e earnings may be worse,
depending on the CBN’s future measures, but we are of the view that the
measure will be reviewed shortly. Consequently, we have increased our
forecasts for Other Income by 26% through our forecast years.
 We have also reviewed downwards our dividend pay-out expectations,
considering the need for all banks to retain more capital than before in the
light of the CBN’s capital requirements. Consequently, we have reduced
our dividend pay-out ratio forecasts to 43% in 2014e, and 2015e, and 46%
in 2016e from 59%, 57% and 58%, respectively.
 The overall effect of these and other minor changes to our estimates is a
reduction in our PBT forecasts by 7% for 2014e, 33% for 2015e and by
8% for 2016e. We maintain our Buy rating on Zenith Bank with a revised
price target of N24.6/s. Our price target is derived by applying an implied
1.3x P/BV multiple to our FY2015e BVPS estimates of N18.5. Key inputs
to our model are a 24.0% long-term sustainable ROE, a 19.9% COE and
an 8.0% long term growth rate.
Nigerian Banks
Page 28
Equities
CSL Stockbrokers is a division of FCMB (UK) Limited which is authorised by the Prudential Regulation Authority
(PRA) and regulated by the Financial Conduct Authority (FCA) in the United Kingdom.
.
Zenith Bank Financials and ratios Nm
Income statement Nm 2011 2012 2013 2014E 2015E 2016E Profitability ratios 2011 2012 2013 2014E 2015E 2016E
Interestincome 163,192 221,318 260,059 281,877 322,211 354,833 Netinterestmargin 7.8% 8.2% 8.5% 7.4% 7.7% 7.7%
Interestexpense (34,906) (64,561) (70,796) (91,787) (101,180) (111,351) Cost/incomeratio 65% 54.0% 57% 59% 66% 59%
Netinterestincome 128,286 156,757 189,263 190,090 221,031 243,483 Cost/incomeratioexprov. 59% 52% 56% 57% 54% 56%
Otherbankingincome 67,259 70,553 75,209 77,801 79,195 67,101 Pre-taxmargin 25.9% 33.6% 31.5% 29.6% 20.5% 28.1%
Profitbeforeprovisions 195,545 227,310 264,472 267,892 300,225 310,584 RoAA 2.3% 4.1% 3.3% 2.7% 1.9% 2.5%
Loanloss &otherprovision (16,514) (9,099) (11,067) (9,854) (55,809) (18,300) RoAE(adj.) 12.9% 23.4% 19.6% 16.9% 12.1% 15.9%
Operatingexpenses (115,918) (118,560) (147,196) (151,612) (162,225) (173,580) cost-toasset -5.5% -4.8% -5.1% -4.6% -4.5% -4.4%
Cost/incomeratio 64.7% 53.5% 57.1% 58.8% 66.4% 59.4%
Cost/incomeratioexprov. 59.3% 52.2% 55.7% 56.6% 54.0% 55.9% Asset quality ratios 2011 2012 2013 2014E 2015E 2016E
PBTfrom continued&discope 63,113 103,159 110,597 106,426 82,192 118,703 NPL/Totalloans 4.1% 3.1% 2.9% 3.5% 3.5% 3.5%
Taxation (17,261) (1,419) (15,279) (18,092) (13,973) (20,180) Provisions/Totalgross loans 2.9% 2.4% 1.9% 2.2% 4.8% 5.0%
Effectivetaxrate -27% 1% 14% 17% 17% 17%
PAT 48,704 101,740 95,318 88,333 68,219 98,524
MinorityInterest (281) (534) 742 (534) (534) (534) Capital ratios 2011 2012 2013 2014E 2015E 2016E
EPS(reported) 1.54 3.22 3.01 2.80 2.16 3.12 Leverage 5.9x 5.7x 6.2x 6.4x 6.5x 6.4x
DPS 0.95 1.60 1.75 1.20 0.92 1.43
Payoutratio 62% 50% 58% 43% 43% 46%
Dividendsum 29,827 49,399 54,854 37,542 28,993 44,828 Liquidity ratios 2011 2012 2013 2014E 2015E 2016E
WeightedAve.ShareCount 31,396 31,396 31,396 31,396 31,396 31,396 Loans/Deposit 54% 51% 55% 65% 68% 70%
Balance Nm 2011 2012 2013 2014E 2015E 2016E
Cash&balances withtheCBN 223,187 332,515 603,851 657,775 693,436 804,413
Otherassets 25,510 28,665 36,238 63,417 66,587 69,917 Growth - y/y 2011 2012 2013 2014E 2015E 2016E
Deferredtaxassets 186 432 749 936 1,077 1,238 Netinterestincome 40% 22% 21% 0% 16% 10%
Investmentsecurities 308,231 299,343 303,125 341,016 366,592 384,921 Otherbankingincome 11% 5% 7% 3% 2% -15%
Fixedassets (PP&E) 68,366 68,782 69,410 75,194 78,954 82,902 Profitbeforeprovisions 29% 16% 16% 1% 12% 3%
Totalassets 2,326,695 2,604,504 3,143,133 3,468,625 3,773,576 4,204,850 Operatingexpenses 19% 2% 24% 3% 7% 7%
Customerdeposits 1,655,458 1,929,244 2,276,755 2,390,593 2,629,652 2,945,210 PBTafterex.Items 26% 63% 7% -4% -23% 44%
Otherliabilities 152,836 117,355 215,643 226,425 249,068 278,956 PAT 30% 109% -6% -7% -23% 44%
Taxation 13,348 6,577 7,017 7,134 7,372 7,667 EPS(adjusted) 30% 109% -5% -9% -23% 45%
Deferredtaxation 10,742 5,584 678 689 712 741 Dividendsum 12% 66% 11% -32% -23% 55%
Longterm liabilities/borrowings 21,070 15,138 60,150 205,953 205,953 205,953 Loans &advances 23% 11% 26% 25% 15% 15%
Totalliabilities 1,932,427 2,141,548 2,633,882 2,922,970 3,189,542 3,541,118 NonPerformingLoans (NPL) -15% -15% 16% 51% 18% 15%
Shareholders'Funds 391,582 459,684 505,236 542,383 580,761 660,458 Customerdeposits 26% 17% 18% 5% 10% 12%
MinorityInterest 2,686 3,272 4,015 3,272 3,273 3,274 Totalassets 23% 12% 21% 10% 9% 11%
NonPerformingLoans (NPL) 37,730 31,930 37,135 55,959 66,124 76,208 Totalliabilities 26% 11% 23% 11% 9% 11%
BVPS 12.5 14.6 16.1 17.3 18.5 21.0 Shareholders'Funds 8% 17% 10% 7% 7% 14%
Source: Company, CSL estimates
Nigerian Banks
Page 29
Equities
CSL Stockbrokers is a division of FCMB (UK) Limited which is authorised by the Prudential Regulation Authority
(PRA) and regulated by the Financial Conduct Authority (FCA) in the United Kingdom.
.
United Bank for Africa
Revision to estimates
 The effects of currency devaluation and falling oil prices prompt us to
revise our forecasts for United Bank for Africa (UBA).
 We model UBA’s overall cost of risk (COR) rising in 2015e from our
earlier-modelled 1.5% to 5.2%. We arrive at this increment by modelling
the effect of a loss (effectively without collateral and therefore with 100%
provision) of 13.0% of its US dollar loans.
 The overall effect of these changes is a reduction in our PBT forecast by
10% in 2014e, 70% in 2015e, and 9% in 2016e. Also, we expect 8% dilution
to 2015e EPS as a result of the one-for-ten rights issue which is underway.
We change our recommendation from Hold to Buy, though we reduce our
target price to N5.70/s from N7.40x/s (current price N3.53/s), based on a
0.72x implied P/BV multiple to our FY2015e BVPS estimate.
 UBA’s US dollar lending as at FY 2013 made up 29.0% of its loan book. In
estimating COR for 2015e, we have assumed the percentage of US dollar loans
remains stable in 2015e and that 10.0% of these loans become loss loans and,
without collateral collection, would require 100% provision.
 In terms of impact on earnings, at this stage, we find that the projected increase
in cost of risk (COR) in 2015e can be absorbed by earnings. The increase in
COR results in a 70% reduction in our forecast of UBA’s 2015e PBT.
United Bank for Africa, Nm
2014e Old 2014e New change 2015e Old2015e New change 2016e Old 2016e New change
Net interest income 125,195 112,296 -10% 143,443 132,095 -8% 166,914 146,734 -12%
Net Fee and Commission Income 41,152 48,239 17% 41,688 46,227 11% 41,748 51,376 23%
Other income 71,142 73,982 4% 73,896 73,550 0% 76,349 80,388 5%
Impairment Charge (16,268) (9,952) -39% (18,572) (56,429) 204% (22,109) (21,066) -5%
Cost of risk (COR) 1.5% 1.5% 0bps 1.5% 5.2% 370bps 1.5% 1.7% 20bps
Operating expenses (120,793) (123,064) 2% (134,080) (129,653) -3% (147,488) (139,121) -6%
PBT 59,276 53,261 -10% 64,687 19,564 -70% 73,664 66,935 -9%
Tax (10,077) (10,652) 6% (10,997) (3,913) -64% (12,523) (13,387) 7%
Net profits 49,199 42,609 -13% 53,690 15,651 -71% 61,142 53,548 -12%
Source: CSL estimates
 As at 9M 2014 UBA’s Loans and Advances were up 5.7% which was much
slower than the aggressive 42.3% loan growth seen in FY 2013. This, we
believe, was a deliberate effort to restrict risk asset growth due to capital
constraints. Consequently, we have revised down our 2014e loan growth
forecast to 10.0% from 20.0%, and to 10.0% from 18.0% in 2015e.
Recommendation: Buy
Target: N5.70 Price: N3.53
price as at 28 Jan
Year to December, Nbn
2013 2014e 2015e 2016e
Net Interest
Income 103.2 112.3 132.1 146.7
Operating Income 177.0 186.3 205.6 227.1
Net profits 46.6 42.6 15.7 53.5
EPS, N 1.41 1.29 0.44 1.48
P/BV (x) 0.50 0.44 0.44 0.40
PE (x) 2.5 2.7 8.0 2.4
Div Yield (%) 14.2 11.3 4.0 17.0
Mkt. cap. N116.4bn (US$629.3m)
Free float 83%
Bloomberg UBA NL
Reuters UBA.LG
Three-year graph
0
3
6
9
12
Jul-11 Jul-12 Jul-13 Jul-14
UBA share price UBA rel. to Nigeria All-Share
Contact information
Lagos: +234 (0)1 448 5436
Analyst: Sade Obilomo
+234 (0)1 448 5436
Head of Research: Guy Czartoryski
Sales: Temi Popoola, CFA
+234 (0) 1 448 5420 ext.4507
London: +44 (0) 20 7220 1041
Nigerian Banks
Page 30
Equities
CSL Stockbrokers is a division of FCMB (UK) Limited which is authorised by the Prudential Regulation Authority
(PRA) and regulated by the Financial Conduct Authority (FCA) in the United Kingdom.
.
 We have also revised down our FY 2014e deposit growth forecast to 1.0%
from 15.0% previously. As at 9M 2014, UBA’s customer deposits were down
3.0% relative to FY 2013. This, according to management, was as a result of
a strategic effort to improve the deposit mix and ease funding costs.
 At the last Monetary Policy Committee (MPC) meeting, the Central Bank of
Nigeria (CBN) raised the cash reserve requirement (CRR) on private sector
deposits to 20% from 15%. With continued competitive pressure in the
banking sector, we expect to see an increase in funding costs leading to
some margin compression. Hence, we have modelled a slight increase in
UBA’s cost of funds (COF) to 3.8% from 3.6% in 2014e, and to 3.7% from
3.5% in 2015e.
 We believe UBA, like most other Nigerian banks, will prioritise retaining
earnings to conserve capital given expectations of further tightening in the
sector. As a result, we have reduced our forecast of UBA’s dividend pay-out
ratio to 31% from 34% in 2014e, and to 34% from 40% in 2015e.
 The overall effect of these changes to our forecasts is to decrease our PBT
forecasts by 70% in 2015e, and 9% in 2016e. The decline in PBT and
increase in book value from the rights issue leads us to model a RoAE of
5.7% in 2015e, relative to our previous forecast of 19.3%.
 In terms of dilution from the rights issue, we estimate 8% dilution to 2015e
earnings per share (EPS) assuming a weighted average number of shares in
issue of 35.5bn up from 32.9bn in 2014.
 We upgrade our recommendation on UBA from Hold to Buy, but revise our
target price downwards to N5.70/s. We arrive at our target price by applying
an implied 0.72x P/BV multiple to our 2015 BVPS estimates of N8.0. Key
inputs to our valuation include 18.0% sustainable RoAE, an 8.0% long term
growth rate and a 22.0% COE based on a risk free rate of 13.0% equal to
the recent yield on the Federal Government’s 10-year bond, a beta of 1.28
and an equity risk premium of 7.0%.
Nigerian Banks
Page 31
Equities
CSL Stockbrokers is a division of FCMB (UK) Limited which is authorised by the Prudential Regulation Authority
(PRA) and regulated by the Financial Conduct Authority (FCA) in the United Kingdom.
.
Capital Adequacy
While UBA's total capital adequacy ratio was at a comfortable level of 21% as at
H1 2014, a significant portion of its capital is funded through subordinated debt,
which puts the bank’s Tier II capital above the new CBN’s regulatory limits,
according to the most recent CBN circular which limits the level of Tier II capital
to 33% of Tier I, or 25% of total equity.
In response to this regulation, the bank has commenced a rights issue of one
for ten shares at N4.0/s. We expect this issue to add an additional N13.2billion
($67.7m) in equity capital if all the new shares are subscribed at N4.0/s. This,
according to our CAR model, and after reducing our forecast dividend pay-out in
2014e to 32%, puts UBA’s Tier I and Tier II ratio just at the regulatory minimum.
Total Capital Adequacy Ratio (CAR) model (post rights issue)
2009 2010 2011 2012 2013 2014e 2015e 2016e 2017e 2018e
Tier 1 capital
Ordinary share capital 10,778 12,934 16,168 16,491 16,491 16,491 18,140 18,140 18,140 18,140
Share premium 113,645 111,489 108,255 107,932 107,932 107,932 119,475 119,475 119,475 119,475
Retained earnings 18,317 16,504 16,034 49,572 70,480 93,505 101,845 125,593 163,366 203,568
Translation reserve 1,607 (1,514) (3,153)
Other reserves 25,491 25,816 5,281 16,625 35,878 39,137 41,485 49,517 60,665 72,881
Non-controlling interests 3,595 3,361 7,387 7,387 7,387 7,387 7,387 7,387
Subtractions (1) (3,479) (13,597) (25,411) (18,584) (31,839) (31,839) (31,839) (31,839) (31,839) (31,839)
Total qualifying Tier 1 capital 164,752 153,146 125,529 173,883 203,176 232,613 256,493 288,273 337,194 389,612
Tier 2 capital
Fair value reserve for AFS and FA 11,231 11,231 11,460 15,223 24,452 24,452 24,452 24,452 24,452 24,452
Debenture stock 18,851 53,500 53,719 55,653 54,045 54,045 54,045 54,045 54,045
Collective allowances for impairment 11,322 10,358 14,750 0
Non-controlling interests 2,967 2,897 3,595 3,361 7,387 7,387 7,387 7,387 7,387 7,387
Other reserves 4,400 -1,445
Total Tier 2 Capital 18,598 31,534 79,877 82,661 102,242 85,884 85,884 85,884 85,884 85,884
% Tier 2/Tier 1 capital** 11% 21% 64% 48% 50% 37% 33% 30% 25% 22%
Total regulatory capital 183,350 184,680 205,406 256,544 305,418 318,497 342,377 374,157 423,078 475,496
Total risk-weighted assets 1,071,694 1,071,694 945,279 1,091,824 1,352,161 1,617,985 1,736,609 1,951,406 2,162,839 2,403,442
Capital Adequacy Ratio 17.1% 17.2% 21.7% 23.5% 22.6% 19.7% 19.7% 19.2% 19.6% 19.8%
Operational risk estimate using BIA 114,522 98,074 85,635 80,631 90,296 108,851 118,524 128,968 142,123 155,298
Basel II Capital Adequacy Ratio 15.5% 15.8% 19.9% 21.9% 21.2% 18.4% 18.5% 18.0% 18.4% 18.6%
Source: Company, CSL Research. *Under Basel II implementation Collective Impairment
Provisions may not be used as part of tier-2 equity. **Under Basel II implementation, tier-2 equity
may not exceed either 33% or 25% (according to interpretation) of tier-1. (1) Investment in
subsidiaries, deferred tax and intangible assets. (2) Principal amounts approved by the CBN
Nigerian Banks
Page 32
Equities
CSL Stockbrokers is a division of FCMB (UK) Limited which is authorised by the Prudential Regulation Authority
(PRA) and regulated by the Financial Conduct Authority (FCA) in the United Kingdom.
.
United Bank for Africa’s financials and ratios, Nm
Income statement 2011 2012 2013 2014E 2015E 2016E Profitability ratios 2011 2012 2013 2014E 2015E 2016E
Interestincome 113,590 150,003 185,700 202,348 224,702 247,492 Netinterestmargin 4.7% 5.9% 5.8% 5.8% 6.2% 6.2%
Interestexpense (45,423) (58,386) (82,469) (90,052) (92,606) (100,758) Cost/incomeratioUBA 96.0% 66.8% 65.8% 69.8% 86.9% 67.5%
Netinterestincome 68,167 91,617 103,231 112,296 132,095 146,734 Cost/incomeratioex prov. 82.7% 64.8% 60.9% 63.0% 61.3% 59.9%
Netimpairmentloss onloans &rec. (17,738) (4,560) (13,078) (9,952) (56,429) (21,066) Pre-tax margin(preexceptionals) -5.5% 23.9% 21.2% 18.9% 6.4% 19.9%
Netinterestincomeafter impairment 50,429 87,057 90,153 102,344 75,666 125,668 RoAA -0.5% 2.6% 1.9% 1.6% 0.5% 1.7%
Other bankingincome 48,937 67,599 73,762 73,982 73,550 80,388 RoAE -5.3% 32.2% 22.3% 17.1% 5.7% 17.6%
Operatingexpenses (106,104) (102,592) (107,851) (123,064) (129,653) (139,121) Cost-to-assets 6.0% 4.9% 4.4% 4.6% 4.5% 4.5%
Cost/incomeratio 106.8% 66.3% 65.8% 69.8% 86.9% 67.5%
Cost/incomeratioex prov. 90.6% 64.4% 60.9% 66.1% 63.0% 61.3%
PBTpreexceptionals (26,600) 52,010 56,058 53,261 19,564 66,935 Asset quality ratios 2011 2012 2013 2014E 2015E 2016E
PBTpostexceptionals (26,600) 52,010 56,058 53,261 19,564 66,935 NPL/Totalloans 2.7% 2.0% 1.2% 2.0% 2.5% 2.5%
EffectiveTax rate 67% -1% -17% -20% -20% -20%
PAT (6,801) 54,766 46,601 42,609 15,651 53,548 Capital ratios 2011 2012 2013 2014E 2015E 2016E
Minority interest 850 224 257 244 90 307 Leverageratio 12.7x 11.8x 11.2x 10.4x 10.3x 10.2x
EPS(reported) -0.23 1.66 1.41 1.29 0.44 1.48
DPS 0.00 0.50 0.50 0.40 0.14 0.60 Liquidity ratios 2011 2012 2013 2014E 2015E 2016E
Payoutratio 0% 30% 35% 31% 32% 41% Loans/Deposit 44% 39% 44% 47% 46% 49%
Dividendsum 0 16,491 16,491 13,193 4,964 21,768
WeightedAve.ShareCount 32,335 32,981 32,981 32,981 35,455 36,280 Growth - y/y 2011 2012 2013 2014E 2015E 2016E
NIIpreprovisions -4% 34% 13% 9% 18% 11%
Other income -3% -74% 187% -24% 467% -63%
Balance sheet 2011 2012 2013 2014E 2015E 2016E Profitbeforetax -18% 38% 9% 0% -1% 9%
Cashandbankbalances 434,218 714,115 716,803 745,000 780,000 810,000 Operatingexpenses 2% -3% 5% 14% 5% 7%
Shorttermfunds(Treasury bills) 69,390 179,815 PBTpreexceptionals -426% -296% 8% -5% -63% 242%
Loans andadvances tobanks 41,564 28,513 26,251 21,251 27,251 32,251 PBTpostexceptionals -926% -296% 8% -5% -63% 242%
Investmentsecurities 722,308 611,427 631,391 823,206 873,206 923,206 PATbeforemin.Interest -1549% -694% -9% -9% -63% 242%
Loans andadvances tocustomers 605,627 658,922 937,620 1,012,109 1,113,185 1,315,136 Profit/loss for theyear -1118% -905% -15% -9% -63% 242%
Other assets 61,100 119,810 75,007 82,007 93,961 100,801 EPS(adjusted) -991% -822% -15% -9% -66% 234%
Property andequipment 55,618 70,746 75,409 77,368 78,827 80,736 DPS -100% 0% 0% -20% -65% 329%
Totalassets 1,920,435 2,272,923 2,642,296 2,760,941 2,966,431 3,262,130 Loans &advances -4% 9% 42% 8% 10% 18%
Deposits fromcustomers 1,445,822 1,720,008 2,161,182 2,182,794 2,466,557 2,713,213 NonPerformingLoans -72% -21% -15% 80% 38% 18%
Totalliabilities 1,769,495 2,080,456 2,407,260 2,496,489 2,678,098 2,942,018 Deposits &currentaccounts 14% 19% 26% 1% 13% 10%
Shareholders Funds 147,345 189,106 227,649 257,065 280,945 312,725 Totalassets 19% 18% 16% 4% 7% 10%
Minority Interest 3,595 3,361 7,387 7,387 7,387 7,387 Totalliabilities 23% 18% 16% 4% 7% 10%
NonPerformingLoans 16,936 13,439 11,483 20,670 28,421 33,537 Shareholders Funds -16% 28% 22% 13% 9% 11%
BVPS 4.7 5.8 7.1 8.0 7.9 8.8
Source: Company, CSL estimates
Nigerian Banks
Page 33
Equities
CSL Stockbrokers is a division of FCMB (UK) Limited which is authorised by the Prudential Regulation Authority
(PRA) and regulated by the Financial Conduct Authority (FCA) in the United Kingdom.
.
Guaranty Trust Bank
Revision to estimates
 We revise down our estimates for Guaranty Trust Bank (GTB) based
on recent measures taken by the Central Bank of Nigeria (CBN) and
the expected impact of naira devaluation and of weak oil prices on
2015e earnings.
 We model GTB’s overall cost of risk (COR) rising in 2015e from our
earlier-modelled 0.5% to 3.2%. We arrive at this increment by
modelling the effect of a loss (effectively without collateral and
therefore with 100% provision) of 6.4% of its US dollar loans. By
contrast, if 10.0% of its US dollar loans were to require 100%
provisions in 2015e, then we would model an overall COR of 4.7%.
 These changes result in a reduction in our PBT forecasts by 13% in
2014e, by 42% in 2015e and by 22% in 2016e. We retain our Buy
recommendation on GTB with a reduced price target of N28.42/s from
N39.80/share (current price N20.87/s), based on an implied 2.1x P/BV
multiple applied to our FY2015e BVPS estimates of N13.8.
 As at FY 2013, GTB’s US dollar loans made up 38.8% of gross loans.
Assuming the proportion of US dollar loans to be stable, we estimate that
6.4% of these loans will become loss loans in 2015e based on the
expected impact of naira devaluation and of weak oil prices, and would
require a 100% provision (assuming no collateral). This results in N35.9bn
in additional provisions in our model for 2015e, implying an increase in
cost of risk (COR) to 3.2% from 0.5% modelled previously. Our 6.4% US
dollar loans default assumption reflects our positive perception of GTB’s
risk management framework relative to other Nigerian banks.
Source: CSL estimates
 We revise down our Net Interest Income forecasts by 15% in 2014e, 19%
in 2015e and by 21% in 2016e, in part to reflect the impact of the increase
Guaranty Trust Bank Nm
2014e Old 2014e New change 2015e Old 2015e New change 2016e Old 2016e New change
NetInterestIncome 160,753 136,779 -15% 188,278 151,896 -19% 223,212 175,546 -21%
NetFee and Commission Income 42,567 49,562 16% 38,051 44,346 17% 31,979 32,252 1%
Otherincome 15,537 17,007 9% 18,645 20,408 9% 22,374 24,490 9%
Impairmentcharge (5,563) (7,947) 43% (7,097) (42,383) 497% (9,770) (10,882) 11%
Costofrisk(COR) 0.5% 0.7% 21bps 0.5% 3.2% 270bps 0.6% 0.7% 11bps
Operating expenses (93,268) (90,792) -3% (105,393) (98,055) -7% (119,094) (105,899) -11%
PBT 120,027 104,609 -13% 132,484 76,213 -42% 148,702 115,507 -22%
Tax (21,605) (17,784) -18% (23,847) (12,956) -46% (26,766) (19,636) -27%
NetProfits 98,422 86,826 -12% 108,637 63,257 -42% 121,935 95,871 -21%
Recommendation: Buy
Target: N28.42 Price: N20.87
price as at 28 Jan
Year to December, Nbn
2013 2014e 2015e 2016e
Net Interest
Income 136.9 136.8 151.9 175.5
Net profits 90.0 86.8 63.3 95.9
EPS, N 3.19 2.95 2.15 3.26
P/BV 1.8 1.6 1.5 1.3
PE 6.5 7.1 9.7 6.4
Div Yield (%) 8.4 7.1 5.1 8.6
Mkt. cap. N589.8bn ($3.2bn)
Free float 99.8%
Bloomberg GUARANTY NL
Reuters GUARANT.LG
Three-year graph
10
20
30
40
Jan-12 Jan-13 Jan-14 Jan-15
GT Bank share price GT Bank rel. to Nigeria All-Share
Contact information
Lagos: +234 (0)1 448 5436
Analyst: Gloria Obayagbo
+234 (0)1 448 5436
Head of Research: Guy Czartoryski
Sales: Temi Popoola, CFA
+234 (0) 1 448 5420 ext/ 4507
London: +44 (0) 20 7220 1041
Nigerian Banks
Page 34
Equities
CSL Stockbrokers is a division of FCMB (UK) Limited which is authorised by the Prudential Regulation Authority
(PRA) and regulated by the Financial Conduct Authority (FCA) in the United Kingdom.
.
in cash reserve requirement (CRR) on private sector deposits from 15% to
20% in November 2014.
 GTB has been quite successful in compensating for the reduction in
permissible commission on turnover (COT) to 2 per mille in 2014 from 3
per mille in 2013, by an increase in Other Fees and Commissions.
Consequently, we increase our Net Fees and Commission Income
forecasts by 16% in 2014e and by 17% in 2015e.
 The bank’s Impairment Charge rose significantly in H1 2014. This,
according to management, was due to a cautionary provision taken on
Lister Flour Mills Nigeria Ltd in Q2. Based on this, we have increased our
2014e Impairment Charge forecasts by 43.0% to N7.9bn (US43.4m) from
N5.6bn previously.
 GTB’s deposit growth was quite slow in 9M 2014 despite the fact that
management had earlier guided to 20% growth for 2014e. As at 9M 2014,
Customer Deposits were up only 8%. Consequently, we have revised
down our deposit growth forecast to 15% in 2014e from 20% previously.
Based on current economic conditions, we also revise down our loan
growth forecasts to 15% in 2015e and 2016e, from 18% previously for
both years.
 The bank reported total capital adequacy ratio (CAR) of 21.0% for H1
2014 which, according to management, was computed in line with Basel II
requirements. This, compared with the 16.0% regulatory requirement for
GTB, implies the bank has adequate capital. The managing director also
stated during a conference call that the dividend pay-out will remain the
same as in previous years. However, we slightly reduce our pay-out ratio
assumption for 2014e and 2015e to 50.0% from 55.0% for both years
considering the need for prudence.
 The overall effect of these and other minor changes to our estimates is a
reduction in our PBT forecasts by 13% in 2014e, 42% in 2015e and by
22% in 2016e. We maintain a Buy rating on GTB with a revised price
target of N29.2/s, down from N39.80/s previously. We derive our N28.4/s
price target by applying an implied 2.1x P/BV multiple to our 2015e BVPS
estimate of N13.8. Our 2.1x multiple is derived with key inputs of 32.0%
long-term RoAE, 13.0% risk free rate,19.6% cost of equity (COE) and
8.0% long term growth rate.
Nigerian Banks
Page 35
Equities
CSL Stockbrokers is a division of FCMB (UK) Limited which is authorised by the Prudential Regulation Authority
(PRA) and regulated by the Financial Conduct Authority (FCA) in the United Kingdom.
.
GTB Financials and ratios Nm
Incomestatement 2011 2012 2013 2014E 2015E 2016E Profitabilityratios 2011 2012 2013 2014E 2015E 2016E
Interest&discountincome 126,472 170,295 185,383 194,402 217,083 249,458 Netinterestmargin 8.3% 9.7% 9.5% 8.9% 9.0% 9.0%
Interestexpense (27,980) (39,609) (48,444) (57,623) (65,186) (73,912) Cost/incomeratio 52.9% 43.1% 43.5% 46.5% 56.3% 47.8%
NetInterestincome 98,492 130,686 136,939 136,779 151,896 175,546 Cost/incomeratioexprov. 46.1% 42.9% 42.9% 44.6% 45.3% 45.6%
Other income 52,918 51,082 55,576 66,569 64,754 56,742 Pre-taxmargin 34.6% 46.5% 44.1% 40.1% 27.0% 37.7%
Profitbeforeprov. 151,410 181,768 192,515 203,348 216,651 232,289 RoAA 3.8% 5.2% 4.7% 3.9% 2.5% 3.4%
Loanimpairmentcharges (19,503) (739) (2,886) (7,947) (42,383) (10,882) RoAE 23.9% 33.8% 29.4% 24.7% 16.2% 21.6%
TotalOpex (69,827) (78,001) (82,538) (90,792) (98,055) (105,899) Cost-to-assets 4.3% 4.5% 3.9% 3.8% 3.7% 3.5%
Cost/incomeratio 52.9% 43.1% 43.5% 46.5% 56.3% 47.8%
Cost/incomeratioexprov. 46.1% 42.9% 42.9% 44.6% 45.3% 45.6% Assetqualityratios 2011 2012 2013 2014E 2015E 2016E
PBT 62,080 103,028 107,091 104,609 76,213 115,507 NPL/Totalloans 3.5% 3.4% 3.3% 3.5% 3.5% 3.8%
Taxation (14,277) (16,341) (17,067) (17,784) (12,956) (19,636)
Effectivetaxrate -23% -16% -16% -17% -17% -17% Capitalratios 2011 2012 2013 2014E 2015E 2016E
MinorityInterest 538 338 338 338 339 340 Leverage 7.0x 6.1x 6.4x 6.3x 6.5x 6.3x
Profitfortheyear 51,741 87,296 90,024 86,826 63,257 95,871
EPS(reported) 1.76 3.05 3.19 2.95 2.15 3.26 Liquidityratios 2011 2012 2013 2014E 2015E 2016E
EPS(adjusted) 1.76 3.09 3.19 2.95 2.15 3.26 Loans/Deposit 69% 68% 70% 72% 72% 72%
DPS 1.10 1.55 1.75 1.48 1.07 1.79
Payoutratio 63% 51% 55% 50% 50% 55% Growth-y/y 2011 2012 2013 2014E 2015E 2016E
Dividendsum 32,374 44,373 49,513 43,413 31,628 52,729 NetInterestincome 20% 33% 5% 0% 11% 16%
WeightedAve.ShareCount 29,431 28,261 28,261 29,431 29,432 29,433 Other income 27% -3% 9% 20% -3% -12%
Profitbeforeprov. 22% 20% 6% 6% 7% 7%
Balancesheet 2011 2012 2013 2014E 2015E 2016E TotalOpex 9% 12% 6% 10% 8% 8%
Cash&cashequivalents 66,057 129,429 307,396 254,464 272,816 317,687 PBT 20% 66% 4% -2% -27% 52%
Investments securities 164,941 145,257 459,415 376,720 433,228 498,213 Profitfortheyear 26% 69% 3% -4% -27% 52%
Loans &advances 706,893 779,050 1,002,371 1,182,797 1,360,217 1,564,249 EPS(adjusted) 0% 76% 3% -7% -27% 52%
TreasuryBills/moneymarketplacements221,014 147,427 0 0 0 0 Dividendsum 21% 37% 12% -12% -27% 67%
Otherassets 81,098 0 0 0 0 0 Loans &advances 19% 10% 29% 18% 15% 15%
Deferedtaxasset 97 992 1,946 2,016 2,076 2,138 NonPerformingLoans (NPL) -46% 17% 26% 26% 18% 25%
Propertyandequipement 57,511 60,887 68,306 74,454 80,038 86,041 Totaldeposits 35% 12% 24% 15% 15% 15%
Financialassets heldfortrading 173,298 271,074 17,224 18,774 20,182 21,695 Totalassets 43% 8% 21% 12% 12% 14%
Totalassets 1,608,653 1,734,879 2,102,846 2,358,346 2,647,806 3,022,612 Totalliabilities 46% 5% 22% 12% 13% 13%
Totaldeposits 1,026,119 1,148,197 1,427,494 1,641,618 1,887,860 2,171,039 Shareholders'Funds 12% 24% 16% 15% 8% 19%
otherborrowings 93,230 92,562 92,135 87,735 90,367 93,078
Totalliabilities 1,378,259 1,451,437 1,770,489 1,978,416 2,237,074 2,535,856
Shareholders'Funds 228,392 282,172 327,270 374,776 405,579 481,603
MinorityInterest 2,001 1,269 5,084 5,153 5,153 5,153
BVPS 7.8 10.0 11.6 12.7 13.8 16.4
Source: Company, CSL estimates
Nigerian Banks
Page 36
Equities
CSL Stockbrokers is a division of FCMB (UK) Limited which is authorised by the Prudential Regulation Authority
(PRA) and regulated by the Financial Conduct Authority (FCA) in the United Kingdom.
.
Access Bank
Revision to estimates
 We revise our forecasts for Access Bank in response to recent
developments and their impact on earnings and asset quality. These
range from the slide in oil prices and the devaluation of the naira to
the increase in the private sector cash reserve requirement (CRR) and
the monetary policy rate (MPR).
 We model Access Bank’s overall cost of risk (COR) rising in 2015e
from our earlier-modelled 0.6% to 4.0%. We arrive at this increment by
modelling the effect of a loss (effectively without collateral and
therefore with 100% provision) of 7.2% of its US dollar loans.
 Our PBT forecast decreases by 2.4% in 2014e, 75.0% in 2015e, and
47.2% in 2016e.
 We upgrade Access Bank from Hold to Buy with a reduced price target
of N7.73/s from N11.00/s (current price N5.34/s), based on an implied
0.7x P/BV multiple to our FY2015e BVPS estimate of N11.19.
 As at 9M 2014, Access Bank’s portion of US dollar loans stood at 45% of
gross loans. In estimating COR for 2015e, we have assumed that 7.2% of
these loans become loss loans and would require 100.0% provisions,
assuming no collateral collection. We estimate this would increase the
bank’s COR to 4.0% from 0.6% modelled previously.
Source: CSL estimates
 In November 2014, the Central Bank of Nigeria (CBN) hiked the private
sector CRR to 20% from 15% and reviewed the MPR upward to 13% from
12%. We expect the upward review in MPR to improve the bank’s margins
and compensate, to an extent, for the lower interest yielding assets that will
likely result from the hike in private sector CRR. We therefore adjust Net
Access Bank, Nm
2014e Old 2014e New change 2015e Old 2015e New change 2016e Old 2016e New change
Netinterestincome 96,325 95,390 -1% 106,647 104,715 -2% 113,745 111,455 -2%
Netfee & commission income 29,359 29,247 0% 32,330 32,109 -1% 35,727 35,498 -1%
Other income 31,663 31,499 -1% 36,704 36,366 -1% 39,781 39,390 -1%
Impairmentcharge (6,169) (6,453) 5% (6,759) (45,059) 567% (7,576) (31,568) 317%
Costofrisk 0.6% 0.7% 10bps 0.6% 4.0% 340bps 0.6% 2.5% 190bps
Operating expenses (103,409) (103,082) 0% (115,428) (114,752) -1% (126,418) (125,613) -1%
PBT 47,767 46,601 -2% 53,494 13,380 -75% 55,268 29,162 -47%
Tax (7,165) (6,990) -2% (8,024) (2,007) -75% (8,290) (4,374) -47%
Netprofits 40,602 39,611 -2% 45,470 11,373 -75% 46,978 24,788 -47%
Recommendation: Buy
Target: N7.73 Price: N5.34
price as at 28 Jan
Year to December, Nbn
2013 2014e 2015e 2016e
Net Interest
Income 77.7 95.4 104.7 111.5
Net Profits 36.3 39.6 11.4 24.8
EPS, N 1.64 1.73 0.37 0.81
P/BV 0.5x 0.4x 0.5x 0.4x
PE 3.3x 3.1x 14.3x 6.6x
Div Yield 8.6% 4.5% 1.1% 2.4%
Mkt. cap. N122.2bn (US$660.6m)
Free float 84.2%
Bloomberg ACCESS NL
Reuters ACCESS.LG
Three-year graph
0
5
10
15
Jan-12 Jan-13 Jan-14 Jan-15
Access Bank share price
Access Bank rel. to Nigeria All-Share
Contact information
Lagos: +234 (0)1 448 5436
Analyst: Fola Abimbola
+234 (0)1 448 5436
Head of Research: Guy Czartoryski
Sales: Temi Popoola, CFA
+234 (0) 1 448 5420 ext. 4507
London: +44 (0) 20 7220 1041
Nigerian Banks
Page 37
Equities
CSL Stockbrokers is a division of FCMB (UK) Limited which is authorised by the Prudential Regulation Authority
(PRA) and regulated by the Financial Conduct Authority (FCA) in the United Kingdom.
.
Interest Income slightly downward by 1.0% for 2014e and 2.0% for 2015e
and 2016e.
 While we do not rule out the risk of more stringent monetary policy
measures in the coming months, we are more concerned about the
negative impact of falling oil prices on Access Bank’s earnings and asset
quality. Access Bank had the highest ratio of oil and gas non-performing
loans (NPL) to oil and gas loans, at 3.6% as at 9M 2014, relative to its peer
average of 1.6%.
 Additionally, Access Bank’s highest loan exposure was in the oil and gas
sector, at 24.7% of gross loans, with all of its upstream oil and gas loans
denominated in US dollars. We raise our COR estimate to 4.0% from 0.6%
for 2015e.
 To create additional capital buffers, Access Bank boosted its tier-2 capital
by raising N64.8bn (US$400m) through a 7-year subordinated debt issue in
June 2014. Subsequently, it recently announced a one-for-three rights
offering at an issue price of N6.90/s, targeted at raising N52.6bn
(US$284.3m), with additional shares from the issue expected to be listed in
June 2015.
 We incorporate the outcome of the rights issue into our model using a price
of N6.90 as suggested by the bank recently. As a result, we model a
dilution of 7.6bn additional shares and a capital adequacy ratio (CAR) of
20.7% for 2014e, 22.2% for 2015e, and 19.6% for 2016e.
Source: Company financials, CSL estimates
Access Bank CAR, Nm
2011 2012 2013 2014e 2015e 2016e
Tier-1 capital
Share capital and premium 155,105.0 176,628.3 172,477.7 172,477.7 225,108.4 225,108.4
Retained earnings (6,744.6) 17,856.6 22,232.4 42,830.0 50,222.3 62,616.1
Other reserves 20,649.5 38,700.4 48,003.9 61,867.7 64,142.2 72,817.9
169,009.9 233,185.3 242,713.9 277,175.3 339,472.9 360,542.4
Add/(less)
Fair value reserve for AFS securities 0.0 (2,037.7) (6,172.7) 0.0 0.0 0.0
Securities & properties & equipments (4,623.7)
Foreign currency translational reserves 0.0 (1,453.0) 6,268.4 6,300.0 8,780.0 5,730.0
Investments in subsidiaries 0.0 0.0 0.0 0.0 0.0 0.0
Deferred tax assets (8,114.0) (10,687.6) (10,887.6) (11,037.6) (11,162.6)
Intangible assets (3,277.6) (3,404.9) (3,659.1) (3,859.1) (4,059.1) (4,259.1)
Total tier-1 capital 161,108.6 218,175.7 228,463.0 268,728.6 333,156.2 350,850.7
Tier-2 capital
Fair value reserve for AFS securities 4,623.7 2,037.7 6,172.7 6,550.0 6,590.0 6,610.0
Foreign currency translational reserves 0.0 1,453.0 (6,268.4) 6,300.0 8,780.0 5,730.0
Subordinated debt 0.0 0.0 0.0 64,800.0 62,300.0 49,900.0
Collective allow ances for impairments 4,734.6
Non-controlling interest 23,054.8 8,099.6 1,768.1 1,856.5 1,949.3 2,046.8
Total tier-2 capital 32,413.1 11,590.2 1,672.3 79,506.5 79,619.3 64,286.8
Total capital 193,521.7 229,765.9 230,135.3 348,235.1 412,775.5 415,137.5
Risk-weighted assets 895,301.3 1,043,455.1 1,209,463.3 1,685,195.0 1,860,575.5 2,117,043.8
Capital adequacy ratio 21.6% 22.0% 19.0% 20.7% 22.2% 19.6%
Nigerian Banks
Page 38
Equities
CSL Stockbrokers is a division of FCMB (UK) Limited which is authorised by the Prudential Regulation Authority
(PRA) and regulated by the Financial Conduct Authority (FCA) in the United Kingdom.
.
 We also cut our forecast dividend pay-out ratio to 13.0% from 20.0% in
2014e, and an average of 15.0% in 2015e-2016e from 20.0%, as we
expect Access Bank to capitalise a higher percentage of its Net Profits than
before, in order to maintain an optimal CAR.
 We model a reduction of our forecasts of PBT of 2.4% in 2014e, 75.0% in
2015e, and of 47.2% in 2016e. We raise our rating on Access Bank from
Hold to Buy with a reduced price target of N7.73/s from 11.00/s previously.
We arrive at our price target using an implied P/BV multiple of 0.7x and a
BVPS estimate of N11.19 for 2015e. We also assume a 17.0% long term
sustainable ROE, an 8.0% growth rate, and a cost of equity of 21.0% in our
model.
CSl Nigerian Banks Disaster

More Related Content

What's hot

Etfin pro module 1 times pro
Etfin pro module 1 times proEtfin pro module 1 times pro
Etfin pro module 1 times pro9460441550
 
RBI's 4th Bi-monthly Monetary Policy 2018-19
RBI's 4th Bi-monthly Monetary Policy 2018-19RBI's 4th Bi-monthly Monetary Policy 2018-19
RBI's 4th Bi-monthly Monetary Policy 2018-19iciciprumf
 
Abch group results booklet june_2013
Abch group results booklet june_2013Abch group results booklet june_2013
Abch group results booklet june_2013wgjlubbe
 
Note on dspblk bond fund march 2018 1
Note on dspblk bond fund march 2018 1Note on dspblk bond fund march 2018 1
Note on dspblk bond fund march 2018 1Vidya Ashok
 
Abch group results booklet june_2012
Abch group results booklet june_2012Abch group results booklet june_2012
Abch group results booklet june_2012wgjlubbe
 
‘Over the Horizon’ sharemarket commentary – October 2013
‘Over the Horizon’ sharemarket commentary – October 2013‘Over the Horizon’ sharemarket commentary – October 2013
‘Over the Horizon’ sharemarket commentary – October 2013David Offer
 
3 2) factsheet
3 2) factsheet3 2) factsheet
3 2) factsheetkbasset
 
Abch group results booklet dec 2013
Abch group results booklet dec 2013Abch group results booklet dec 2013
Abch group results booklet dec 2013wgjlubbe
 
Abch results publication dec08
Abch results publication dec08Abch results publication dec08
Abch results publication dec08wgjlubbe
 
Updated High Yield Individual Account Strategy June 2015
Updated High Yield Individual Account Strategy June 2015Updated High Yield Individual Account Strategy June 2015
Updated High Yield Individual Account Strategy June 2015Liberty Securities
 
Session3 4-5-6 investment planning
Session3  4-5-6  investment planningSession3  4-5-6  investment planning
Session3 4-5-6 investment planningDipesh Jain
 
Session3 4-5-6 investment planning [autosaved]
Session3  4-5-6  investment planning [autosaved]Session3  4-5-6  investment planning [autosaved]
Session3 4-5-6 investment planning [autosaved]Dipesh Jain
 
Abch group results booklet 2010_final
Abch group results booklet 2010_finalAbch group results booklet 2010_final
Abch group results booklet 2010_finalwgjlubbe
 
ICICI Prudential Floating Interest Fund
ICICI Prudential Floating Interest FundICICI Prudential Floating Interest Fund
ICICI Prudential Floating Interest Fundiciciprumf
 
Abch brochure june 09 final
Abch brochure june 09 finalAbch brochure june 09 final
Abch brochure june 09 finalwgjlubbe
 
Impact of Rate Cut on Your Money
Impact of Rate Cut on Your MoneyImpact of Rate Cut on Your Money
Impact of Rate Cut on Your MoneyLatin Manharlal
 
Presentation on-idfc-floating-rate-fund feb-21
Presentation on-idfc-floating-rate-fund feb-21Presentation on-idfc-floating-rate-fund feb-21
Presentation on-idfc-floating-rate-fund feb-21IDFCJUBI
 
Debt outlook and Asset Allocation
Debt outlook and Asset AllocationDebt outlook and Asset Allocation
Debt outlook and Asset AllocationQuantum Mutual Fund
 

What's hot (20)

Etfin pro module 1 times pro
Etfin pro module 1 times proEtfin pro module 1 times pro
Etfin pro module 1 times pro
 
RBI's 4th Bi-monthly Monetary Policy 2018-19
RBI's 4th Bi-monthly Monetary Policy 2018-19RBI's 4th Bi-monthly Monetary Policy 2018-19
RBI's 4th Bi-monthly Monetary Policy 2018-19
 
ET FinPro mod 2 final 2
ET FinPro mod 2 final 2ET FinPro mod 2 final 2
ET FinPro mod 2 final 2
 
Abch group results booklet june_2013
Abch group results booklet june_2013Abch group results booklet june_2013
Abch group results booklet june_2013
 
Note on dspblk bond fund march 2018 1
Note on dspblk bond fund march 2018 1Note on dspblk bond fund march 2018 1
Note on dspblk bond fund march 2018 1
 
Abch group results booklet june_2012
Abch group results booklet june_2012Abch group results booklet june_2012
Abch group results booklet june_2012
 
‘Over the Horizon’ sharemarket commentary – October 2013
‘Over the Horizon’ sharemarket commentary – October 2013‘Over the Horizon’ sharemarket commentary – October 2013
‘Over the Horizon’ sharemarket commentary – October 2013
 
3 2) factsheet
3 2) factsheet3 2) factsheet
3 2) factsheet
 
Abch group results booklet dec 2013
Abch group results booklet dec 2013Abch group results booklet dec 2013
Abch group results booklet dec 2013
 
Abch results publication dec08
Abch results publication dec08Abch results publication dec08
Abch results publication dec08
 
Updated High Yield Individual Account Strategy June 2015
Updated High Yield Individual Account Strategy June 2015Updated High Yield Individual Account Strategy June 2015
Updated High Yield Individual Account Strategy June 2015
 
Session3 4-5-6 investment planning
Session3  4-5-6  investment planningSession3  4-5-6  investment planning
Session3 4-5-6 investment planning
 
Session3 4-5-6 investment planning [autosaved]
Session3  4-5-6  investment planning [autosaved]Session3  4-5-6  investment planning [autosaved]
Session3 4-5-6 investment planning [autosaved]
 
Abch group results booklet 2010_final
Abch group results booklet 2010_finalAbch group results booklet 2010_final
Abch group results booklet 2010_final
 
ICICI Prudential Floating Interest Fund
ICICI Prudential Floating Interest FundICICI Prudential Floating Interest Fund
ICICI Prudential Floating Interest Fund
 
Karur vysya bank
Karur vysya bankKarur vysya bank
Karur vysya bank
 
Abch brochure june 09 final
Abch brochure june 09 finalAbch brochure june 09 final
Abch brochure june 09 final
 
Impact of Rate Cut on Your Money
Impact of Rate Cut on Your MoneyImpact of Rate Cut on Your Money
Impact of Rate Cut on Your Money
 
Presentation on-idfc-floating-rate-fund feb-21
Presentation on-idfc-floating-rate-fund feb-21Presentation on-idfc-floating-rate-fund feb-21
Presentation on-idfc-floating-rate-fund feb-21
 
Debt outlook and Asset Allocation
Debt outlook and Asset AllocationDebt outlook and Asset Allocation
Debt outlook and Asset Allocation
 

Similar to CSl Nigerian Banks Disaster

ATA INVEST- TR BANKS- UPDATE March 2015
ATA INVEST- TR BANKS- UPDATE March 2015ATA INVEST- TR BANKS- UPDATE March 2015
ATA INVEST- TR BANKS- UPDATE March 2015Derya Guzel
 
GTI Research-UBA9Months 2015 Report
GTI Research-UBA9Months  2015 ReportGTI Research-UBA9Months  2015 Report
GTI Research-UBA9Months 2015 ReportChuks Anyanwu
 
VOG Deal Reader_Q2 2015
VOG Deal Reader_Q2 2015VOG Deal Reader_Q2 2015
VOG Deal Reader_Q2 2015Jason Wirth
 
2Q 2013 IFRS Earnings Presentation
2Q 2013 IFRS Earnings Presentation2Q 2013 IFRS Earnings Presentation
2Q 2013 IFRS Earnings PresentationGaranti Bank
 
Mercer Capital's Business Development Companies Quarterly Newsletter | Q1 2015
Mercer Capital's Business Development Companies Quarterly Newsletter | Q1 2015Mercer Capital's Business Development Companies Quarterly Newsletter | Q1 2015
Mercer Capital's Business Development Companies Quarterly Newsletter | Q1 2015Mercer Capital
 
JPM 2016 equity research
JPM 2016 equity researchJPM 2016 equity research
JPM 2016 equity researchAnthony Petalas
 
October 2015 Fitch Rating Bank of Astana B with Stable outlook Press release
October 2015 Fitch Rating Bank of Astana B with Stable outlook Press releaseOctober 2015 Fitch Rating Bank of Astana B with Stable outlook Press release
October 2015 Fitch Rating Bank of Astana B with Stable outlook Press releaseAlexander Chagoubat Millin
 
Investment Funds Advisory for Today: Buy Stock of J&K Bank with Target Price ...
Investment Funds Advisory for Today: Buy Stock of J&K Bank with Target Price ...Investment Funds Advisory for Today: Buy Stock of J&K Bank with Target Price ...
Investment Funds Advisory for Today: Buy Stock of J&K Bank with Target Price ...NARNOLIA SECURITIES LIMITED
 
The Lead Left Quarterly Capital Market Report 4Q 2015
The Lead Left Quarterly Capital Market Report 4Q 2015The Lead Left Quarterly Capital Market Report 4Q 2015
The Lead Left Quarterly Capital Market Report 4Q 2015The Lead Left
 
HDFC Bank result update: Q4FY15 PAT up 21% YoY, Motilal Oswal maintains 'Buy'
HDFC Bank result update: Q4FY15 PAT up 21% YoY, Motilal Oswal maintains 'Buy'HDFC Bank result update: Q4FY15 PAT up 21% YoY, Motilal Oswal maintains 'Buy'
HDFC Bank result update: Q4FY15 PAT up 21% YoY, Motilal Oswal maintains 'Buy'IndiaNotes.com
 
Banking Sector Q4FY15 preview: Asset quality will remain under pressure
Banking Sector Q4FY15 preview: Asset quality will remain under pressureBanking Sector Q4FY15 preview: Asset quality will remain under pressure
Banking Sector Q4FY15 preview: Asset quality will remain under pressureIndiaNotes.com
 
Bentham Global Credit update
Bentham Global Credit updateBentham Global Credit update
Bentham Global Credit updateMichael Kennedy
 
Tricumen / Capital Markets: Results Review 2Q14 / 6m14
Tricumen / Capital Markets: Results Review 2Q14 / 6m14Tricumen / Capital Markets: Results Review 2Q14 / 6m14
Tricumen / Capital Markets: Results Review 2Q14 / 6m14Tricumen Ltd
 
South African bonds remain investment grade... for now
South African bonds remain investment grade... for nowSouth African bonds remain investment grade... for now
South African bonds remain investment grade... for nowCraig Thompson
 
1Q 2013 Consolidated Earnings Presentation
1Q 2013 Consolidated Earnings Presentation1Q 2013 Consolidated Earnings Presentation
1Q 2013 Consolidated Earnings PresentationGaranti Bank
 
Liquidity Management of Standard Bank Limited: A Study on CDA Avenue Branch,...
Liquidity Management of Standard Bank Limited: A Study on CDA Avenue Branch,...Liquidity Management of Standard Bank Limited: A Study on CDA Avenue Branch,...
Liquidity Management of Standard Bank Limited: A Study on CDA Avenue Branch,...Md. Erfanul Hoque
 
Tricumen / Capital Markets: Results Review 1Q14
Tricumen / Capital Markets: Results Review 1Q14Tricumen / Capital Markets: Results Review 1Q14
Tricumen / Capital Markets: Results Review 1Q14Tricumen Ltd
 
Glacier REVISED
Glacier REVISEDGlacier REVISED
Glacier REVISEDSam Atari
 

Similar to CSl Nigerian Banks Disaster (20)

ATA INVEST- TR BANKS- UPDATE March 2015
ATA INVEST- TR BANKS- UPDATE March 2015ATA INVEST- TR BANKS- UPDATE March 2015
ATA INVEST- TR BANKS- UPDATE March 2015
 
GTI Research-UBA9Months 2015 Report
GTI Research-UBA9Months  2015 ReportGTI Research-UBA9Months  2015 Report
GTI Research-UBA9Months 2015 Report
 
VOG Deal Reader_Q2 2015
VOG Deal Reader_Q2 2015VOG Deal Reader_Q2 2015
VOG Deal Reader_Q2 2015
 
2Q 2013 IFRS Earnings Presentation
2Q 2013 IFRS Earnings Presentation2Q 2013 IFRS Earnings Presentation
2Q 2013 IFRS Earnings Presentation
 
IMSF Annual Report2 015
IMSF Annual Report2 015IMSF Annual Report2 015
IMSF Annual Report2 015
 
Mercer Capital's Business Development Companies Quarterly Newsletter | Q1 2015
Mercer Capital's Business Development Companies Quarterly Newsletter | Q1 2015Mercer Capital's Business Development Companies Quarterly Newsletter | Q1 2015
Mercer Capital's Business Development Companies Quarterly Newsletter | Q1 2015
 
JPM 2016 equity research
JPM 2016 equity researchJPM 2016 equity research
JPM 2016 equity research
 
October 2015 Fitch Rating Bank of Astana B with Stable outlook Press release
October 2015 Fitch Rating Bank of Astana B with Stable outlook Press releaseOctober 2015 Fitch Rating Bank of Astana B with Stable outlook Press release
October 2015 Fitch Rating Bank of Astana B with Stable outlook Press release
 
Investment Funds Advisory for Today: Buy Stock of J&K Bank with Target Price ...
Investment Funds Advisory for Today: Buy Stock of J&K Bank with Target Price ...Investment Funds Advisory for Today: Buy Stock of J&K Bank with Target Price ...
Investment Funds Advisory for Today: Buy Stock of J&K Bank with Target Price ...
 
JPM_f16
JPM_f16JPM_f16
JPM_f16
 
The Lead Left Quarterly Capital Market Report 4Q 2015
The Lead Left Quarterly Capital Market Report 4Q 2015The Lead Left Quarterly Capital Market Report 4Q 2015
The Lead Left Quarterly Capital Market Report 4Q 2015
 
HDFC Bank result update: Q4FY15 PAT up 21% YoY, Motilal Oswal maintains 'Buy'
HDFC Bank result update: Q4FY15 PAT up 21% YoY, Motilal Oswal maintains 'Buy'HDFC Bank result update: Q4FY15 PAT up 21% YoY, Motilal Oswal maintains 'Buy'
HDFC Bank result update: Q4FY15 PAT up 21% YoY, Motilal Oswal maintains 'Buy'
 
Banking Sector Q4FY15 preview: Asset quality will remain under pressure
Banking Sector Q4FY15 preview: Asset quality will remain under pressureBanking Sector Q4FY15 preview: Asset quality will remain under pressure
Banking Sector Q4FY15 preview: Asset quality will remain under pressure
 
Bentham Global Credit update
Bentham Global Credit updateBentham Global Credit update
Bentham Global Credit update
 
Tricumen / Capital Markets: Results Review 2Q14 / 6m14
Tricumen / Capital Markets: Results Review 2Q14 / 6m14Tricumen / Capital Markets: Results Review 2Q14 / 6m14
Tricumen / Capital Markets: Results Review 2Q14 / 6m14
 
South African bonds remain investment grade... for now
South African bonds remain investment grade... for nowSouth African bonds remain investment grade... for now
South African bonds remain investment grade... for now
 
1Q 2013 Consolidated Earnings Presentation
1Q 2013 Consolidated Earnings Presentation1Q 2013 Consolidated Earnings Presentation
1Q 2013 Consolidated Earnings Presentation
 
Liquidity Management of Standard Bank Limited: A Study on CDA Avenue Branch,...
Liquidity Management of Standard Bank Limited: A Study on CDA Avenue Branch,...Liquidity Management of Standard Bank Limited: A Study on CDA Avenue Branch,...
Liquidity Management of Standard Bank Limited: A Study on CDA Avenue Branch,...
 
Tricumen / Capital Markets: Results Review 1Q14
Tricumen / Capital Markets: Results Review 1Q14Tricumen / Capital Markets: Results Review 1Q14
Tricumen / Capital Markets: Results Review 1Q14
 
Glacier REVISED
Glacier REVISEDGlacier REVISED
Glacier REVISED
 

Recently uploaded

CALL ON ➥8923113531 🔝Call Girls Fazullaganj Lucknow best sexual service
CALL ON ➥8923113531 🔝Call Girls Fazullaganj Lucknow best sexual serviceCALL ON ➥8923113531 🔝Call Girls Fazullaganj Lucknow best sexual service
CALL ON ➥8923113531 🔝Call Girls Fazullaganj Lucknow best sexual serviceanilsa9823
 
OKC Thunder Reveal Game 2 Playoff T Shirts
OKC Thunder Reveal Game 2 Playoff T ShirtsOKC Thunder Reveal Game 2 Playoff T Shirts
OKC Thunder Reveal Game 2 Playoff T Shirtsrahman018755
 
VIP Amritsar Call Girl 7001035870 Enjoy Call Girls With Our Escorts
VIP Amritsar Call Girl 7001035870 Enjoy Call Girls With Our EscortsVIP Amritsar Call Girl 7001035870 Enjoy Call Girls With Our Escorts
VIP Amritsar Call Girl 7001035870 Enjoy Call Girls With Our Escortssonatiwari757
 
Cyberagent_For New Investors_EN_240424.pdf
Cyberagent_For New Investors_EN_240424.pdfCyberagent_For New Investors_EN_240424.pdf
Cyberagent_For New Investors_EN_240424.pdfCyberAgent, Inc.
 
Short-, Mid-, and Long-term gxxoals.pptx
Short-, Mid-, and Long-term gxxoals.pptxShort-, Mid-, and Long-term gxxoals.pptx
Short-, Mid-, and Long-term gxxoals.pptxHenryBriggs2
 
Call Girl Kolkata Sia 🤌 8250192130 🚀 Vip Call Girls Kolkata
Call Girl Kolkata Sia 🤌  8250192130 🚀 Vip Call Girls KolkataCall Girl Kolkata Sia 🤌  8250192130 🚀 Vip Call Girls Kolkata
Call Girl Kolkata Sia 🤌 8250192130 🚀 Vip Call Girls Kolkataanamikaraghav4
 
VIP Call Girl Amritsar 7001035870 Enjoy Call Girls With Our Escorts
VIP Call Girl Amritsar 7001035870 Enjoy Call Girls With Our EscortsVIP Call Girl Amritsar 7001035870 Enjoy Call Girls With Our Escorts
VIP Call Girl Amritsar 7001035870 Enjoy Call Girls With Our Escortssonatiwari757
 
Collective Mining | Corporate Presentation - April 2024
Collective Mining | Corporate Presentation - April 2024Collective Mining | Corporate Presentation - April 2024
Collective Mining | Corporate Presentation - April 2024CollectiveMining1
 
Methanex Investor Presentation (April 2024)
Methanex Investor Presentation (April 2024)Methanex Investor Presentation (April 2024)
Methanex Investor Presentation (April 2024)Methanex Corporation
 
VIP 7001035870 Find & Meet Hyderabad Call Girls Miyapur high-profile Call Girl
VIP 7001035870 Find & Meet Hyderabad Call Girls Miyapur high-profile Call GirlVIP 7001035870 Find & Meet Hyderabad Call Girls Miyapur high-profile Call Girl
VIP 7001035870 Find & Meet Hyderabad Call Girls Miyapur high-profile Call Girladitipandeya
 
Collective Mining | Corporate Presentation - April 2024
Collective Mining | Corporate Presentation - April 2024Collective Mining | Corporate Presentation - April 2024
Collective Mining | Corporate Presentation - April 2024CollectiveMining1
 

Recently uploaded (20)

CALL ON ➥8923113531 🔝Call Girls Fazullaganj Lucknow best sexual service
CALL ON ➥8923113531 🔝Call Girls Fazullaganj Lucknow best sexual serviceCALL ON ➥8923113531 🔝Call Girls Fazullaganj Lucknow best sexual service
CALL ON ➥8923113531 🔝Call Girls Fazullaganj Lucknow best sexual service
 
OKC Thunder Reveal Game 2 Playoff T Shirts
OKC Thunder Reveal Game 2 Playoff T ShirtsOKC Thunder Reveal Game 2 Playoff T Shirts
OKC Thunder Reveal Game 2 Playoff T Shirts
 
Preet Vihar (Delhi) 9953330565 Escorts, Call Girls Services
Preet Vihar (Delhi) 9953330565 Escorts, Call Girls ServicesPreet Vihar (Delhi) 9953330565 Escorts, Call Girls Services
Preet Vihar (Delhi) 9953330565 Escorts, Call Girls Services
 
Call Girls In Vasant Kunj 📱 9999965857 🤩 Delhi 🫦 HOT AND SEXY VVIP 🍎 SERVICE
Call Girls In Vasant Kunj 📱  9999965857  🤩 Delhi 🫦 HOT AND SEXY VVIP 🍎 SERVICECall Girls In Vasant Kunj 📱  9999965857  🤩 Delhi 🫦 HOT AND SEXY VVIP 🍎 SERVICE
Call Girls In Vasant Kunj 📱 9999965857 🤩 Delhi 🫦 HOT AND SEXY VVIP 🍎 SERVICE
 
Call Girls 🫤 Nehru Place ➡️ 9999965857 ➡️ Delhi 🫦 Russian Escorts FULL ENJOY
Call Girls 🫤 Nehru Place ➡️ 9999965857  ➡️ Delhi 🫦  Russian Escorts FULL ENJOYCall Girls 🫤 Nehru Place ➡️ 9999965857  ➡️ Delhi 🫦  Russian Escorts FULL ENJOY
Call Girls 🫤 Nehru Place ➡️ 9999965857 ➡️ Delhi 🫦 Russian Escorts FULL ENJOY
 
VIP Amritsar Call Girl 7001035870 Enjoy Call Girls With Our Escorts
VIP Amritsar Call Girl 7001035870 Enjoy Call Girls With Our EscortsVIP Amritsar Call Girl 7001035870 Enjoy Call Girls With Our Escorts
VIP Amritsar Call Girl 7001035870 Enjoy Call Girls With Our Escorts
 
Call Girls Service Green Park @9999965857 Delhi 🫦 No Advance VVIP 🍎 SERVICE
Call Girls Service Green Park @9999965857 Delhi 🫦 No Advance  VVIP 🍎 SERVICECall Girls Service Green Park @9999965857 Delhi 🫦 No Advance  VVIP 🍎 SERVICE
Call Girls Service Green Park @9999965857 Delhi 🫦 No Advance VVIP 🍎 SERVICE
 
Cyberagent_For New Investors_EN_240424.pdf
Cyberagent_For New Investors_EN_240424.pdfCyberagent_For New Investors_EN_240424.pdf
Cyberagent_For New Investors_EN_240424.pdf
 
Short-, Mid-, and Long-term gxxoals.pptx
Short-, Mid-, and Long-term gxxoals.pptxShort-, Mid-, and Long-term gxxoals.pptx
Short-, Mid-, and Long-term gxxoals.pptx
 
Call Girl Kolkata Sia 🤌 8250192130 🚀 Vip Call Girls Kolkata
Call Girl Kolkata Sia 🤌  8250192130 🚀 Vip Call Girls KolkataCall Girl Kolkata Sia 🤌  8250192130 🚀 Vip Call Girls Kolkata
Call Girl Kolkata Sia 🤌 8250192130 🚀 Vip Call Girls Kolkata
 
VIP Call Girl Amritsar 7001035870 Enjoy Call Girls With Our Escorts
VIP Call Girl Amritsar 7001035870 Enjoy Call Girls With Our EscortsVIP Call Girl Amritsar 7001035870 Enjoy Call Girls With Our Escorts
VIP Call Girl Amritsar 7001035870 Enjoy Call Girls With Our Escorts
 
Russian Call Girls Rohini Sector 22 💓 Delhi 9999965857 @Sabina Modi VVIP MODE...
Russian Call Girls Rohini Sector 22 💓 Delhi 9999965857 @Sabina Modi VVIP MODE...Russian Call Girls Rohini Sector 22 💓 Delhi 9999965857 @Sabina Modi VVIP MODE...
Russian Call Girls Rohini Sector 22 💓 Delhi 9999965857 @Sabina Modi VVIP MODE...
 
Collective Mining | Corporate Presentation - April 2024
Collective Mining | Corporate Presentation - April 2024Collective Mining | Corporate Presentation - April 2024
Collective Mining | Corporate Presentation - April 2024
 
Methanex Investor Presentation (April 2024)
Methanex Investor Presentation (April 2024)Methanex Investor Presentation (April 2024)
Methanex Investor Presentation (April 2024)
 
Russian Call Girls Rohini Sector 3 💓 Delhi 9999965857 @Sabina Modi VVIP MODEL...
Russian Call Girls Rohini Sector 3 💓 Delhi 9999965857 @Sabina Modi VVIP MODEL...Russian Call Girls Rohini Sector 3 💓 Delhi 9999965857 @Sabina Modi VVIP MODEL...
Russian Call Girls Rohini Sector 3 💓 Delhi 9999965857 @Sabina Modi VVIP MODEL...
 
Call Girls In South Delhi 📱 9999965857 🤩 Delhi 🫦 HOT AND SEXY VVIP 🍎 SERVICE
Call Girls In South Delhi 📱  9999965857  🤩 Delhi 🫦 HOT AND SEXY VVIP 🍎 SERVICECall Girls In South Delhi 📱  9999965857  🤩 Delhi 🫦 HOT AND SEXY VVIP 🍎 SERVICE
Call Girls In South Delhi 📱 9999965857 🤩 Delhi 🫦 HOT AND SEXY VVIP 🍎 SERVICE
 
VIP Call Girls Kolkata Kirti Call Now 8617697112 Kolkata Escorts
VIP Call Girls Kolkata Kirti Call Now 8617697112 Kolkata EscortsVIP Call Girls Kolkata Kirti Call Now 8617697112 Kolkata Escorts
VIP Call Girls Kolkata Kirti Call Now 8617697112 Kolkata Escorts
 
VIP 7001035870 Find & Meet Hyderabad Call Girls Miyapur high-profile Call Girl
VIP 7001035870 Find & Meet Hyderabad Call Girls Miyapur high-profile Call GirlVIP 7001035870 Find & Meet Hyderabad Call Girls Miyapur high-profile Call Girl
VIP 7001035870 Find & Meet Hyderabad Call Girls Miyapur high-profile Call Girl
 
Collective Mining | Corporate Presentation - April 2024
Collective Mining | Corporate Presentation - April 2024Collective Mining | Corporate Presentation - April 2024
Collective Mining | Corporate Presentation - April 2024
 
Escort Service Call Girls In Shalimar Bagh, 99530°56974 Delhi NCR
Escort Service Call Girls In Shalimar Bagh, 99530°56974 Delhi NCREscort Service Call Girls In Shalimar Bagh, 99530°56974 Delhi NCR
Escort Service Call Girls In Shalimar Bagh, 99530°56974 Delhi NCR
 

CSl Nigerian Banks Disaster

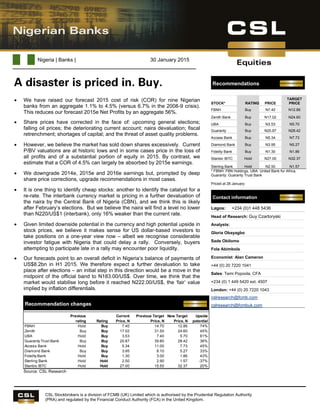
  • 1. Equities Nigerian Banks Nigeria | Banks | 30 January 2015 CSL Stockbrokers is a division of FCMB (UK) Limited which is authorised by the Prudential Regulation Authority (PRA) and regulated by the Financial Conduct Authority (FCA) in the United Kingdom. . A disaster is priced in. Buy.  We have raised our forecast 2015 cost of risk (COR) for nine Nigerian banks from an aggregate 1.1% to 4.5% (versus 6.7% in the 2008-9 crisis). This reduces our forecast 2015e Net Profits by an aggregate 56%.  Share prices have corrected in the face of: upcoming general elections; falling oil prices; the deteriorating current account; naira devaluation; fiscal retrenchment; shortages of capital; and the threat of asset quality problems.  However, we believe the market has sold down shares excessively. Current P/BV valuations are at historic lows and in some cases price in the loss of all profits and of a substantial portion of equity in 2015. By contrast, we estimate that a COR of 4.5% can largely be absorbed by 2015e earnings.  We downgrade 2014e, 2015e and 2016e earnings but, prompted by deep share price corrections, upgrade recommendations in most cases.  It is one thing to identify cheap stocks: another to identify the catalyst for a re-rate. The interbank currency market is pricing in a further devaluation of the naira by the Central Bank of Nigeria (CBN), and we think this is likely after February’s elections. But we believe the naira will find a level no lower than N220/US$1 (interbank), only 16% weaker than the current rate.  Given limited downside potential in the currency and high potential upside in stock prices, we believe it makes sense for US dollar-based investors to take positions on a one-year view now – albeit we recognise considerable investor fatigue with Nigeria that could delay a rally. Conversely, buyers attempting to participate late in a rally may encounter poor liquidity.  Our forecasts point to an overall deficit in Nigeria’s balance of payments of US$8.2bn in H1 2015. We therefore expect a further devaluation to take place after elections – an initial step in this direction would be a move in the midpoint of the official band to N183.00/US$. Over time, we think that the market would stabilise long before it reached N222.00/US$, the ‘fair’ value implied by inflation differentials. Source: CSL Research Recommendation changes Previous rating Rating Current Price, N Previous Target Price, N New Target Price, N Upside potential FBNH Hold Buy 7.40 14.70 12.86 74% Zenith Buy Buy 17.02 31.50 24.60 45% UBA Hold Buy 3.53 7.40 5.70 61% Guaranty Trust Bank Buy Buy 20.87 39.80 28.42 36% Access Bank Hold Buy 5.34 11.00 7.73 45% Diamond Bank Buy Buy 3.95 8.10 5.27 33% Fidelity Bank Hold Buy 1.30 3.00 1.86 43% Sterling Bank Hold Hold 2.50 2.90 1.57 -37% Stanbic IBTC Hold Hold 27.00 15.50 32.37 20% Recommendations STOCK* RATING PRICE TARGET PRICE FBNH Buy N7.40 N12.86 Zenith Bank Buy N17.02 N24.60 UBA Buy N3.53 N5.70 Guaranty Buy N20.87 N28.42 Access Bank Buy N5.34 N7.73 Diamond Bank Buy N3.95 N5.27 Fidelity Bank Buy N1.30 N1.86 Stanbic IBTC Hold N27.00 N32.37 Sterling Bank Hold N2.50 N1.57 * FBNH: FBN Holdings, UBA: United Bank for Africa, Guaranty: Guaranty Trust Bank Priced at 28 January Contact information Lagos: +234 (0)1 448 5436 Head of Research: Guy Czartoryski Analysts: Gloria Obayagbo Sade Obilomo Fola Abimbola Economist: Alan Cameron +44 (0) 20 7220 1041 Sales: Temi Popoola, CFA +234 (0) 1 449 5420 ext. 4507 London: +44 (0) 20 7220 1043 cslresearch@fcmb.com cslresearch@fcmbuk.com
  • 2. Nigerian Banks Page 2 Equities CSL Stockbrokers is a division of FCMB (UK) Limited which is authorised by the Prudential Regulation Authority (PRA) and regulated by the Financial Conduct Authority (FCA) in the United Kingdom. . Investment Summary  FBN Holdings (FBNH) faced capital shortages in 2014 and has the highest concentration of oil & gas sector lending (40.0% of Gross Loans) of the banks in this study. It is addressing its capital issues by managing risk-weighted assets (RWAs), disposing of – or not renewing – its largest low-yielding institutional loans. We have modelled a high level COR for 2015e, 5.8%, and reduced our 2015e Net Profits forecast by 99%. Yet the market prices FBNH as if it will lose roughly half its equity, and it trades at almost three standard deviations below its historic P/BV rating.  Zenith Bank has sufficient capital for several years’ expansion, in our view, and – in comparison with its peers – has moderate (17.9% of Gross Loans) exposure to the oil & gas sector. We model a COR of 3.2% for 2015e. Nevertheless it trades at 1.8 standard deviations lower than its historic average P/BV and, more significantly, 2.2 standard deviations below its historic market capitalisation/deposits (Mkt cap/deposits) rating.  United Bank for Africa (UBA) faced capital issues in 2014 that are currently being addressed with a 1-for-10 rights issue which we cover in this report. In comparison with its peers it has moderate (16.0% of Gross Loans) exposure to the oil & gas sector though, considering its provisioning history, we model a high COR, 5.2%, in 2015e. Like Zenith Bank, it trades on much lower P/BV and Mkt cap/deposits than its historical averages.  Guaranty Trust Bank renews its capital sufficiently for future expansion, in our view. It has quite high (28.0% of Gross Loans) exposure to the oil & gas sector, but its COR history suggests that it will manage this better in 2015 than its peers. We model a COR of 3.2% for 2015e. It trades at significant discounts to its historic P/BV and Mkt cap/deposits ratings, though not to the same extent as FBNH, Zenith Bank and UBA.  Access Bank is dealing with its shortage of capital with a 1-for-3 rights issue, recently announced and covered in this report. It has moderate to quite high (24.7%) exposure to the oil & gas sector but a high level of non-performing loans (NPLs), at 3.6%, in the sector and we model a COR of 4.0% for 2015e. It trades at 2.4 standard deviations lower than its average historic P/BV.  Diamond Bank last year dealt with its capital shortages, although we think there is a 50% chance of a further rights issue this year. It has quite high (27.0% of Gross Loans) exposure to the oil & gas sector and a COR history that leads us to model a high, 5.9%, COR in 2015e. It is trading at 1.1 standard deviations lower than its average historic P/BV ratio.  Neither Fidelity Bank nor Sterling Bank has capital issues, in our view. They have quite different exposures to the oil & gas sector (17.0% and 33.7% of Gross Loans, respectively) and we model COR of 3.5% and 4.0%, respectively, for 2015e. Fidelity Bank trades at 1.8 standard deviations, and Sterling Bank at 0.9 standard deviations, lower than their average historic P/BV ratios.  Stanbic IBTC, with Net Fees & Commissions fast approaching the level of Net Interest Income, has implemented an entirely different business model from its peers. Its investment banking, which includes the leading asset management business in the country, differentiates its strategy. It is trading at 1.3 standard deviations above its historic P/BV rating, and we think that this is appropriate.
  • 3. Nigerian Banks Page 3 Equities CSL Stockbrokers is a division of FCMB (UK) Limited which is authorised by the Prudential Regulation Authority (PRA) and regulated by the Financial Conduct Authority (FCA) in the United Kingdom. . Cost of risk – the search for granularity Over recent weeks banks have begun to give guidance on their cost of risk (COR) in 2015e which, while more pessimistic than previous guidance, does not fully capture the potential for rising non-performing loans (NPL) in 2015e, in our view. Source: Companies, CSL estimates. Among the nine banks covered in this report we forecast an aggregate COR of 4.5% in 2015e. This compares with an aggregate COR of some 6.9% for the same banks during the 2008-9 banking crisis. Source: Companies, CSL estimates. *simple averages As with past bank crises, it will doubtless prove impossible to determine exactly which banks will suffer the worst NPLs and the highest COR in 2015. This observation informs our view that taking a spread of risk among Nigerian banks at this stage is likely a better investment strategy than taking a single stock. History is likely to prove an approximate guide, however, and in the tables above we compare the COR during the last banking crisis with our new COR forecasts for 2015e. Forecast COR versus guidance COR 2014e Recent guidance COR 2015e Previous CSL COR 2015e New CSL COR 2015e FBNH 1.1% 1.5% 1.1% 5.8% Zenith 0.7% "above 1.0%" 0.8% 3.2% UBA 1.5% n/a 1.5% 5.2% Guaranty Trust Bank 0.7% below 1.0% 0.5% 3.2% Access Bank 0.6% 1.0% 0.6% 4.0% Diamond Bank 3.1% n/a 2.9% 5.9% Fidelity Bank 1.1% n/a 1.4% 3.5% Sterling Bank 1.3% "below 1.0%" 1.2% 4.0% Stanbic IBTC 0.9% 1.5% 1.5% 2.5% Average cost of risk 1.1% n/a 1.2% 4.5% COR history versus forecast 2008-2009 2010 2011 2012 2013 2014e 2015e 2016e 2008-12* FBNH 6.7% 1.8% 3.0% 0.9% 1.2% 1.1% 5.8% 1.0% 3.1% Zenith 5.3% 0.6% 2.1% 0.9% 1.0% 0.7% 3.2% 0.9% 2.2% UBA 5.7% 2.7% 2.7% 0.7% 1.6% 1.5% 5.2% 1.7% 2.9% Guaranty Trust Bank 7.3% 1.3% 2.8% 0.1% 0.3% 0.7% 3.2% 0.7% 2.9% Access Bank 6.0% 1.0% 1.7% -1.6% -0.8% 0.6% 4.0% 2.5% 1.8% Diamond Bank 12.4% 6.8% 14.8% 3.3% 3.5% 3.1% 5.9% 2.8% 9.3% Fidelity Bank 8.4% 1.8% 6.7% 1.4% 1.9% 1.1% 3.5% 1.6% 4.6% Sterling Bank 14.6% 1.7% 4.3% -0.1% 2.9% 1.3% 4.0% 1.9% 5.1% Stanbic IBTC 4.2% 0.4% 1.5% 2.5% 0.9% 0.9% 2.5% 1.4% 2.2% Aggregate 6.9% n/a n/a n/a n/a 1.1% 4.5% 1.5% 2.80%
  • 4. Nigerian Banks Page 4 Equities CSL Stockbrokers is a division of FCMB (UK) Limited which is authorised by the Prudential Regulation Authority (PRA) and regulated by the Financial Conduct Authority (FCA) in the United Kingdom. . A note on methods As a straightforward method of augmenting forecast COR in 2015e we have taken our existing COR assumptions and increased them by assuming that a proportion of US dollar lending, which in many cases approximates to lending to the oil & gas sector, become loss loans in 2015e, with no collateral collection and therefore with 100% provisions required. Though this simplifies the risk outlook (NPLs are likely to come from several sources) it provides a benchmark for modelling risk across banks. The data for the 2008-9 banking crisis is complicated by the fact that banks had widely differing year-ends at the time, which the CBN later harmonised to 31 December. However, we have made adjustments to reach an annualised aggregate cost of risk during this period. How realistic is the COR history from 2009? A notable feature of the COR history was the apparent resurfacing of relatively high COR in 2011. This was in part due to the exceptionally large Zenon company loan which gave rise to NPLs at several banks in 2011 as well as new management teams at other banks that decided to clear backlogs of legacy NPLs. In addition, the COR data for the five banks that were taken under CBN control as a result of the last crisis (Intercontinental Bank, Oceanic Bank, Afribank, Spring Bank and Bank PHB) are not available, so the above table does not represent a true crisis-versus-crisis comparison. Will 2015 be a repeat of the 2009 crisis? We do not think that 2015 will be as severe as 2009. The worst NPLs of the 2008-9 crisis arose from margin lending, which was widespread, and from related-party lending. Soon after the crisis the CBN took measures to significantly restrict, where it did not actually outlaw, both practices. As a result we think it is unlikely that the stock market decline will, of itself, cause many NPLs in 2015. As for related-party lending, in 2009 the CBN required banks to provision fully for related-party loans, whether these were performing or not. This is one factor in our assessment that COR in 2015 may not reach the levels seen during the 2008-9 crisis. Reporting has significantly improved since 2009, with the introduction of IFRS, and banks now publishing on a regular basis not only breakdowns of Gross Loans but also breakdowns of NPLs by industry segment. However, good reporting is the not the same thing as good credit (although it is usually a precondition), so the prospect of high NPLs remains. The regulatory response The regulatory response is discussed in depth on pages 17-19. For the purposes of comparing 2009 with 2015 we note the differing fiscal situations. As the International Monetary Fund (IMF) puts it in the press release at the end of its annual mission (19 December 2004):
  • 5. Nigerian Banks Page 5 Equities CSL Stockbrokers is a division of FCMB (UK) Limited which is authorised by the Prudential Regulation Authority (PRA) and regulated by the Financial Conduct Authority (FCA) in the United Kingdom. . “However, fiscal and external buffers are low and there is less policy space for manoeuvring, compared to the onset of the 2008-9 financial crisis – the Excess Crude Account (ECA) was $21bn compared to $3bn now, while gross international reserves were $52bn.” The most recent reading for gross international reserves is US$34bn. In other words, we do not expect a fiscal stimulus to be even possible in 2015, while in 2009 a fiscal stimulus and specific liquidity measures from the CBN, and its generally accommodative stance, were key elements of the authorities’ management of the crisis. Another AMCON? Could there be another Asset Management Corporation of Nigeria (AMCON), a sort-of “AMCON 2” to deal with the upcoming crisis? We recall that banks already pay 0.5% of total assets per annum to fund AMCON, which was set up in 2010 to buy outstanding NPLs arising from the 2008-9, crisis. The answer to this question is that there already is such a mechanism, the CBN’s intervention fund to support loans to the power sector. The Power Sector Intervention Fund, announced in September 2014, is to be financed by the CBN in collaboration with deposit money banks. Beneficiary power companies are to be given a moratorium and repay loans over a 10 year period. However, funds such as these risk re-introducing liquidity into the banking system, creating precisely the danger the CBN addresses in the foreign exchange market. We therefore think that the CBN will be wary of creating a full-fledged “AMCON 2” to deal with upcoming NPLs.
  • 6. Nigerian Banks Page 6 Equities CSL Stockbrokers is a division of FCMB (UK) Limited which is authorised by the Prudential Regulation Authority (PRA) and regulated by the Financial Conduct Authority (FCA) in the United Kingdom. . Granularity – the roots of 2015’s NPLs The obvious place to look for NPLs in 2015 is the oil & gas sector because oil prices have declined from an average of US$98.2/bbl in 2014 to an average US$48.3/bbl year-to-date. In conversations with banks over the past few weeks we have learned that in upstream oil & gas their loans are predicated on economic models in which their customers earn US$50.00-70.00/bbl. Clearly, these stress tests are about to be put into practice. Yet the authorities, as well as banks themselves, believe that it will be possible to restructure loans – apparently with little effect on asset quality in the short term. Source: Companies, CSL Research. *GTB=Guaranty Trust Bank. Data is for 9M 2014 except for UBA and Guaranty Trust Bank where it is for H1 2014. Remarkably, (a huge improvement on 2009) almost all the banks disclose the NPL positions in their oil & gas NPLs. Source: Company, CSL Research estimates. *GTB=Guaranty Trust Bank. Data is for 9M 2014 except for Guaranty Trust Bank where it is for H1 2014. Concentration of risk: oil & gas sector loans 192% 53% 60% 87% 102% 132% 51% 65% 175% 0% 20% 40% 60% 80% 100% 120% 140% 160% 180% 200% Oil & Gas sector exposure as percentage of equity 40.0% 17.9% 16.0% 28.0% 24.7% 27.0% 17.0% 19.0% 33.7% 0.0% 5.0% 10.0% 15.0% 20.0% 25.0% 30.0% 35.0% 40.0% 45.0% 50.0% Oil & Gas sector exposure as percentage of gross loan book Percentage oil & gas loans that are NPLs 1.4% 1.6% 1.3% 3.6% 0.7% 2.5% 1.2% 0.7% 0.0% 1.0% 2.0% 3.0% 4.0% 5.0% FBNH Zenith Bank UBA GTB* Access Bank Diamond Bank Fidelity Bank Stanbic Bank Sterling Bank Oil & Gas sector NPL/Oil & Gas Loans
  • 7. Nigerian Banks Page 7 Equities CSL Stockbrokers is a division of FCMB (UK) Limited which is authorised by the Prudential Regulation Authority (PRA) and regulated by the Financial Conduct Authority (FCA) in the United Kingdom. . And from this we derive oil & gas NPLs as a percentage of Gross Loans. Source: Company, CSL Research estimates Clearly, this is historic information and, since most of it come from 9M 2014, before the most severe falls in oil prices, the NPL data shows only a very small part of the problem we expect to see in 2015. It is historic data and only an approximate guide to what is likely to happen next. Conclusions At this stage, however, we can identify the outliers as FBNH, Diamond Bank and Sterling Bank because of their overall risk exposures to oil & gas, to which we can add Access Bank because of its historic NPL level in the sector. The (un)available data also leaves a question mark over UBA. Sub-sectors Even if most of the oil & gas producers can escape problems servicing their loans, we doubt the same will be true of their suppliers, and we already hear reports of capital expenditure being cut and service contracts pared back or cancelled. We therefore expect the oil services sector to be negatively impacted. By contrast, we do not think downstream oil will be much affected, unless petroleum marketers have locked themselves into high crude oil prices at a time when prices at the pump are falling (this unfortunate arrangement has occurred in the past). But, generally, we rate oil price falls as good for petroleum marketers as subsidies fall and they become less dependent on government to reimburse them (government reimbursements are frequently late, in our understanding). Percentage of Gross Loans that are oil & gas NPLs 0.6% 0.3% 0.4% 0.9% 0.2% 0.4% 0.2% 0.2% 0.0% 0.2% 0.4% 0.6% 0.8% 1.0% FBNH Zenith Bank UBA GTB* Access Bank Diamond Bank Fidelity Bank Stanbic Bank Sterling Bank Oil & Gas sector NPL/Gross loans
  • 8. Nigerian Banks Page 8 Equities CSL Stockbrokers is a division of FCMB (UK) Limited which is authorised by the Prudential Regulation Authority (PRA) and regulated by the Financial Conduct Authority (FCA) in the United Kingdom. . Valuation histories Valuations of most Nigerian bank stocks (Stanbic IBTC is an important exception) are at multi-year lows. For the four largest banks (FBNH, Zenith Bank, UBA and Guaranty Trust Bank) we measure this in terms of both historic P/BV and Market Capitalisation/Deposits (Mt Cap/Deposits), and for others just historic P/BV. We take BV and Deposits at quarterly intervals 2010-Q3 2014 and use CSL 2014e BV and Deposits forecasts for the current period. Source: Bloomberg (prices), CSL Research FBNH trades at almost three standard deviations lower than its average historic P/BV over the past four years, and exactly two standard deviations lower than its average historic Mkt Cap/Deposits percentage valuation over the same period. Even if we take our target 2015e P/BV for FBNH of 0.8x (rather than the average 1.1x in the historical series above), the market is currently discounting a loss of half its 2014e equity during 2015e. Source: Bloomberg (prices), CSL Research Zenith Bank trades at 1.8 standard deviations lower than its average historic P/BV over the past four years, and 2.2 standard deviations lower than its Valuation history: FBNH 0.40 0.60 0.80 1.00 1.20 1.40 1.60 1.80 Jan-10 Jul-10 Dec-10 Jun-11 Dec-11 Jun-12 Dec-12 Jun-13 Dec-13 Jun-14 Dec-14 First Bank Historic P/BV Average -1SD +1SD 5% 10% 15% 20% 25% 30% 35% 40% 45% Jan-10 Jul-10 Dec-10 Jun-11 Dec-11 Jun-12 Dec-12 Jun-13 Dec-13 Jun-14 Dec-14 FBNH Mkt Cap/ Deposits Average -1SD +1SD Valuation history: Zenith Bank 0.70 0.90 1.10 1.30 1.50 1.70 1.90 Jan-10 Jul-10 Dec-10Jun-11Dec-11Jun-12Dec-12Jun-13Dec-13Jun-14Dec-14 Zenith Bank Historic P/BV Average -1SD +1SD 15% 20% 25% 30% 35% 40% 45% Jan-10 Jul-10 Dec-10 Jun-11 Dec-11 Jun-12 Dec-12 Jun-13 Dec-13 Jun-14 Dec-14 Mkt Cap/Deposits Average -1SD +1SD
  • 9. Nigerian Banks Page 9 Equities CSL Stockbrokers is a division of FCMB (UK) Limited which is authorised by the Prudential Regulation Authority (PRA) and regulated by the Financial Conduct Authority (FCA) in the United Kingdom. . average historic Mkt Cap/Deposits percentage valuation over the same period. The results for this study for Zenith Bank are less acute than for FBNH: Zenith Bank is better capitalised than FBNH, in our opinion, and is a much less volatile stock. Source: Bloomberg (prices), CSL Research UBA trades at 1.7 standard deviations lower than its average historic P/BV over the past four years, and 1.8 deviations lower than its average historic Mkt Cap/Deposits percentage over the same period. Source: Bloomberg (prices), CSL Research Guaranty Trust Bank trades at 1.2 standard deviations lower than its average historic P/BV over the past four years, and 1.6 standard deviations lower than its average historic Mkt Cap/Deposits percentage over the same period. Despite remarkably poor performance of the stock over the past three months – the stock is down 22% – it remains true that the market has not de-rated Guaranty Trust Bank to the same extent as other banks. Among the biggest four banks in Nigeria, FBNH appears to be the most over- sold in relation to its valuation history, followed by Zenith Bank, UBA and Guaranty Trust Bank. Valuation history: UBA 0.10 0.30 0.50 0.70 0.90 1.10 1.30 1.50 1.70 Jan-10 Jul-10 Dec-10 Jun-11 Dec-11 Jun-12 Dec-12 Jun-13 Dec-13 Jun-14 Dec-14 UBA Historic P/BV Average -1SD +1SD 0% 5% 10% 15% 20% 25% Jan-10 Jul-10 Dec-10 Jun-11 Dec-11 Jun-12 Dec-12 Jun-13 Dec-13 Jun-14 Dec-14 UBA Mkt Cap/Deposit Average -1SD +1SD Valuation history: Guaranty Trust Bank 0.30 0.80 1.30 1.80 2.30 2.80 3.30 Jan-10 Jul-10 Dec-10 Jun-11 Dec-11 Jun-12 Dec-12 Jun-13 Dec-13 Jun-14 Dec-14 GTB Historic P/BV Average -1SD +1SD 20% 30% 40% 50% 60% 70% 80% Jan-10 Jul-10 Dec-10 Jun-11 Dec-11 Jun-12 Dec-12 Jun-13 Dec-13 Jun-14 Dec-14 GTB Mkt Cap/Deposits Average -1SD +1SD
  • 10. Nigerian Banks Page 10 Equities CSL Stockbrokers is a division of FCMB (UK) Limited which is authorised by the Prudential Regulation Authority (PRA) and regulated by the Financial Conduct Authority (FCA) in the United Kingdom. . With the next four banks by balance sheet size we restrict our study to historic P/BV valuations. Source: Bloomberg (prices), CSL Research Access Bank trades at 2.4 standard deviations lower than its average historic P/BV over the past four years. While this is not as acute at FBNH’s discount, we also rate Access Bank as something of a special case. Even if we take our target 2015e P/BV for Access Bank of 0.7x (rather than the average 0.8x in the historical series above), the market is currently discounting a loss of about 30% of its 2014e equity during 2015e. Source: Bloomberg (prices), CSL Research Diamond Bank trades at 1.1 standard deviations lower than its average historic P/BV over the past four years. Valuation history: Access Bank 0.30 0.40 0.50 0.60 0.70 0.80 0.90 1.00 1.10 1.20 Jan-10 Jul-10 Dec-10 Jun-11 Dec-11 Jun-12 Dec-12 Jun-13 Dec-13 Jun-14 Dec-14 Access Bank Historic P/BV Average -1SD +1SD Valuation history: Diamond Bank 0.10 0.30 0.50 0.70 0.90 1.10 1.30 Jan-10 Jul-10 Dec-10 Jun-11 Dec-11 Jun-12 Dec-12 Jun-13 Dec-13 Jun-14 Dec-14 Diamond Bank Historic P/BV Average -1SD +1SD
  • 11. Nigerian Banks Page 11 Equities CSL Stockbrokers is a division of FCMB (UK) Limited which is authorised by the Prudential Regulation Authority (PRA) and regulated by the Financial Conduct Authority (FCA) in the United Kingdom. . Source: Bloomberg (prices), CSL Research Fidelity Bank trades at 1.8 standard deviations lower than its average historic P/BV over the past four years. Source: Bloomberg (prices), CSL Research In stark contrast to the trend in other Nigerian banks, Stanbic IBTC trades at 1.3 standard deviations above its average historic P/BV over the past four years. This is attributable to its status as an investment bank, with its revenues principally derived from asset management, wealth management, corporate financial advice, stockbroking and custody. The success of these business lines means that its Fee & Commission Income is expanding, almost reaching the level of its Net Interest Income. It is given a premium rating by the market. Valuation history: Fidelity Bank 0.10 0.20 0.30 0.40 0.50 0.60 0.70 0.80 Jan-10 Jul-10 Dec-10 Jun-11 Dec-11 Jun-12 Dec-12 Jun-13 Dec-13 Jun-14 Dec-14 Fidelity Bank Plc Average -1SD +1SD Valuation history: Stanbic IBTC 0.10 0.60 1.10 1.60 2.10 2.60 3.10 Jan-10 Jul-10 Dec-10 Jun-11 Dec-11 Jun-12 Dec-12 Jun-13 Dec-13 Jun-14 Dec-14 Stanbic Bank Historic P/BV Average -1SD +1SD
  • 12. Nigerian Banks Page 12 Equities CSL Stockbrokers is a division of FCMB (UK) Limited which is authorised by the Prudential Regulation Authority (PRA) and regulated by the Financial Conduct Authority (FCA) in the United Kingdom. . Source: Bloomberg (prices), CSL Research Company, CSL Research estimates Sterling Bank trades at 0.9 standard deviations lower than its average historic P/BV over the past four years. Conclusion The clear outliers in this study are FBNH, trading at 2.9 standard deviations lower that its average historic P/BV rating 2010-present, and Access Bank, trading at 2.4 standard deviations lower than its average historic P/BV rating 2010-present. Closer to their average historic P/BV ratings – but still significantly cheaper than average – are Guaranty Trust Bank, at 1.2 standard deviations lower; Diamond Bank at 1.1 standard deviations lower; and Sterling Bank at 0.9 standard deviations lower than their average historic P/BV ratings 2010-present. Stanbic IBTC is the exception, the only bank trading above its historic P/BV rating. This suggests that, should a post-election devaluation rally occur, which we think is likely, the shares of FBNH and Access Bank could be significantly more volatile than other bank stocks. Valuation history: Sterling Bank 0.10 0.30 0.50 0.70 0.90 1.10 1.30 1.50 1.70 1.90 Jan-10 Jul-10 Dec-10 Jun-11 Dec-11 Jun-12 Dec-12 Jun-13 Dec-13 Jun-14 Dec-14 Sterling Bank Historic P/BV Average -1SD +1SD
  • 13. Nigerian Banks Page 13 Equities CSL Stockbrokers is a division of FCMB (UK) Limited which is authorised by the Prudential Regulation Authority (PRA) and regulated by the Financial Conduct Authority (FCA) in the United Kingdom. . The naira – finding a floor at N220/US$1 If few investors believed that Nigeria could get away with an 8% devaluation in November 2014, when the oil price had fallen from US$110/bbl to US$78/bbl, even fewer believe it can hang on now that oil has slumped another 40% to just over US$45/bbl. The consensus is that it is only a matter of time before the naira is devalued again. In order to understand the impact of lower oil prices on the exchange rate, we have created simplified forecasts for Nigeria’s balance of payments over H1 2015. (Official data only exist to Q2 2014, so H2 2014 figures are also estimates.) The first and most obvious effect is a decline in export receipts from an average of US$23.6bn over the Q1 2011-Q2 2014 to roughly half that amount at present. Source: Central Bank of Nigeria, CSL estimates A weaker exchange rate may also cause a drop in imports, but the impact is unlikely to be dramatic, at least not compared to the fall in export revenues. In a relatively optimistic scenario, for example, a 10% devaluation of the nominal exchange rate would deliver a 4% contraction in imports. Given the 15% depreciation of the inter-bank FX rate from N162/US$ to 191/US$, the implied reduction of the import bill is 6%. This would save the country roughly US$800- 850m in FX reserves per quarter – a modest sum relative to lost export revenues of around US$11.0bn over the same period. Nigeria cannot hope to (re)balance its external accounts simply by making imports more expensive. The more significant changes on the imports side are likely to come from agricultural and industrial policies encouraging the substitution of imported goods for locally manufactured ones. Even before the recent crash in oil prices, these policies were beginning to bear fruit: Nigeria’s quarterly import bill has fallen from a high of US$4.8bn (on average) in 2011-2012 to US$3.7bn in 2013 and US$3.3bn in H1 2014. Although the official figures confirming this adjustment have yet to be published – the latest national ‘food balance sheets’ from the UN’s Food and Agriculture Organisation (FAO) date back to 2012, as do those from the Federal Ministry of Agriculture and Rural Development Nigeria balance of payments forecasts, US$m Q114 Q214 Q314e Q414e Q115f Q215f Current Account 4,591 1,545 3,389 -847 -1,893 -1,240 Goods (net) 9,258 8,355 7,666 3,099 1,096 1,750 Exports 22,733 23,054 21,596 16,089 12,533 12,533 Imports -13,475 -14,699 -13,930 -12,990 -11,437 -10,784 Crude Oil & Gas Imports -2,672 -4,014 -4,332 -3,968 -2,956 -2,303 Non-Oil Imports -10,803 -10,686 -9,598 -9,022 -8,481 -8,481 Services (net) -5,436 -6,400 -5,524 -5,192 -4,881 -4,881 Income (net) -4,658 -6,125 -4,296 -4,296 -3,652 -3,652 Current Transfers (net) 5,427 5,715 5,543 5,543 5,543 5,543 Capital & Financial Account (ex Reserves) -3,066 -861 -711 -711 -711 -711 Net Errors & Omissions -6,983 -754 -3,150 -2,347 -1,828 -1,828 Overall Balance -5,458 -70 -473 -3,905 -4,433 -3,779
  • 14. Nigerian Banks Page 14 Equities CSL Stockbrokers is a division of FCMB (UK) Limited which is authorised by the Prudential Regulation Authority (PRA) and regulated by the Financial Conduct Authority (FCA) in the United Kingdom. . (FMARD) – the Nigerian corporates in our network acknowledge that significant progress has been made. Source: Central Bank of Nigeria In the absence of these policies, imports would likely have grown in line with overall economic growth, creating demand for FX and putting even greater pressure on the naira. Now that a devaluation has occurred, their implementation appears all the more urgent. Elsewhere in the BOP, limited scope for adjustment Elsewhere in the balance of payments, the impact of lower oil prices and a weaker naira is difficult to predict, but unlikely to be great. Demand for services may experience a modest decline as prices rise, while current transfers, made up of remittances by Nigerians working abroad, will not be much affected, in our view. The income account, consisting mainly of dividend repatriations, is likely to fall in line with the depreciation of the FX rate, our assumption being that the naira-denominated profits of foreign-owned companies will be constant. The prospect of uplift in the financial account, driven by fresh portfolio inflows, is relatively small in our view. The catalysts for inflows over the past five years were the relaxation of the one-year holding period rule (July 2011) and more importantly Nigeria’s inclusion in the JP Morgan GBI-EM Index (announced August in 2012, effective from October 2012). Nigeria also offered very high nominal and real interest rates, at a time when the global search for yield was reaching a peak (the US Fed’s ‘QE3’ was announced in September 2012). The global environment is now much less conducive to large EM inflows. The Fed’s QE programme is over, EM growth is decelerating and general risk appetite has been dented by the crash of oil prices and various geopolitical crises. According to estimates from the Institute of International Finance (IIF), total non-resident flows to emerging markets fell by 20% last year with a further drop of 2% expected for this year. At the same time, the list of countries offering high nominal and real yields has multiplied (Brazil, Russia, Turkey, India, Venezuela, etc). Nigeria’s imports, US$m 0 2,000 4,000 6,000 8,000 Q109 Q309 Q110 Q310 Q111 Q311 Q112 Q312 Q113 Q313 Q114
  • 15. Nigerian Banks Page 15 Equities CSL Stockbrokers is a division of FCMB (UK) Limited which is authorised by the Prudential Regulation Authority (PRA) and regulated by the Financial Conduct Authority (FCA) in the United Kingdom. . We think it will be much harder for Nigeria to stand out in the current global environment, especially as elections approach and perceptions of its political and economic stability have been shaken. In fact, the challenge for Nigeria will be to remain in the JP Morgan GBI-EM index, for which it was recently placed on negative watch. At present, we estimate the total offshore positioning in the Nigerian bond market at US$7.9bn, about the double the amount implied by its current weight in the index. It is difficult to imagine that inflows could pick up from here. The only other significant change in the external accounts is likely to take place in the net errors and omissions line, which is normally a balancing item but in Nigeria’s case a proxy for informal imports and other ‘leakages’ (ie missing oil). Because the market value of any stolen oil is likely to have fallen in line with its international benchmark, the corresponding shortfall in the balance of payments should adjust too. The same logic applies to fuel subsidy fraud, historically a large contributor to FX demand. Now that the cost of delivering refined fuel (N90.64/litre, as of 23 January 2015) is close to the actual retail price (N87.00/litre), the incentive to exploit the subsidy regime has been greatly reduced. The collective impact of these adjustments, in our view, is an overall deficit in the balance of payments of US$8.2bn in the first two quarters of 2015. We think this is more than the CBN is willing to pay, and probably more than it is able to pay over a horizon longer than two quarters. Some (further) degree of FX depreciation must therefore be built into our forecasts. Toward a measure of ‘fair’ value The balance of payments projections give us some insight into the source and scale of pressure on the FX rate but they do not, on their own, tell us what may constitute a fair value for the naira. In order to assess the credibility of the CBN’s exchange rate policy we look at its own balance sheet, comparing liquid assets (FX reserves) to liquid liabilities (currency outstanding plus demand deposits). This tells us the level at which the CBN would be capable of converting outstanding liabilities into hard currency, if all cash and depositors rushed for the door today. According to data for end of December 2014, this rate had fallen to N183.00/US$, representing an 8% discount to the official rate of N168.00/US$. However, were it not for November’s MPR hike from 12.00% to 13.00%, we think that the dollarization rate would have been even weaker. (MPR hikes are implemented by OMO bill sales on behalf of the CBN, which turn cash and demand deposits into longer-term liabilities.)
  • 16. Nigerian Banks Page 16 Equities CSL Stockbrokers is a division of FCMB (UK) Limited which is authorised by the Prudential Regulation Authority (PRA) and regulated by the Financial Conduct Authority (FCA) in the United Kingdom. . Source: Central Bank of Nigeria, CSL Research A second method for establishing a currency’s relative value is the real effective exchange rate index, a measure based on inflation differentials weighted by trading partner. According to the relevant index compiled by the IMF, the naira was overvalued by 34% in real terms in October 2014, at which point its market rate was N165.00-166.00/US$. This implies a fair value in the region of N221.00-222.00/US$. Overall, our sense is that the CBN will continue to defend the naira at current levels until after elections, using both administrative measures to curtail demand for US$ dollars and sporadic interventions to meet shortfalls in supply. Over time, however, the gap between demand and supply is likely to be bridged by weakening the official exchange rate, especially if the oil price does not recover quickly. An initial step in this direction, in our view, would be a weakening of the official rate to bring the inter-bank rate within the targeted band of +/- 5%. Given a current inter-bank level of N189.42/US$ (29 January), the official rate would need to move to N182.00/US$. Inter-bank and ‘dollarisation’ rates, N/US$ 20 40 60 80 100 120 140 160 180 200 Jan-07 Jan-08 Jan-09 Jan-10 Jan-11 Jan-12 Jan-13 Jan-14 Inter-bank FX rate Dollarisation rate
  • 17. Nigerian Banks Page 17 Equities CSL Stockbrokers is a division of FCMB (UK) Limited which is authorised by the Prudential Regulation Authority (PRA) and regulated by the Financial Conduct Authority (FCA) in the United Kingdom. . The regulatory response In an environment of falling oil prices and rising pressure on the FX rate, there are questions about how the CBN will respond and what impact this will have on the profitability of the banking sector. The common assumption is that monetary policy will remain tight – the only question is whether this would be achieved via hikes in the benchmark interest rate or the cash reserve requirement. The former come at the expense of the CBN: the latter come at the expense of commercial banks. Source: Central Bank of Nigeria, CSL Research For most of the current era of high interest rates (starting in October 2011) the CBN has shouldered a disproportionate share of the burden of tight monetary policy, its outstanding OMO bills exceeding the level of statutory DMB reserves by a comfortable margin. However the balance looks to have swung in favour of the CBN after November’s CRR hike, which increased the level of statutory reserves by N533bn, sterilising liquidity that banks may have put to another purpose. The hope among investors was that the extra burden imposed on banks by CRR hikes would be accompanied by accommodation in a different form, especially once Governor Lamido Sanusi had been forced out. Current CBN Governor Godwin Emefiele, until recently a commercial banker himself, would see the logic of re-instating COT charges, ATM fees and other lines of revenue that enabled banks to diversify away from Net Interest Income, it was argued. This was the path successfully followed in several other emerging markets. The CBN’s view is in fact rather different: the message from our recent meetings there is that the banking sector must first learn to compete in traditional lending before they can be given handouts in the form of COT and ATM charges. In their view, the oligopolistic structure of Nigeria’s banking sector has undermined competition in traditional forms of lending, resulting in CBN OMO bills and DMBs’ required reserves, Nm 0 1,000 2,000 3,000 4,000 5,000 6,000 7,000 8,000 Jan-10 Sep-10 May-11 Jan-12 Sep-12 May-13 Jan-14 Sep-14 CBN OMO Bills Outstanding DMBs' Required Reserves
  • 18. Nigerian Banks Page 18 Equities CSL Stockbrokers is a division of FCMB (UK) Limited which is authorised by the Prudential Regulation Authority (PRA) and regulated by the Financial Conduct Authority (FCA) in the United Kingdom. . inflated profits for banks and unnecessarily high interest rates for the average user of capital. Although we do see the CBN’s point – spreads at Nigerian banks have historically been quite high – the gap has been closing, and is no longer out of step with global norms. Looking across a sample of EM economies shown in the chart below, Nigerian banks are far from the worst offenders. In fact, the ratio of Nigeria’s prime lending rate to policy rate is one of the lowest in sample, behind only China and Mexico, which have considerably deeper financial markets. Source: National central banks, Bloomberg, IMF Arguably the prime lending rate is available to only a small minority of bank customers, with the median lending rate actually much higher than the figures depicted here. It is common among colleagues in Lagos to hear of payday loans charging interest rates of 30%, or auto loans charging 28%. Diverging views on credit quality To the extent that we differ with the CBN on the benefits of accommodating banks, it is likely because we have a more bearish outlook on the sector’s profitability this year. In our recent discussions in Abuja, it was clear that the CBN found our baseline scenario, in which the cost of risk for the banks under our coverage rises to 4.5% this year, a little extreme. And to be fair, the CBN does have better access to information than most analysts and investors, including the ability to see sector exposures on a loan by loan basis with relevant term sheets. Yet we are not convinced that the CBN is acknowledging the full extent of macro prudential risks. One needs only think back to the summer of 2011 for an example of how a single NPL – to Zenon Petroleum, in this case – took on systemic importance, driving valuations across the sector down to historically low levels. At the time, the Zenon loan represented less than 1% of sector-wide Policy rates and prime lending rates, % 0.00 5.00 10.00 15.00 20.00 25.00 Poland Mexico Chile Malaysia Colombia China SouthAfrica Indonesia India Egypt Brazil Nigeria Russia Policy Rate, % Prime Lending Rate, %
  • 19. Nigerian Banks Page 19 Equities CSL Stockbrokers is a division of FCMB (UK) Limited which is authorised by the Prudential Regulation Authority (PRA) and regulated by the Financial Conduct Authority (FCA) in the United Kingdom. . assets, and about 6% of total shareholders’ equity, based on average values for the year. The most recent Financial Stability Report, published by the CBN in late 2014, does not appear to test the impact of FX rate weakness on credit quality. As discussed in our note on the banking sector at the end of last year (see 12 December 2014, CSL_Nigerian Banks and FX Devaluation) we are concerned about the impact of lower oil prices and a weakening exchange rate on the FX side of banks’ books. Although individual banks’ disclosures do not give us the full picture, using data from the CBN database we estimate total foreign currency loans at US$19.7bn, equal to 29% of total private sector loans and advances. While the majority of these loans are likely to have been made to the oil and gas sector, a sizable minority has gone to sectors with no real source of FX revenues, in our view. Source: Central Bank of Nigeria, CSL Research Our view on the potential impact of lower oil prices and a weakening exchange rate is corroborated by the outcome of stress tests conducted by the IMF in collaboration with CBN and commercial banks. One the scenarios modelled featured ‘multi-factor shocks’ in which the oil price dropped to US$50/bbl, the naira depreciated by 30% and the stock market fell 30%. The result was a 200% increase in banks’ aggregate NPLs, spread evenly across the major sectors which they finance. Working with data from Q3 2014, this would translate in a cost of risk of approximately 3.1% for 2015. Admittedly this is less than the 4.5% modelled in our base case scenario, but the oil price is now below US$50/bbl, the full extent of the necessary exchange rate adjustment is being delayed (in our view), and the stock market, while down 30% from the highs of 2014, may continue to slide. Moreover, as the IMF discloses in its note, data limitations mean that there was a subjective element to its conclusions. Nigerian banks’ FX assets and liabilities -8,000 -6,000 -4,000 -2,000 0 2,000 4,000 6,000 8,000 Jun-09 Mar-10 Dec-10 Sep-11 Jun-12 Mar-13 Dec-13 Sep-14 Foreign Assets (Placements with Banks Abroad) FX Loans (Implied) FX deposits Other foreign liabilities
  • 20. Nigerian Banks Page 20 Equities CSL Stockbrokers is a division of FCMB (UK) Limited which is authorised by the Prudential Regulation Authority (PRA) and regulated by the Financial Conduct Authority (FCA) in the United Kingdom. . Risks Risks to our investment thesis originate in costs of risk (COR) in 2015e and 2016e that might turn out to be higher than we forecast; falls in the value of the naira that might exceed what we forecast; the outcome of February’s general elections (which could be delayed) and possible threats to political stability thereafter; oil prices that might fall lower than the US$50.00-60.00/bbl that we benchmark; the threat from the terrorist group Boko Haram which could increase instability in the North East of Nigeria, and elsewhere, with negative consequences for politics, security and market conditions; a possible return of the Ebola outbreak to Nigeria; the possible inability of some banks to raise required capital – where required – in 2015; The Nigerian banking system last underwent major stresses in 2009 with a non-performing loan (NPL) crisis aggravated by a high level of margin lending and related-party lending. Since then, COR of the banks has improved gradually, following the CBN’s intervention that led to the purchase of bad loans through AMCON. Although recent headwinds are less likely to lead the banks back to 2009 COR levels, a higher than forecast COR could lead to greater declines in Net Profits than those we forecast here, and possibly losses, particularly in FY2015e. Losses incurred by the banks could potentially erode equity, leading to lower capital adequacy ratios and consequently, increased pressure to raise additional capital in future years. All the banks featured in this report, are significantly exposed to US dollar loans, and some of them have issued dollar denominated debt to augment regulatory capital. Further naira devaluation below the N220/US$1 we have forecast as a base could expose banks to significant additional risks. In the run-up to February 2015’s elections, the contest seems to be solely between President Goodluck Jonathan of the Peoples Democratic Party (PDP) and retired Major-General Mohammadu Buhari of the All Progressive Congress (APC). Competition between both the political candidates is likely to be stiffer than in previous elections, given changes in the political landscape since 2011’s elections. Although President Goodluck has the advantage of incumbency, the chances that Buhari could find himself democratically elected president are rising (Buhari was military Head of State 1983-5, and lost democratic presidential elections in 2003, 2007 and 2011). An outcome that seems to favour Buhari creates a lot of uncertainties for banks as a result of any political changes that might alter market and regulatory conditions. Although previous elections have been conducted in a generally peaceful manner, notably in 2011, there remains the risk of political violence around this time. Declining oil prices have put pressure on government revenues, and therefore the budget. A further decline in oil prices would have significantly negative effects on banks both directly (because government is a major customer) and indirectly (as spending levels in the economy would fall). NPLs could worsen to the point where banks’ COR exceed those modelled in this report.
  • 21. Nigerian Banks Page 21 Equities CSL Stockbrokers is a division of FCMB (UK) Limited which is authorised by the Prudential Regulation Authority (PRA) and regulated by the Financial Conduct Authority (FCA) in the United Kingdom. . The COR modelled in this report could be exceeded by the covered banks in 2015e and 2016e, even if our base case naira/US$ and oil price assumptions are attained, due to risk management factors that are not ascertainable at the time of writing. There has been a sharp increase in the intensity and number of attacks by the terrorist organisation Boko Haram group in the last month. Recent attacks by Boko Haram appear to be concentrated in the northern part of Nigeria’s North East, and generally contained within Yobe, Borno and Adamawa states. The next line of states towards central Nigeria (in a south-westerly direction) consists of Bauchi, Jigawa and Gombe. The pattern this year has been for very violent attacks (such as the destruction of the town of Baga in Borno State) in the far north rather than an expansion of the front line southwards. There is a risk of this violence escalating in a run-up to the 2015 elections and afterwards, and spreading outside northern Nigeria. Some banks might find it difficult to raise required capital in 2015. For banks that have communicated plans to raise tier-2 capital, the US dollar market for the subordinated debt of Nigerian banks seems unattractive at the moment. Even though Access Bank raised US$400m in 7-yr subordinated debt in June 2014 at a coupon of 9.25%, and FBN Holdings’ raised US$450m in 7-yr subordinated debt in July 2014 at coupon of 8.00%, banks might find it difficult if they came to the market now. The banks would have to contend with a sovereign yield that has been trending upwards recently. The naira subordinated debt market is an alternative which was accessed successfully in Q4 2014, though not so far this year. The outbreak of Ebola Virus Disease (EVD) in Nigeria has been contained, and Nigeria has been declared Ebola-free by the World Health Organization. However, a renewed outbreak cannot be ruled out.
  • 22. Nigerian Banks Page 22 Equities CSL Stockbrokers is a division of FCMB (UK) Limited which is authorised by the Prudential Regulation Authority (PRA) and regulated by the Financial Conduct Authority (FCA) in the United Kingdom. . Company sections 1) FBN Holdings 2) Zenith Bank 3) United Bank for Africa 4) Guaranty Trust Bank 5) Access Bank 6) Diamond Bank 7) Fidelity Bank 8) Stanbic IBTC 9) Sterling Bank NB Skye Bank, which is usually covered by CSL Research, is not covered in this report as we seek clarification of its purchase of Mainstreet Bank. We placed our recommendation on Skye Bank under review on 10 October 2014.
  • 23. Nigerian Banks Page 23 Equities CSL Stockbrokers is a division of FCMB (UK) Limited which is authorised by the Prudential Regulation Authority (PRA) and regulated by the Financial Conduct Authority (FCA) in the United Kingdom. . FBN Holdings Revision to estimates  We revise down our forecasts for FBN Holdings (FBNH) in light of recent policy changes by the Central Bank of Nigeria (CBN) and the expected impact of a further devaluation of the naira and of weak oil prices.  We model FBNH’s overall cost of risk (COR) rising in 2015e from our earlier-modelled 1.1% to 5.8%. We arrive at this increment by modelling the effect of a loss (effectively without collateral and therefore with 100% provision) of 11.7% of its US dollar loans.  These changes result is a reduction in our PBT forecast by 2.8% in 2014e, 98.7% in 2015e and by 12.6% in 2016e. We revise our price target down to N12.86/s from N14.70/s (current price N7.40), based on an implied 0.80x P/BV multiple to our FY2015e BVPS estimate. However, given recent price performance, we upgrade our recommendation from Hold to Buy.  In estimating FBNH’s COR for 2015e, we have assumed FBNH’s lending in US dollars to customers remains at FY 2013’s level of 37.4% of gross loans. We then assume that 11.7% of these loans become loss loans and would require 100.0% provisions, assuming no collateral collection. We estimate this would increase the bank’s COR to 5.8% from 1.1% modelled previously. FBNH, Nm 2014e Old 2014e New change 2015e Old 2015e New change 2016e Old 2016e New change Netinterestincome 242,316 228,469 -6% 276,142 261,327 -5% 315,562 279,031 -12% NetFee and Commission Income 60,822 55,342 -9% 65,994 57,956 -12% 50,343 50,840 1% Otherincome 14,880 29,989 102% 17,112 32,987 93% 19,679 36,286 84% Impairmentcharge (21,534) (21,827) 1% (23,723) (134,925) 469% (25,659) (25,997) 1% Costofrisk(COR) 1.1% 1.1% 0bps 1.1% 5.8% 470bps 1.0% 1.0% -1bps Operating expenses (201,657) (199,806) -1% (219,806) (215,791) -2% (237,390) (233,054) -2% PBT 94,826 92,164 -3% 115,718 1,554 -99% 122,534 107,106 -13% Tax (19,914) (19,354) -3% (24,301) (326) -99% (25,732) (22,492) -13% NetProfits 74,913 72,809 -3% 91,417 1,228 -99% 96,802 84,614 -13% Source: CSL estimates  We revise down our Net Interest Income forecasts by 6% in 2014e, 5% in 2015e and by 12% in 2016e to reflect the impact of the increase in the cash reserve requirement (CRR) on private sector deposits in November 2014 to 20% from 15%. Recommendation: Buy Target: N12.86 Price: N7.40 price as at 28 Jan 2015 Year to December, Nbn 2013 2014e 2015e 2016e Net Interest Income 230.1 228.5 261.3 279.0 Net profits 70.6 72.8 1.2 84.8 EPS, N 2.15 2.22 0.04 2.58 P/BV 0.5 0.5 0.5 0.4 PE 3.4 3.3 185.0 2.9 Div Yield (%) 14.9 7.2 0.0 13.9 Mkt. cap. N241.5bn (US$1.3bn) Free float 98.4% Bloomberg FBNH NL Reuters FBNH.LG Three-year graph 5 10 15 20 25 Jan-12 Jan-13 Jan-14 Jan-15 First Bank First Bank rel. to Nigeria All-Share Contact information Lagos: +234 (0)1 448 5436 Analyst: Gloria Obayagbo +234 (0)1 448 5436 Head of Research: Guy Czartoryski Sales: Temi Popoola, CFA +234 (0) 1 448 5420 ext. 4507 London: +44 (0) 20 7220 1041
  • 24. Nigerian Banks Page 24 Equities CSL Stockbrokers is a division of FCMB (UK) Limited which is authorised by the Prudential Regulation Authority (PRA) and regulated by the Financial Conduct Authority (FCA) in the United Kingdom. .  Though FBNH has made efforts to compensate for the CBN’s reduction in commission on turnover (COT) by increasing other fees and commission, Net Fees and Commission Income declined steeply in Q3 2014. which prompts us to reduce our forecasts of Net Fees and Commission by 9% for 2014e and by 12% for 2015e.  The bank has been working on initiatives to grow Non-Interest Income and has been quite successful, in our view. Other Income increased 97% over FY 2013 in 9M 2014. Consequently, we have upgraded our forecasts of Other Income over the forecast period.  The bank increased the pace of its loan growth in Q3 and has surpassed our FY loan growth forecast in 9M 2014, during which Net Loans were up 16%. Considering this, we have increased our loan growth estimate in 2014e to 18% from 15%. Considering capital concerns however, we revise down our loan growth forecasts to 10% for 2014e and 2015e, from 15% for both years.  According to management, the total capital adequacy ratio (CAR) of the bank post Basel II and after the US$450.0m in tier-2 capital raised, comes to about 16.2%. Though close to the regulatory minimum of 16.0% for systemically important banks (SIBs), of which FBNH is one, management maintains that there are no plans to raise capital in the short term. It plans to increase capital internally through profit retention and balance sheet restructuring e.g. sale or non-renewal of large institutional and corporate loans.  Considering this, we have reduced further our dividend pay-out forecast for FBNH to 24.0% from 48.0% in 2014e. Considering the fact that we forecast a significantly high Impairment Charge in 2015e which would remove almost all of the bank’s Net Profits, we do not expect any dividend payment in 2015e.  We revise down our price target to N12.86/s from N14.70/s previously. However, given recent price performance, we upgrade our recommendation from Hold to Buy. We arrive at our revised price target by applying an implied 0.8x P/BV multiple to our FY 2015e BVPS estimate of N15.50. Key inputs are a 20.0% cost of equity (COE) (which is based on a 13.0% risk-free rate and a 7.0% equity risk premium), 8.0% long term growth rate, and 18.0% long term sustainable RoAE.
  • 25. Nigerian Banks Page 25 Equities CSL Stockbrokers is a division of FCMB (UK) Limited which is authorised by the Prudential Regulation Authority (PRA) and regulated by the Financial Conduct Authority (FCA) in the United Kingdom. . FBNH Financials and ratios, Nm Income statement Nm 2010 2011 2012 2013 2014E 2015E 2016E Profitability ratios 2010 2011 2012 2013 2014E 2015E 2016E Totalinterestincome 175,579 212,975 295,353 323,621 329,630 373,886 407,541 Netinterestmargin 7.3% 8.8% 8.6% 8.0% 7.2% 8.0% 8.1% Interestexpense (53,912) (36,784) (68,746) (93,506) (101,162) (112,559) (128,509) Cost/incomeratio 76.2% 79.6% 67.2% 67.2% 68.4% 99.3% 68.5% Netinterestincome 121,667 176,191 226,607 230,115 228,469 261,327 279,031 Cost/incomeratioexprov. 67.0% 66.0% 64.6% 62.6% 63.7% 61.3% 63.6% Otherincome 11,406 -2,330 14,019 11,446 29,989 32,987 36,286 Pre-taxmargin 14.5% 12.6% 25.5% 22.8% 21.9% 0.3% 21.4% Profitbeforeprov. 178,062 221,445 300,575 295,646 313,799 352,270 366,157 RoAA 1.3% 0.7% 2.5% 2.0% 1.9% 0.0% 1.9% Provisions (21,590) (38,011) (12,549) (20,309) (21,827) (134,925) (25,733) RoAE 9.6% 5.0% 19.1% 15.5% 14.8% 0.2% 15.2% Totalopex (119,274) (146,064) (193,513) (185,006) (199,806) (215,791) (233,054) Cost/incomeratio 76.2% 79.6% 67.2% 67.2% 68.4% 99.3% 68.5% Asset quality ratios 2010 2011 2012 2013 2014E 2015E 2016E Cost/incomeratioexprov. 67% 66% 65% 63% 64% 61% 64% NPL/Totalloans 7.7% 2.6% 2.6% 3.0% 3.5% 5.0% 4.0% PBTbeforeexceptionalitems 33,541 37,370 94,513 90,332 92,164 1,554 107,370 Prov./Totalgrossloans 6.6% 2.6% 2.5% 2.5% 3.1% 8.1% 8.3% PBT 33,767 35,863 93,921 91,338 92,164 1,554 107,370 Taxation (4,590) (17,227) (17,031) (20,706) (19,354) (326) (22,548) Capitalratios 2010 2011 2012 2013 2014E 2014E 2016E Effectivetaxrate -13.6% -48.0% -18.1% 22.7% -21.0% -21.0% -21.0% Capitaladequacyratio 20.4% 22.2% 22.0% 22.0% 20.3% 21.5% 23.1% Minorityinterest(MI) 1,933 -884 -220 496 511 9 596 Leverage 6.8x 7.8x 7.4x 8.3x 8.1x 9.1x 8.7x PAT 29,177 18,636 76,890 70,632 72,809 1,228 84,822 EPS 0.95 0.54 2.37 2.15 2.22 0.04 2.58 Liquidity ratios 2010 2011 2012 2013 2014E 2014E 2016E DPS 0.60 0.80 1.00 1.10 0.53 0.00 1.03 Loan/Deposit 83.8% 65.9% 64.4% 60.4% 67.9% 70.6% 67.7% Payoutratio 0.63 1.47 0.42 0.51 0.24 0.00 0.40 Dividendsum 19,579 26,106 32,632 35,895 17,352 0 33,691 Growth - y/y 2010 2011 2012 2013 2014E 2014E 2016E Netinterestincome -5.1% 44.8% 28.6% 1.5% -0.7% 14.4% 6.8% Balance sheet (N millions) 2010 2011 2012 2013 2014E 2015E 2016E Otherincome 124.8% -120.4% -701.7% -18.4% 162.0% 10.0% 10.0% cashandshorttermfunds 75,517 199,228 300,532 594,234 604,918 766,569 1,071,230 Profitbeforeprov. 4.3% 24.4% 35.7% -1.6% 6.1% 12.3% 3.9% Duefrombanks&otherfin.inst. 550,414 462,856 439,853 430,586 515,763 567,339 624,073 Totalassets -7.1% 24.1% 12.9% 19.9% 6.0% 11.6% 14.2% Financialassetsheldfortrading 0 5,964 6,112 10,287 12,139 13,353 14,688 Dividendsum 406.3% 33.3% 25.0% 10.0% -51.7% -100.0% #DIV/0! Investmentsecurities 337,181 694,269 718,040 824,063 687,181 721,540 757,617 Loans&advances 4.6% 11.0% 23.1% 14.8% 18.0% 10.0% 10.0% Assetspledgedascollateral 0 72,129 50,109 53,650 72,964 80,260 88,286 NonPerformingLoans -1.5% -63.7% 23.2% 31.0% 38.9% 65.6% -11.8% Loans&advances 1,127,900 1,252,462 1,541,377 1,769,130 2,087,573 2,296,331 2,525,964 Totaldeposits 8.3% 34.6% 22.7% 22.3% 5.0% 15.0% 15.0% Advancesunderfinancelease 7,581 0 0 0 0 0 0 Totalliabilities 5.5% 26.8% 11.9% 22.0% 5.6% 13.4% 13.5% Otherassets 63,558 62,272 40,252 41,405 75,375 82,912 91,204 Shareholders'Funds 9.2% 8.7% 19.4% 6.5% 8.7% -0.7% 19.6% Propertyandequipment 53,998 65,874 75,407 81,299 86,177 89,050 92,018 Totalassets 2,304,686 2,860,119 3,228,384 3,871,001 4,102,319 4,579,109 5,228,706 Totaldeposits 1,450,095 1,951,321 2,395,148 2,929,081 3,075,535 3,536,865 4,067,395 otherliabilities 121,026 158,771 122,202 149,859 224,174 235,383 247,152 Totalliabilities 1,965,481 2,491,589 2,787,069 3,399,224 3,589,637 4,069,301 4,619,449 Shareholders'Funds 338,057 367,616 438,767 467,272 507,727 504,357 603,261 NonPerformingLoans 92,576 33,628 41,444 54,291 75,406 124,906 110,140 BVPS 10.4 11.3 13.4 14.3 15.6 15.5 18.5 Source: Company, CSL estimates
  • 26. Nigerian Banks Page 26 Equities CSL Stockbrokers is a division of FCMB (UK) Limited which is authorised by the Prudential Regulation Authority (PRA) and regulated by the Financial Conduct Authority (FCA) in the United Kingdom. . Zenith Bank Revision to estimates  We revise down our estimates for Zenith Bank based on recent changes in policies by the Central Bank of Nigeria (CBN) and on the expected impact of naira devaluation and weak oil prices on 2015e earnings.  We model Zenith Bank’s overall cost of risk (COR) rising in 2015e from our earlier-modelled 0.8% to 3.2%. We arrive at this increment by modelling the effect of a loss (effectively without collateral and therefore with 100% provisions) of 9.6% of its US dollar loans. By contrast, if 10.0% of its US dollar loans were to require 100% provisions in 2015e, then we would model an overall COR of 3.3%.  The overall effect of these changes is a reduction in our PBT forecasts by 7% in 2014e, 33% in 2015e, and by 8% in 2016e. We retain our Buy recommendation on Zenith Bank with a reduced price target of N24.6/s from N31.50/s (current price N17.02/s), based on an implied 1.3x P/BV multiple applied to our FY2015e BVPS estimate.  Zenith Bank’s customer lending in US dollars made up 23.2% of gross loans in 2013. In estimating the COR for 2015e, we have assumed the percentage of US dollar loans remains stable and that 9.6% of these loans become loss loans and, without collateral collection, would require 100.0% provisions. We estimate this would increase the bank’s COR to 3.2% from 0.8% modelled previously. We believe that Zenith Bank’s risk management capabilities are superior to those of most other Nigerian banks, and therefore our 9.6% US dollar loan default assumption reflects a relative degree of confidence on our part. Zenith Bank, Nm 2014e Old 2014e New change 2015e Old 2015e New change 2016e Old 2016e New change NetinterestIncome 200,877 190,090 -5% 228,225 221,031 -3% 253,982 243,483 -4% NetFee and Commission Income 55,482 46,612 -16% 47,479 45,722 -4% 39,010 31,993 -18% Other income 24,818 31,190 26% 26,599 33,472 26% 27,875 35,108 26% Impairmentcharge (11,594) (9,854) -15% (13,492) (55,809) 314% (15,516) (18,300) 18% Costofrisk (COR) 0.8% 0.7% -10bps 0.8% 2.0% 120bps 0.8% 0.9% 10bps Operating expenses (154,556) (151,612) -2% (165,375) (162,225) -2% (176,951) (173,580) -2% PBT 115,027 106,426 -7% 123,436 82,192 -33% 128,400 118,703 -8% Tax (19,555) (18,092) -7% (20,984) (13,973) -33% (21,828) (20,180) -8% NetProfits 95,473 88,333 -7% 102,452 68,219 -33% 106,572 98,524 -8% Source: CSL estimates  The CBN at its November 2014 Monetary Policy Committee (MPC) meeting increased the Cash Reserve Requirement (CRR) on private sector deposits from 15.0% to 20.0%. We expect this to strain the bank’s Interest Income in the last quarter of 2014, and subsequently. Consequently, we have reduced our Interest Income forecasts for 2014e Recommendation: Buy Target: N24.60 Price: N17.02 price as at 28 Jan Year to December, Nbn 2013 2014e 2015e 2016e Net Interest Income 189.3 190.1 221.0 243.5 Net profits 95.3 88.3 68.2 98.5 EPS, N 3.01 2.80 2.16 3.12 P/BV 1.1 1.0 0.9 0.8 PE 5.7 6.1 7.9 5.5 Div Yield (%) 10.3 7.1 5.5 8.4 Mkt. cap. N534.4bn (US$2.8bn) Free float 84% Bloomberg ZENITHBA NL Reuters ZENITHB.LG Three-year graph 10 15 20 25 30 Jan-12 Jan-13 Jan-14 Jan-15 Zenith Bnk share price Zenith Bnk rel. to Nigeria All-Share Contact information Lagos: +234 (0)1 448 5436 Analyst: Gloria Obayagbo +234 (0)1 448 5436 Head of Research: Guy Czartoryski Sales: Temi Popoola, CFA +234 (0)1 448 5420 ext. 4507 London: +44 (0) 20 7220 1041
  • 27. Nigerian Banks Page 27 Equities CSL Stockbrokers is a division of FCMB (UK) Limited which is authorised by the Prudential Regulation Authority (PRA) and regulated by the Financial Conduct Authority (FCA) in the United Kingdom. . by 6%, and for 2015e and 2016e by 4% in each year, and we have reduced our forecast Net Interest Income by 5% in 2014e, 3% in 2015e, and 4% in 2016e.  We have revised down our deposit growth forecast for 2014e to 5.0% from 10.0% due to the bank’s lacklustre deposit growth in 9M 2014 during which deposits were up only 1.4% on the year.  The bank’s Fee and Commission Income was declining quarterly through 9M 2014. We believe Zenith Bank is gradually beginning to feel the impact of the declining permitted commission on turnover COT (now 2 per mille). The bank previously did not suffer much from the reduction in COT to 3 per mille from 5 per mille in 2013, due to its high percentage of corporate clients which already had COT concessions at about 3 per mille. Based on this, we have revised down our Net Fees and Commissions Income estimate by 16% in 2014e, 4% in 2015e and by 18% in 2016e when COT, according to CBN regulations, will no longer be charged.  FX trading income helped increase Zenith Bank’s Other Income in 9M 2014. Though the CBN, in a circular released towards the end of 2014, reviewed downwards the daily foreign exchange trading position of individual authorised dealers to zero percent of shareholders’ funds from one percent previously, and only recently increased it slightly to 0.1%, we do not expect any significant impact on banks’ 2014e earnings considering the timing of the circular. The impact on 2015e earnings may be worse, depending on the CBN’s future measures, but we are of the view that the measure will be reviewed shortly. Consequently, we have increased our forecasts for Other Income by 26% through our forecast years.  We have also reviewed downwards our dividend pay-out expectations, considering the need for all banks to retain more capital than before in the light of the CBN’s capital requirements. Consequently, we have reduced our dividend pay-out ratio forecasts to 43% in 2014e, and 2015e, and 46% in 2016e from 59%, 57% and 58%, respectively.  The overall effect of these and other minor changes to our estimates is a reduction in our PBT forecasts by 7% for 2014e, 33% for 2015e and by 8% for 2016e. We maintain our Buy rating on Zenith Bank with a revised price target of N24.6/s. Our price target is derived by applying an implied 1.3x P/BV multiple to our FY2015e BVPS estimates of N18.5. Key inputs to our model are a 24.0% long-term sustainable ROE, a 19.9% COE and an 8.0% long term growth rate.
  • 28. Nigerian Banks Page 28 Equities CSL Stockbrokers is a division of FCMB (UK) Limited which is authorised by the Prudential Regulation Authority (PRA) and regulated by the Financial Conduct Authority (FCA) in the United Kingdom. . Zenith Bank Financials and ratios Nm Income statement Nm 2011 2012 2013 2014E 2015E 2016E Profitability ratios 2011 2012 2013 2014E 2015E 2016E Interestincome 163,192 221,318 260,059 281,877 322,211 354,833 Netinterestmargin 7.8% 8.2% 8.5% 7.4% 7.7% 7.7% Interestexpense (34,906) (64,561) (70,796) (91,787) (101,180) (111,351) Cost/incomeratio 65% 54.0% 57% 59% 66% 59% Netinterestincome 128,286 156,757 189,263 190,090 221,031 243,483 Cost/incomeratioexprov. 59% 52% 56% 57% 54% 56% Otherbankingincome 67,259 70,553 75,209 77,801 79,195 67,101 Pre-taxmargin 25.9% 33.6% 31.5% 29.6% 20.5% 28.1% Profitbeforeprovisions 195,545 227,310 264,472 267,892 300,225 310,584 RoAA 2.3% 4.1% 3.3% 2.7% 1.9% 2.5% Loanloss &otherprovision (16,514) (9,099) (11,067) (9,854) (55,809) (18,300) RoAE(adj.) 12.9% 23.4% 19.6% 16.9% 12.1% 15.9% Operatingexpenses (115,918) (118,560) (147,196) (151,612) (162,225) (173,580) cost-toasset -5.5% -4.8% -5.1% -4.6% -4.5% -4.4% Cost/incomeratio 64.7% 53.5% 57.1% 58.8% 66.4% 59.4% Cost/incomeratioexprov. 59.3% 52.2% 55.7% 56.6% 54.0% 55.9% Asset quality ratios 2011 2012 2013 2014E 2015E 2016E PBTfrom continued&discope 63,113 103,159 110,597 106,426 82,192 118,703 NPL/Totalloans 4.1% 3.1% 2.9% 3.5% 3.5% 3.5% Taxation (17,261) (1,419) (15,279) (18,092) (13,973) (20,180) Provisions/Totalgross loans 2.9% 2.4% 1.9% 2.2% 4.8% 5.0% Effectivetaxrate -27% 1% 14% 17% 17% 17% PAT 48,704 101,740 95,318 88,333 68,219 98,524 MinorityInterest (281) (534) 742 (534) (534) (534) Capital ratios 2011 2012 2013 2014E 2015E 2016E EPS(reported) 1.54 3.22 3.01 2.80 2.16 3.12 Leverage 5.9x 5.7x 6.2x 6.4x 6.5x 6.4x DPS 0.95 1.60 1.75 1.20 0.92 1.43 Payoutratio 62% 50% 58% 43% 43% 46% Dividendsum 29,827 49,399 54,854 37,542 28,993 44,828 Liquidity ratios 2011 2012 2013 2014E 2015E 2016E WeightedAve.ShareCount 31,396 31,396 31,396 31,396 31,396 31,396 Loans/Deposit 54% 51% 55% 65% 68% 70% Balance Nm 2011 2012 2013 2014E 2015E 2016E Cash&balances withtheCBN 223,187 332,515 603,851 657,775 693,436 804,413 Otherassets 25,510 28,665 36,238 63,417 66,587 69,917 Growth - y/y 2011 2012 2013 2014E 2015E 2016E Deferredtaxassets 186 432 749 936 1,077 1,238 Netinterestincome 40% 22% 21% 0% 16% 10% Investmentsecurities 308,231 299,343 303,125 341,016 366,592 384,921 Otherbankingincome 11% 5% 7% 3% 2% -15% Fixedassets (PP&E) 68,366 68,782 69,410 75,194 78,954 82,902 Profitbeforeprovisions 29% 16% 16% 1% 12% 3% Totalassets 2,326,695 2,604,504 3,143,133 3,468,625 3,773,576 4,204,850 Operatingexpenses 19% 2% 24% 3% 7% 7% Customerdeposits 1,655,458 1,929,244 2,276,755 2,390,593 2,629,652 2,945,210 PBTafterex.Items 26% 63% 7% -4% -23% 44% Otherliabilities 152,836 117,355 215,643 226,425 249,068 278,956 PAT 30% 109% -6% -7% -23% 44% Taxation 13,348 6,577 7,017 7,134 7,372 7,667 EPS(adjusted) 30% 109% -5% -9% -23% 45% Deferredtaxation 10,742 5,584 678 689 712 741 Dividendsum 12% 66% 11% -32% -23% 55% Longterm liabilities/borrowings 21,070 15,138 60,150 205,953 205,953 205,953 Loans &advances 23% 11% 26% 25% 15% 15% Totalliabilities 1,932,427 2,141,548 2,633,882 2,922,970 3,189,542 3,541,118 NonPerformingLoans (NPL) -15% -15% 16% 51% 18% 15% Shareholders'Funds 391,582 459,684 505,236 542,383 580,761 660,458 Customerdeposits 26% 17% 18% 5% 10% 12% MinorityInterest 2,686 3,272 4,015 3,272 3,273 3,274 Totalassets 23% 12% 21% 10% 9% 11% NonPerformingLoans (NPL) 37,730 31,930 37,135 55,959 66,124 76,208 Totalliabilities 26% 11% 23% 11% 9% 11% BVPS 12.5 14.6 16.1 17.3 18.5 21.0 Shareholders'Funds 8% 17% 10% 7% 7% 14% Source: Company, CSL estimates
  • 29. Nigerian Banks Page 29 Equities CSL Stockbrokers is a division of FCMB (UK) Limited which is authorised by the Prudential Regulation Authority (PRA) and regulated by the Financial Conduct Authority (FCA) in the United Kingdom. . United Bank for Africa Revision to estimates  The effects of currency devaluation and falling oil prices prompt us to revise our forecasts for United Bank for Africa (UBA).  We model UBA’s overall cost of risk (COR) rising in 2015e from our earlier-modelled 1.5% to 5.2%. We arrive at this increment by modelling the effect of a loss (effectively without collateral and therefore with 100% provision) of 13.0% of its US dollar loans.  The overall effect of these changes is a reduction in our PBT forecast by 10% in 2014e, 70% in 2015e, and 9% in 2016e. Also, we expect 8% dilution to 2015e EPS as a result of the one-for-ten rights issue which is underway. We change our recommendation from Hold to Buy, though we reduce our target price to N5.70/s from N7.40x/s (current price N3.53/s), based on a 0.72x implied P/BV multiple to our FY2015e BVPS estimate.  UBA’s US dollar lending as at FY 2013 made up 29.0% of its loan book. In estimating COR for 2015e, we have assumed the percentage of US dollar loans remains stable in 2015e and that 10.0% of these loans become loss loans and, without collateral collection, would require 100% provision.  In terms of impact on earnings, at this stage, we find that the projected increase in cost of risk (COR) in 2015e can be absorbed by earnings. The increase in COR results in a 70% reduction in our forecast of UBA’s 2015e PBT. United Bank for Africa, Nm 2014e Old 2014e New change 2015e Old2015e New change 2016e Old 2016e New change Net interest income 125,195 112,296 -10% 143,443 132,095 -8% 166,914 146,734 -12% Net Fee and Commission Income 41,152 48,239 17% 41,688 46,227 11% 41,748 51,376 23% Other income 71,142 73,982 4% 73,896 73,550 0% 76,349 80,388 5% Impairment Charge (16,268) (9,952) -39% (18,572) (56,429) 204% (22,109) (21,066) -5% Cost of risk (COR) 1.5% 1.5% 0bps 1.5% 5.2% 370bps 1.5% 1.7% 20bps Operating expenses (120,793) (123,064) 2% (134,080) (129,653) -3% (147,488) (139,121) -6% PBT 59,276 53,261 -10% 64,687 19,564 -70% 73,664 66,935 -9% Tax (10,077) (10,652) 6% (10,997) (3,913) -64% (12,523) (13,387) 7% Net profits 49,199 42,609 -13% 53,690 15,651 -71% 61,142 53,548 -12% Source: CSL estimates  As at 9M 2014 UBA’s Loans and Advances were up 5.7% which was much slower than the aggressive 42.3% loan growth seen in FY 2013. This, we believe, was a deliberate effort to restrict risk asset growth due to capital constraints. Consequently, we have revised down our 2014e loan growth forecast to 10.0% from 20.0%, and to 10.0% from 18.0% in 2015e. Recommendation: Buy Target: N5.70 Price: N3.53 price as at 28 Jan Year to December, Nbn 2013 2014e 2015e 2016e Net Interest Income 103.2 112.3 132.1 146.7 Operating Income 177.0 186.3 205.6 227.1 Net profits 46.6 42.6 15.7 53.5 EPS, N 1.41 1.29 0.44 1.48 P/BV (x) 0.50 0.44 0.44 0.40 PE (x) 2.5 2.7 8.0 2.4 Div Yield (%) 14.2 11.3 4.0 17.0 Mkt. cap. N116.4bn (US$629.3m) Free float 83% Bloomberg UBA NL Reuters UBA.LG Three-year graph 0 3 6 9 12 Jul-11 Jul-12 Jul-13 Jul-14 UBA share price UBA rel. to Nigeria All-Share Contact information Lagos: +234 (0)1 448 5436 Analyst: Sade Obilomo +234 (0)1 448 5436 Head of Research: Guy Czartoryski Sales: Temi Popoola, CFA +234 (0) 1 448 5420 ext.4507 London: +44 (0) 20 7220 1041
  • 30. Nigerian Banks Page 30 Equities CSL Stockbrokers is a division of FCMB (UK) Limited which is authorised by the Prudential Regulation Authority (PRA) and regulated by the Financial Conduct Authority (FCA) in the United Kingdom. .  We have also revised down our FY 2014e deposit growth forecast to 1.0% from 15.0% previously. As at 9M 2014, UBA’s customer deposits were down 3.0% relative to FY 2013. This, according to management, was as a result of a strategic effort to improve the deposit mix and ease funding costs.  At the last Monetary Policy Committee (MPC) meeting, the Central Bank of Nigeria (CBN) raised the cash reserve requirement (CRR) on private sector deposits to 20% from 15%. With continued competitive pressure in the banking sector, we expect to see an increase in funding costs leading to some margin compression. Hence, we have modelled a slight increase in UBA’s cost of funds (COF) to 3.8% from 3.6% in 2014e, and to 3.7% from 3.5% in 2015e.  We believe UBA, like most other Nigerian banks, will prioritise retaining earnings to conserve capital given expectations of further tightening in the sector. As a result, we have reduced our forecast of UBA’s dividend pay-out ratio to 31% from 34% in 2014e, and to 34% from 40% in 2015e.  The overall effect of these changes to our forecasts is to decrease our PBT forecasts by 70% in 2015e, and 9% in 2016e. The decline in PBT and increase in book value from the rights issue leads us to model a RoAE of 5.7% in 2015e, relative to our previous forecast of 19.3%.  In terms of dilution from the rights issue, we estimate 8% dilution to 2015e earnings per share (EPS) assuming a weighted average number of shares in issue of 35.5bn up from 32.9bn in 2014.  We upgrade our recommendation on UBA from Hold to Buy, but revise our target price downwards to N5.70/s. We arrive at our target price by applying an implied 0.72x P/BV multiple to our 2015 BVPS estimates of N8.0. Key inputs to our valuation include 18.0% sustainable RoAE, an 8.0% long term growth rate and a 22.0% COE based on a risk free rate of 13.0% equal to the recent yield on the Federal Government’s 10-year bond, a beta of 1.28 and an equity risk premium of 7.0%.
  • 31. Nigerian Banks Page 31 Equities CSL Stockbrokers is a division of FCMB (UK) Limited which is authorised by the Prudential Regulation Authority (PRA) and regulated by the Financial Conduct Authority (FCA) in the United Kingdom. . Capital Adequacy While UBA's total capital adequacy ratio was at a comfortable level of 21% as at H1 2014, a significant portion of its capital is funded through subordinated debt, which puts the bank’s Tier II capital above the new CBN’s regulatory limits, according to the most recent CBN circular which limits the level of Tier II capital to 33% of Tier I, or 25% of total equity. In response to this regulation, the bank has commenced a rights issue of one for ten shares at N4.0/s. We expect this issue to add an additional N13.2billion ($67.7m) in equity capital if all the new shares are subscribed at N4.0/s. This, according to our CAR model, and after reducing our forecast dividend pay-out in 2014e to 32%, puts UBA’s Tier I and Tier II ratio just at the regulatory minimum. Total Capital Adequacy Ratio (CAR) model (post rights issue) 2009 2010 2011 2012 2013 2014e 2015e 2016e 2017e 2018e Tier 1 capital Ordinary share capital 10,778 12,934 16,168 16,491 16,491 16,491 18,140 18,140 18,140 18,140 Share premium 113,645 111,489 108,255 107,932 107,932 107,932 119,475 119,475 119,475 119,475 Retained earnings 18,317 16,504 16,034 49,572 70,480 93,505 101,845 125,593 163,366 203,568 Translation reserve 1,607 (1,514) (3,153) Other reserves 25,491 25,816 5,281 16,625 35,878 39,137 41,485 49,517 60,665 72,881 Non-controlling interests 3,595 3,361 7,387 7,387 7,387 7,387 7,387 7,387 Subtractions (1) (3,479) (13,597) (25,411) (18,584) (31,839) (31,839) (31,839) (31,839) (31,839) (31,839) Total qualifying Tier 1 capital 164,752 153,146 125,529 173,883 203,176 232,613 256,493 288,273 337,194 389,612 Tier 2 capital Fair value reserve for AFS and FA 11,231 11,231 11,460 15,223 24,452 24,452 24,452 24,452 24,452 24,452 Debenture stock 18,851 53,500 53,719 55,653 54,045 54,045 54,045 54,045 54,045 Collective allowances for impairment 11,322 10,358 14,750 0 Non-controlling interests 2,967 2,897 3,595 3,361 7,387 7,387 7,387 7,387 7,387 7,387 Other reserves 4,400 -1,445 Total Tier 2 Capital 18,598 31,534 79,877 82,661 102,242 85,884 85,884 85,884 85,884 85,884 % Tier 2/Tier 1 capital** 11% 21% 64% 48% 50% 37% 33% 30% 25% 22% Total regulatory capital 183,350 184,680 205,406 256,544 305,418 318,497 342,377 374,157 423,078 475,496 Total risk-weighted assets 1,071,694 1,071,694 945,279 1,091,824 1,352,161 1,617,985 1,736,609 1,951,406 2,162,839 2,403,442 Capital Adequacy Ratio 17.1% 17.2% 21.7% 23.5% 22.6% 19.7% 19.7% 19.2% 19.6% 19.8% Operational risk estimate using BIA 114,522 98,074 85,635 80,631 90,296 108,851 118,524 128,968 142,123 155,298 Basel II Capital Adequacy Ratio 15.5% 15.8% 19.9% 21.9% 21.2% 18.4% 18.5% 18.0% 18.4% 18.6% Source: Company, CSL Research. *Under Basel II implementation Collective Impairment Provisions may not be used as part of tier-2 equity. **Under Basel II implementation, tier-2 equity may not exceed either 33% or 25% (according to interpretation) of tier-1. (1) Investment in subsidiaries, deferred tax and intangible assets. (2) Principal amounts approved by the CBN
  • 32. Nigerian Banks Page 32 Equities CSL Stockbrokers is a division of FCMB (UK) Limited which is authorised by the Prudential Regulation Authority (PRA) and regulated by the Financial Conduct Authority (FCA) in the United Kingdom. . United Bank for Africa’s financials and ratios, Nm Income statement 2011 2012 2013 2014E 2015E 2016E Profitability ratios 2011 2012 2013 2014E 2015E 2016E Interestincome 113,590 150,003 185,700 202,348 224,702 247,492 Netinterestmargin 4.7% 5.9% 5.8% 5.8% 6.2% 6.2% Interestexpense (45,423) (58,386) (82,469) (90,052) (92,606) (100,758) Cost/incomeratioUBA 96.0% 66.8% 65.8% 69.8% 86.9% 67.5% Netinterestincome 68,167 91,617 103,231 112,296 132,095 146,734 Cost/incomeratioex prov. 82.7% 64.8% 60.9% 63.0% 61.3% 59.9% Netimpairmentloss onloans &rec. (17,738) (4,560) (13,078) (9,952) (56,429) (21,066) Pre-tax margin(preexceptionals) -5.5% 23.9% 21.2% 18.9% 6.4% 19.9% Netinterestincomeafter impairment 50,429 87,057 90,153 102,344 75,666 125,668 RoAA -0.5% 2.6% 1.9% 1.6% 0.5% 1.7% Other bankingincome 48,937 67,599 73,762 73,982 73,550 80,388 RoAE -5.3% 32.2% 22.3% 17.1% 5.7% 17.6% Operatingexpenses (106,104) (102,592) (107,851) (123,064) (129,653) (139,121) Cost-to-assets 6.0% 4.9% 4.4% 4.6% 4.5% 4.5% Cost/incomeratio 106.8% 66.3% 65.8% 69.8% 86.9% 67.5% Cost/incomeratioex prov. 90.6% 64.4% 60.9% 66.1% 63.0% 61.3% PBTpreexceptionals (26,600) 52,010 56,058 53,261 19,564 66,935 Asset quality ratios 2011 2012 2013 2014E 2015E 2016E PBTpostexceptionals (26,600) 52,010 56,058 53,261 19,564 66,935 NPL/Totalloans 2.7% 2.0% 1.2% 2.0% 2.5% 2.5% EffectiveTax rate 67% -1% -17% -20% -20% -20% PAT (6,801) 54,766 46,601 42,609 15,651 53,548 Capital ratios 2011 2012 2013 2014E 2015E 2016E Minority interest 850 224 257 244 90 307 Leverageratio 12.7x 11.8x 11.2x 10.4x 10.3x 10.2x EPS(reported) -0.23 1.66 1.41 1.29 0.44 1.48 DPS 0.00 0.50 0.50 0.40 0.14 0.60 Liquidity ratios 2011 2012 2013 2014E 2015E 2016E Payoutratio 0% 30% 35% 31% 32% 41% Loans/Deposit 44% 39% 44% 47% 46% 49% Dividendsum 0 16,491 16,491 13,193 4,964 21,768 WeightedAve.ShareCount 32,335 32,981 32,981 32,981 35,455 36,280 Growth - y/y 2011 2012 2013 2014E 2015E 2016E NIIpreprovisions -4% 34% 13% 9% 18% 11% Other income -3% -74% 187% -24% 467% -63% Balance sheet 2011 2012 2013 2014E 2015E 2016E Profitbeforetax -18% 38% 9% 0% -1% 9% Cashandbankbalances 434,218 714,115 716,803 745,000 780,000 810,000 Operatingexpenses 2% -3% 5% 14% 5% 7% Shorttermfunds(Treasury bills) 69,390 179,815 PBTpreexceptionals -426% -296% 8% -5% -63% 242% Loans andadvances tobanks 41,564 28,513 26,251 21,251 27,251 32,251 PBTpostexceptionals -926% -296% 8% -5% -63% 242% Investmentsecurities 722,308 611,427 631,391 823,206 873,206 923,206 PATbeforemin.Interest -1549% -694% -9% -9% -63% 242% Loans andadvances tocustomers 605,627 658,922 937,620 1,012,109 1,113,185 1,315,136 Profit/loss for theyear -1118% -905% -15% -9% -63% 242% Other assets 61,100 119,810 75,007 82,007 93,961 100,801 EPS(adjusted) -991% -822% -15% -9% -66% 234% Property andequipment 55,618 70,746 75,409 77,368 78,827 80,736 DPS -100% 0% 0% -20% -65% 329% Totalassets 1,920,435 2,272,923 2,642,296 2,760,941 2,966,431 3,262,130 Loans &advances -4% 9% 42% 8% 10% 18% Deposits fromcustomers 1,445,822 1,720,008 2,161,182 2,182,794 2,466,557 2,713,213 NonPerformingLoans -72% -21% -15% 80% 38% 18% Totalliabilities 1,769,495 2,080,456 2,407,260 2,496,489 2,678,098 2,942,018 Deposits &currentaccounts 14% 19% 26% 1% 13% 10% Shareholders Funds 147,345 189,106 227,649 257,065 280,945 312,725 Totalassets 19% 18% 16% 4% 7% 10% Minority Interest 3,595 3,361 7,387 7,387 7,387 7,387 Totalliabilities 23% 18% 16% 4% 7% 10% NonPerformingLoans 16,936 13,439 11,483 20,670 28,421 33,537 Shareholders Funds -16% 28% 22% 13% 9% 11% BVPS 4.7 5.8 7.1 8.0 7.9 8.8 Source: Company, CSL estimates
  • 33. Nigerian Banks Page 33 Equities CSL Stockbrokers is a division of FCMB (UK) Limited which is authorised by the Prudential Regulation Authority (PRA) and regulated by the Financial Conduct Authority (FCA) in the United Kingdom. . Guaranty Trust Bank Revision to estimates  We revise down our estimates for Guaranty Trust Bank (GTB) based on recent measures taken by the Central Bank of Nigeria (CBN) and the expected impact of naira devaluation and of weak oil prices on 2015e earnings.  We model GTB’s overall cost of risk (COR) rising in 2015e from our earlier-modelled 0.5% to 3.2%. We arrive at this increment by modelling the effect of a loss (effectively without collateral and therefore with 100% provision) of 6.4% of its US dollar loans. By contrast, if 10.0% of its US dollar loans were to require 100% provisions in 2015e, then we would model an overall COR of 4.7%.  These changes result in a reduction in our PBT forecasts by 13% in 2014e, by 42% in 2015e and by 22% in 2016e. We retain our Buy recommendation on GTB with a reduced price target of N28.42/s from N39.80/share (current price N20.87/s), based on an implied 2.1x P/BV multiple applied to our FY2015e BVPS estimates of N13.8.  As at FY 2013, GTB’s US dollar loans made up 38.8% of gross loans. Assuming the proportion of US dollar loans to be stable, we estimate that 6.4% of these loans will become loss loans in 2015e based on the expected impact of naira devaluation and of weak oil prices, and would require a 100% provision (assuming no collateral). This results in N35.9bn in additional provisions in our model for 2015e, implying an increase in cost of risk (COR) to 3.2% from 0.5% modelled previously. Our 6.4% US dollar loans default assumption reflects our positive perception of GTB’s risk management framework relative to other Nigerian banks. Source: CSL estimates  We revise down our Net Interest Income forecasts by 15% in 2014e, 19% in 2015e and by 21% in 2016e, in part to reflect the impact of the increase Guaranty Trust Bank Nm 2014e Old 2014e New change 2015e Old 2015e New change 2016e Old 2016e New change NetInterestIncome 160,753 136,779 -15% 188,278 151,896 -19% 223,212 175,546 -21% NetFee and Commission Income 42,567 49,562 16% 38,051 44,346 17% 31,979 32,252 1% Otherincome 15,537 17,007 9% 18,645 20,408 9% 22,374 24,490 9% Impairmentcharge (5,563) (7,947) 43% (7,097) (42,383) 497% (9,770) (10,882) 11% Costofrisk(COR) 0.5% 0.7% 21bps 0.5% 3.2% 270bps 0.6% 0.7% 11bps Operating expenses (93,268) (90,792) -3% (105,393) (98,055) -7% (119,094) (105,899) -11% PBT 120,027 104,609 -13% 132,484 76,213 -42% 148,702 115,507 -22% Tax (21,605) (17,784) -18% (23,847) (12,956) -46% (26,766) (19,636) -27% NetProfits 98,422 86,826 -12% 108,637 63,257 -42% 121,935 95,871 -21% Recommendation: Buy Target: N28.42 Price: N20.87 price as at 28 Jan Year to December, Nbn 2013 2014e 2015e 2016e Net Interest Income 136.9 136.8 151.9 175.5 Net profits 90.0 86.8 63.3 95.9 EPS, N 3.19 2.95 2.15 3.26 P/BV 1.8 1.6 1.5 1.3 PE 6.5 7.1 9.7 6.4 Div Yield (%) 8.4 7.1 5.1 8.6 Mkt. cap. N589.8bn ($3.2bn) Free float 99.8% Bloomberg GUARANTY NL Reuters GUARANT.LG Three-year graph 10 20 30 40 Jan-12 Jan-13 Jan-14 Jan-15 GT Bank share price GT Bank rel. to Nigeria All-Share Contact information Lagos: +234 (0)1 448 5436 Analyst: Gloria Obayagbo +234 (0)1 448 5436 Head of Research: Guy Czartoryski Sales: Temi Popoola, CFA +234 (0) 1 448 5420 ext/ 4507 London: +44 (0) 20 7220 1041
  • 34. Nigerian Banks Page 34 Equities CSL Stockbrokers is a division of FCMB (UK) Limited which is authorised by the Prudential Regulation Authority (PRA) and regulated by the Financial Conduct Authority (FCA) in the United Kingdom. . in cash reserve requirement (CRR) on private sector deposits from 15% to 20% in November 2014.  GTB has been quite successful in compensating for the reduction in permissible commission on turnover (COT) to 2 per mille in 2014 from 3 per mille in 2013, by an increase in Other Fees and Commissions. Consequently, we increase our Net Fees and Commission Income forecasts by 16% in 2014e and by 17% in 2015e.  The bank’s Impairment Charge rose significantly in H1 2014. This, according to management, was due to a cautionary provision taken on Lister Flour Mills Nigeria Ltd in Q2. Based on this, we have increased our 2014e Impairment Charge forecasts by 43.0% to N7.9bn (US43.4m) from N5.6bn previously.  GTB’s deposit growth was quite slow in 9M 2014 despite the fact that management had earlier guided to 20% growth for 2014e. As at 9M 2014, Customer Deposits were up only 8%. Consequently, we have revised down our deposit growth forecast to 15% in 2014e from 20% previously. Based on current economic conditions, we also revise down our loan growth forecasts to 15% in 2015e and 2016e, from 18% previously for both years.  The bank reported total capital adequacy ratio (CAR) of 21.0% for H1 2014 which, according to management, was computed in line with Basel II requirements. This, compared with the 16.0% regulatory requirement for GTB, implies the bank has adequate capital. The managing director also stated during a conference call that the dividend pay-out will remain the same as in previous years. However, we slightly reduce our pay-out ratio assumption for 2014e and 2015e to 50.0% from 55.0% for both years considering the need for prudence.  The overall effect of these and other minor changes to our estimates is a reduction in our PBT forecasts by 13% in 2014e, 42% in 2015e and by 22% in 2016e. We maintain a Buy rating on GTB with a revised price target of N29.2/s, down from N39.80/s previously. We derive our N28.4/s price target by applying an implied 2.1x P/BV multiple to our 2015e BVPS estimate of N13.8. Our 2.1x multiple is derived with key inputs of 32.0% long-term RoAE, 13.0% risk free rate,19.6% cost of equity (COE) and 8.0% long term growth rate.
  • 35. Nigerian Banks Page 35 Equities CSL Stockbrokers is a division of FCMB (UK) Limited which is authorised by the Prudential Regulation Authority (PRA) and regulated by the Financial Conduct Authority (FCA) in the United Kingdom. . GTB Financials and ratios Nm Incomestatement 2011 2012 2013 2014E 2015E 2016E Profitabilityratios 2011 2012 2013 2014E 2015E 2016E Interest&discountincome 126,472 170,295 185,383 194,402 217,083 249,458 Netinterestmargin 8.3% 9.7% 9.5% 8.9% 9.0% 9.0% Interestexpense (27,980) (39,609) (48,444) (57,623) (65,186) (73,912) Cost/incomeratio 52.9% 43.1% 43.5% 46.5% 56.3% 47.8% NetInterestincome 98,492 130,686 136,939 136,779 151,896 175,546 Cost/incomeratioexprov. 46.1% 42.9% 42.9% 44.6% 45.3% 45.6% Other income 52,918 51,082 55,576 66,569 64,754 56,742 Pre-taxmargin 34.6% 46.5% 44.1% 40.1% 27.0% 37.7% Profitbeforeprov. 151,410 181,768 192,515 203,348 216,651 232,289 RoAA 3.8% 5.2% 4.7% 3.9% 2.5% 3.4% Loanimpairmentcharges (19,503) (739) (2,886) (7,947) (42,383) (10,882) RoAE 23.9% 33.8% 29.4% 24.7% 16.2% 21.6% TotalOpex (69,827) (78,001) (82,538) (90,792) (98,055) (105,899) Cost-to-assets 4.3% 4.5% 3.9% 3.8% 3.7% 3.5% Cost/incomeratio 52.9% 43.1% 43.5% 46.5% 56.3% 47.8% Cost/incomeratioexprov. 46.1% 42.9% 42.9% 44.6% 45.3% 45.6% Assetqualityratios 2011 2012 2013 2014E 2015E 2016E PBT 62,080 103,028 107,091 104,609 76,213 115,507 NPL/Totalloans 3.5% 3.4% 3.3% 3.5% 3.5% 3.8% Taxation (14,277) (16,341) (17,067) (17,784) (12,956) (19,636) Effectivetaxrate -23% -16% -16% -17% -17% -17% Capitalratios 2011 2012 2013 2014E 2015E 2016E MinorityInterest 538 338 338 338 339 340 Leverage 7.0x 6.1x 6.4x 6.3x 6.5x 6.3x Profitfortheyear 51,741 87,296 90,024 86,826 63,257 95,871 EPS(reported) 1.76 3.05 3.19 2.95 2.15 3.26 Liquidityratios 2011 2012 2013 2014E 2015E 2016E EPS(adjusted) 1.76 3.09 3.19 2.95 2.15 3.26 Loans/Deposit 69% 68% 70% 72% 72% 72% DPS 1.10 1.55 1.75 1.48 1.07 1.79 Payoutratio 63% 51% 55% 50% 50% 55% Growth-y/y 2011 2012 2013 2014E 2015E 2016E Dividendsum 32,374 44,373 49,513 43,413 31,628 52,729 NetInterestincome 20% 33% 5% 0% 11% 16% WeightedAve.ShareCount 29,431 28,261 28,261 29,431 29,432 29,433 Other income 27% -3% 9% 20% -3% -12% Profitbeforeprov. 22% 20% 6% 6% 7% 7% Balancesheet 2011 2012 2013 2014E 2015E 2016E TotalOpex 9% 12% 6% 10% 8% 8% Cash&cashequivalents 66,057 129,429 307,396 254,464 272,816 317,687 PBT 20% 66% 4% -2% -27% 52% Investments securities 164,941 145,257 459,415 376,720 433,228 498,213 Profitfortheyear 26% 69% 3% -4% -27% 52% Loans &advances 706,893 779,050 1,002,371 1,182,797 1,360,217 1,564,249 EPS(adjusted) 0% 76% 3% -7% -27% 52% TreasuryBills/moneymarketplacements221,014 147,427 0 0 0 0 Dividendsum 21% 37% 12% -12% -27% 67% Otherassets 81,098 0 0 0 0 0 Loans &advances 19% 10% 29% 18% 15% 15% Deferedtaxasset 97 992 1,946 2,016 2,076 2,138 NonPerformingLoans (NPL) -46% 17% 26% 26% 18% 25% Propertyandequipement 57,511 60,887 68,306 74,454 80,038 86,041 Totaldeposits 35% 12% 24% 15% 15% 15% Financialassets heldfortrading 173,298 271,074 17,224 18,774 20,182 21,695 Totalassets 43% 8% 21% 12% 12% 14% Totalassets 1,608,653 1,734,879 2,102,846 2,358,346 2,647,806 3,022,612 Totalliabilities 46% 5% 22% 12% 13% 13% Totaldeposits 1,026,119 1,148,197 1,427,494 1,641,618 1,887,860 2,171,039 Shareholders'Funds 12% 24% 16% 15% 8% 19% otherborrowings 93,230 92,562 92,135 87,735 90,367 93,078 Totalliabilities 1,378,259 1,451,437 1,770,489 1,978,416 2,237,074 2,535,856 Shareholders'Funds 228,392 282,172 327,270 374,776 405,579 481,603 MinorityInterest 2,001 1,269 5,084 5,153 5,153 5,153 BVPS 7.8 10.0 11.6 12.7 13.8 16.4 Source: Company, CSL estimates
  • 36. Nigerian Banks Page 36 Equities CSL Stockbrokers is a division of FCMB (UK) Limited which is authorised by the Prudential Regulation Authority (PRA) and regulated by the Financial Conduct Authority (FCA) in the United Kingdom. . Access Bank Revision to estimates  We revise our forecasts for Access Bank in response to recent developments and their impact on earnings and asset quality. These range from the slide in oil prices and the devaluation of the naira to the increase in the private sector cash reserve requirement (CRR) and the monetary policy rate (MPR).  We model Access Bank’s overall cost of risk (COR) rising in 2015e from our earlier-modelled 0.6% to 4.0%. We arrive at this increment by modelling the effect of a loss (effectively without collateral and therefore with 100% provision) of 7.2% of its US dollar loans.  Our PBT forecast decreases by 2.4% in 2014e, 75.0% in 2015e, and 47.2% in 2016e.  We upgrade Access Bank from Hold to Buy with a reduced price target of N7.73/s from N11.00/s (current price N5.34/s), based on an implied 0.7x P/BV multiple to our FY2015e BVPS estimate of N11.19.  As at 9M 2014, Access Bank’s portion of US dollar loans stood at 45% of gross loans. In estimating COR for 2015e, we have assumed that 7.2% of these loans become loss loans and would require 100.0% provisions, assuming no collateral collection. We estimate this would increase the bank’s COR to 4.0% from 0.6% modelled previously. Source: CSL estimates  In November 2014, the Central Bank of Nigeria (CBN) hiked the private sector CRR to 20% from 15% and reviewed the MPR upward to 13% from 12%. We expect the upward review in MPR to improve the bank’s margins and compensate, to an extent, for the lower interest yielding assets that will likely result from the hike in private sector CRR. We therefore adjust Net Access Bank, Nm 2014e Old 2014e New change 2015e Old 2015e New change 2016e Old 2016e New change Netinterestincome 96,325 95,390 -1% 106,647 104,715 -2% 113,745 111,455 -2% Netfee & commission income 29,359 29,247 0% 32,330 32,109 -1% 35,727 35,498 -1% Other income 31,663 31,499 -1% 36,704 36,366 -1% 39,781 39,390 -1% Impairmentcharge (6,169) (6,453) 5% (6,759) (45,059) 567% (7,576) (31,568) 317% Costofrisk 0.6% 0.7% 10bps 0.6% 4.0% 340bps 0.6% 2.5% 190bps Operating expenses (103,409) (103,082) 0% (115,428) (114,752) -1% (126,418) (125,613) -1% PBT 47,767 46,601 -2% 53,494 13,380 -75% 55,268 29,162 -47% Tax (7,165) (6,990) -2% (8,024) (2,007) -75% (8,290) (4,374) -47% Netprofits 40,602 39,611 -2% 45,470 11,373 -75% 46,978 24,788 -47% Recommendation: Buy Target: N7.73 Price: N5.34 price as at 28 Jan Year to December, Nbn 2013 2014e 2015e 2016e Net Interest Income 77.7 95.4 104.7 111.5 Net Profits 36.3 39.6 11.4 24.8 EPS, N 1.64 1.73 0.37 0.81 P/BV 0.5x 0.4x 0.5x 0.4x PE 3.3x 3.1x 14.3x 6.6x Div Yield 8.6% 4.5% 1.1% 2.4% Mkt. cap. N122.2bn (US$660.6m) Free float 84.2% Bloomberg ACCESS NL Reuters ACCESS.LG Three-year graph 0 5 10 15 Jan-12 Jan-13 Jan-14 Jan-15 Access Bank share price Access Bank rel. to Nigeria All-Share Contact information Lagos: +234 (0)1 448 5436 Analyst: Fola Abimbola +234 (0)1 448 5436 Head of Research: Guy Czartoryski Sales: Temi Popoola, CFA +234 (0) 1 448 5420 ext. 4507 London: +44 (0) 20 7220 1041
  • 37. Nigerian Banks Page 37 Equities CSL Stockbrokers is a division of FCMB (UK) Limited which is authorised by the Prudential Regulation Authority (PRA) and regulated by the Financial Conduct Authority (FCA) in the United Kingdom. . Interest Income slightly downward by 1.0% for 2014e and 2.0% for 2015e and 2016e.  While we do not rule out the risk of more stringent monetary policy measures in the coming months, we are more concerned about the negative impact of falling oil prices on Access Bank’s earnings and asset quality. Access Bank had the highest ratio of oil and gas non-performing loans (NPL) to oil and gas loans, at 3.6% as at 9M 2014, relative to its peer average of 1.6%.  Additionally, Access Bank’s highest loan exposure was in the oil and gas sector, at 24.7% of gross loans, with all of its upstream oil and gas loans denominated in US dollars. We raise our COR estimate to 4.0% from 0.6% for 2015e.  To create additional capital buffers, Access Bank boosted its tier-2 capital by raising N64.8bn (US$400m) through a 7-year subordinated debt issue in June 2014. Subsequently, it recently announced a one-for-three rights offering at an issue price of N6.90/s, targeted at raising N52.6bn (US$284.3m), with additional shares from the issue expected to be listed in June 2015.  We incorporate the outcome of the rights issue into our model using a price of N6.90 as suggested by the bank recently. As a result, we model a dilution of 7.6bn additional shares and a capital adequacy ratio (CAR) of 20.7% for 2014e, 22.2% for 2015e, and 19.6% for 2016e. Source: Company financials, CSL estimates Access Bank CAR, Nm 2011 2012 2013 2014e 2015e 2016e Tier-1 capital Share capital and premium 155,105.0 176,628.3 172,477.7 172,477.7 225,108.4 225,108.4 Retained earnings (6,744.6) 17,856.6 22,232.4 42,830.0 50,222.3 62,616.1 Other reserves 20,649.5 38,700.4 48,003.9 61,867.7 64,142.2 72,817.9 169,009.9 233,185.3 242,713.9 277,175.3 339,472.9 360,542.4 Add/(less) Fair value reserve for AFS securities 0.0 (2,037.7) (6,172.7) 0.0 0.0 0.0 Securities & properties & equipments (4,623.7) Foreign currency translational reserves 0.0 (1,453.0) 6,268.4 6,300.0 8,780.0 5,730.0 Investments in subsidiaries 0.0 0.0 0.0 0.0 0.0 0.0 Deferred tax assets (8,114.0) (10,687.6) (10,887.6) (11,037.6) (11,162.6) Intangible assets (3,277.6) (3,404.9) (3,659.1) (3,859.1) (4,059.1) (4,259.1) Total tier-1 capital 161,108.6 218,175.7 228,463.0 268,728.6 333,156.2 350,850.7 Tier-2 capital Fair value reserve for AFS securities 4,623.7 2,037.7 6,172.7 6,550.0 6,590.0 6,610.0 Foreign currency translational reserves 0.0 1,453.0 (6,268.4) 6,300.0 8,780.0 5,730.0 Subordinated debt 0.0 0.0 0.0 64,800.0 62,300.0 49,900.0 Collective allow ances for impairments 4,734.6 Non-controlling interest 23,054.8 8,099.6 1,768.1 1,856.5 1,949.3 2,046.8 Total tier-2 capital 32,413.1 11,590.2 1,672.3 79,506.5 79,619.3 64,286.8 Total capital 193,521.7 229,765.9 230,135.3 348,235.1 412,775.5 415,137.5 Risk-weighted assets 895,301.3 1,043,455.1 1,209,463.3 1,685,195.0 1,860,575.5 2,117,043.8 Capital adequacy ratio 21.6% 22.0% 19.0% 20.7% 22.2% 19.6%
  • 38. Nigerian Banks Page 38 Equities CSL Stockbrokers is a division of FCMB (UK) Limited which is authorised by the Prudential Regulation Authority (PRA) and regulated by the Financial Conduct Authority (FCA) in the United Kingdom. .  We also cut our forecast dividend pay-out ratio to 13.0% from 20.0% in 2014e, and an average of 15.0% in 2015e-2016e from 20.0%, as we expect Access Bank to capitalise a higher percentage of its Net Profits than before, in order to maintain an optimal CAR.  We model a reduction of our forecasts of PBT of 2.4% in 2014e, 75.0% in 2015e, and of 47.2% in 2016e. We raise our rating on Access Bank from Hold to Buy with a reduced price target of N7.73/s from 11.00/s previously. We arrive at our price target using an implied P/BV multiple of 0.7x and a BVPS estimate of N11.19 for 2015e. We also assume a 17.0% long term sustainable ROE, an 8.0% growth rate, and a cost of equity of 21.0% in our model.