Combination of informative biomarkers in small pilot studies and estimation o...
Stephens_Alexandra_version7
1. Implementation of volatile organic compound identification
algorithms using colorimetric sensor array data
Alexandra Stephens
Mentored by Dr. Alan Samuels and Dr. Charles Davidson
Introduction
Colorimetric sensor arrays create a way to “see smells.” These small
“tickets” consist of 76 colored spots with different chemical
compositions, such as metalloporphyrins and hydrogen bonding sites.
When exposed to volatile organic compounds (VOCs) or other
chemicals, the spots’ molecular structures foster various intermolecular
reactions, ranging from Lewis donor/acceptor reactions to Brønsted
acid/base reactions (Suslick, 2004). The result of these chemical changes
is reflected in the change in color of the dots. The red, green, and blue
(RGB) values of each spot are extracted through digital color imaging n
times until the reaction is complete, creating an n by 228 (76 times three)
matrix.
Analysis of VOC ticket data is utilized in chemical identification;
some methods of identification currently include computing the dot
product of data sets, the k nearest-neighbor algorithm, and hierarchical
cluster analysis. However, a permanent and accurate algorithm has yet to
be established. The purpose of this investigation was to develop an
approach that analyzes colorimetric sensor array data and correctly
identifies at least 90% of chemicals.
Methods and Materials
Three separate approaches to chemical identification were developed
and tested with a matrix of 34 chemical signatures, “S”, using the
platform MATLAB®. Testing involved processing a copy of one of the
chemicals in matrix S, as if it were an unknown substance, and
comparing it to S by running the developed algorithm.
The first idea was to differentiate between non-reacting spots, or
“zeros,” and spots that experienced significant color change due to a
chemical reaction. Graph 1 shows how the various amount of color
change is reflected in the data. A threshold of what is to be considered an
unchanging spot was calculated, and data within the range were assigned
the value zero. The remaining spots were set equal to either one or
negative one, regardless of magnitude (Graph 2). The same threshold
was applied to the signature matrix S, and the program identified the
chemical with the most matching values.
The next identification method calculated the z-score of every RGB
value of the “unknown” element, using the mean standard deviations of
all 34 chemicals. The chemical with the smallest z-score summation was
identified as the correct chemical, meaning that overall, it was the
fewest-standard-deviations away from the mean. Mathematically,
Z =
x − μ
σ
.
Originally, the dot-product method was used to compare the
magnitude and direction of two, 228-dimensional vectors, identifying the
substance with the highest dot product as correct. A normalized version
of the dot product—the angle between two vectors—was implemented to
compare only the direction of the vectors. The formula for computing the
angle between vectors is cos θ =
u · v
u v
.
Conclusion
The purpose of this study was to develop a program that analyzes
colorimetric sensor array data and correctly identifies at least 90% of the
34 household chemicals given. The angle-between-vectors approach
surpassed the 90% accuracy goal, and drastically improved upon the dot
product approach. This is because it eliminates the potential to
incorrectly identify a VOC due to high magnitudes of color change,
found in chemicals such as Bleach.
The one-zero method did surprisingly well, given the simplicity in the
program. It performed slightly better than the z-score approach, which is
more complex and uses more advanced statistics.
The same issue arose in all of the identification programs: since some
of these household substances were quite similar, for example, two
different versions of OFF® insect repellent were tested, many of these
substances identified as one another. This may be because the actual
chemical compositions of these substances are so similar, the data varies
only slightly, causing confusion in some or all of the identification
algorithms.
To advance this study, larger sample sizes should be used to ensure
consistency of the programs. It is an important piece to the many
applications of colorimetric sensor array data analysis. For example, lung
cancer and other diseases can be identified through analysis of the breath
of patients with colorimetric sensor arrays (Beukemann et. al., 2012).
They serve as a less-invasive, less-expensive, and potentially more
accurate diagnostic tool. This situation can be life threatening, and an
identification program with high accuracy (at least 90%) is necessary.
Results
References
Beukemann, M. C., Kemling, J. W., Mazzone P. J., Mekhail, T., Na, J.,
Sasidhar, M.,…Xu, Y. (2012). Exhaled breath analysis with a colorimetric
sensor array for the identification and characterization of lung cancer. J
Thorac Oncol, 7(1):137–142 doi: 10.1097/JTO.0b013e318233d80f
Suslick, K. S. (2004). An optoelectronic nose: “seeing” smells by means of
colorimetric sensor arrays. MRS Bulletin. Retrieved from
www.mrs.org/publications/bulletin
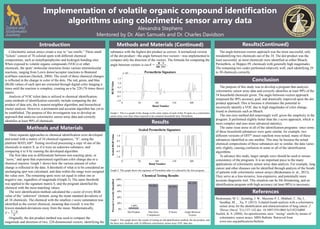
Graph 1: This is a graph of the change in the color values of each of the 76 spots on a colorimetric
sensor array over time when exposed to the common household item, Permethrin.
Graph 2: This graph shows the signature of Permethrin after it is altered by the first program.
5.88%
85.29% 82.35%
94.12%
0%
20%
40%
60%
80%
100%
Dot Product One-Zero
Comparison
Z-Score Angle Between
Vectors
Chemical Testing Results
Graph 3: This graph shows the results of testing an old identification method, the dot product, and
the three new methods with 34 different colorimetric sensor array VOC data sets.
Results(Continued)
The angle-between-vectors approach was the most successful, only
misidentifying two chemicals out of the 34. The dot-product was the
least successful, as most chemicals were identified as either Bleach,
Permethrin, or Hoppes #9, chemicals with generally high magnitudes.
The remaining two codes performed relatively well, each identifying 29
to 30 chemicals correctly.
Scaled Permethrin Signature
0 50 150 200100
ScaledRGBValue
Band Number
-1.0
-0.5
0.0
0.5
1.0
Permethrin Signature
-1.0
-0.5
0.0
0.5
1.0
1.5
RGBValue
Band Number
0 50 150 200100
× 104
PercentCorrectlyIdentified
Methods and Materials (Continued)