1. Saudi Debt Doubles But ‘Not By Enough’
Saudi debt, at $73bn, is double end-2015 and six times end-2014 levels. But both Energy Minister
Khalid al-Falih and the IMF say the country should take on more debt. Just as well the country is set
to launch a $15bn bond. The sell-off of SEC’s 65GW capacity will raise more cash. Page 11, 6
ECONOMICS & FINANCE
Weekly Energy, Economic
& Geopolitical Outlook
Vol. 59. No. 41
14.October.2016.
Oil & Gas
Transportation
Refining &
Petrochemicals
Power & Water
OPEC
Geopolitical Risk
Corporate
Economics &
Finance
Selected Data
CORPORATE ECONOMICS & FINANCE GEOPOLITICAL RISK ECONOMICS & FINANCE
OIL & GAS REFINING & PETCHEMS TRANSPORTATION OPEC
Oman is feeling the pinch
with the $6.5bn Liwa plastics
project pushed back to 2020.
Upstream output remains over
1mn b/d but a new bid round
offers thin pickings. Page 5
Having for years responded to
$100/B-plus oil prices with a
budget price of $37/B, Algeria
has factored in $50/B for 2017.
But planned spending cuts look
optimistic. Page 12
The KRG sold $612mn of crude
in September, the most since
November 2015, yet the
government retained just
$328mn due to the repayment
of trader loans. Page 10
The IMF has told Cairo that
it will not get the first $2.5bn
tranche of the $12bn IMF loan
until it liberalizes the currency
and cuts subsidies.
Page 9
Gulf equity markets have
been slow to develop and
liberalize. But 2016 has seen
the introduction of potentially-
transformative new products
and regulations. Page 13
Sharjah has signed up to
import LNG from early 2018,
the third UAE emirate to do so.
This comes just a week after
signing for more Qatar piped
gas. Page 4
Markets are inching back to
balance with prices above
$50/B thanks to Opec’s
proposed cuts. But the jury is
still out on the likelihood of
serious Opec action. Page 7
Shell and Japan’s Sojitz have
signed up to study Iranian
petchems projects. Russia’s
Tatneft has meanwhile inked
an MoU for EOR at the
Dehloran oil field. Page 2
Iran Inks More
Preliminary
Deals
Oman Bidding
Launch, Liwa
Delayed
Algeria: At
Last A (Fairly)
Realistic Budget
KRG Revenues
Consumed By
Repayments
Sharjah Signs
Up For Another
UAE FSRU
IMF To Egypt:
Reform First,
Cash Later
Opec ‘Cuts’:
Will They
Materialize?
Gulf Equity
Markets:
Change Is Afoot
2
4
5
6
7
9
10
11
15
800
700
600
500
400
300
200
100
0
-100
-200
Jan Feb Mar Apr May Jun jul aug2016
2016sama reserves ($bn)
2009 2010 2011 2012 2013 2014 2015
2. ©MiddleEastPetroleumandEconomicPublications(Cyprus)Ltd
ReproducingMEESIsStrictlyProhibitedwww.mees.com14.October.2016
2
††oil&gas
Iran Inks Petchems Deals With Shell, Sojitz;
Tatneft Signs Up For EOR
I
ran’s National Petrochemi-
cal Company (NPC) has
signed preliminary agree-
ments with Anglo-Dutch
firm Shell and Japan’s Sojitz for petro-
chemicals projects studies. This brings
to six the number of deals the state firm
has secured since the lifting of interna-
tional sanctions in January (see table).
NPC and Shell signed a letter of
intent (LoI) to study a variety of po-
tential petchem prospects. Shell’s Iran
vice-president Hans Nijkamp says
the projects that Shell would consider
developing in Iran include an ethane
cracker and a gas-to-liquids (GTL) plant.
“The LoI gives us a framework for
detailed discussions with NPC,” Mr
Nijkamp says. “We need to study the
areas where we can work together before
we can then consider commercial and
technical options for a joint venture.”
While Shell developed Iran’s So-
roush and Nowruz offshore fields before
sanctions, it had no petrochemicals
projects underway. However, Shell
and NPC had been negotiating for the
joint development of a 74,000 b/d GTL
plant, having completed a feasibil-
ity study (MEES, 24 May 2004).
NPC has also signed a memorandum of
understanding (MoU) with Sojitz to study
the feasibility of a methanol-to-propylene
project. The plant would be built near the
Gulf port of Assaluyeh – home to the on-
shore processing plants for South Pars gas
– to utilize feedstock made from methane.
POST-SANCTIONS PUSH ç
NPC’s first post-sanctions deal was
for a methanol plant, although this will
be built at a new industrial zone at the
Gulf of Oman port of Chabahar. Dan-
ish firm Haldor Topsoe aims to revive
pre-sanctions cooperation with NPC, and
has recently reopened a Tehran office.
Topsoe and NPC signed a preliminary
agreement for licenses, engineering,
proprietary equipment and catalysts
for the methanol plant. The company
was contracted to provide process
technology for nine projects – mainly
methanol plants at Assaluyeh – before
sanctions (MEES, 12 February).
France’s Total, which completed the
offshore Sirri A and E fields developments
in Iran before sanctions, but concluded no
agreements downstream, has signed an
MoU with NPC for a feasibility study into
building an ethane cracker on the Iranian
coast (MEES, 18 March). It also has an
MoU, for the South Azadegan field, which
currently produces around 60,000 b/d.
NPC subsequently secured a GTL
research deal with South Africa’s Pet-
roSA, before signing a ‘mainstream’
petchems agreement with Germany’s
Linde, for front end engineering de-
sign (FEED) work on four units at the
long-delayed 12th Olefin complex.
Further agreements between NPC
and international petchems firms are
anticipated, with local media reporting
talks with France’s Axens for catalysts,
France’s Air Liquide for a methanol
to propylene plant, and Germany’s
BASF for an ethylene and polyethyl-
ene complex (MEES, 12 August).
Although BASF dismissed the lo-
cal reports as “market rumors”, NPC
Managing Director Marzieh Shahdaie
said this week that BASF and Air Liq-
uide are among a group of companies
that are finalizing plans for invest-
ment in Iranian petrochemicals.
Iran’s post-sanctions petchems deals
are being overshadowed by state upstream
firm NIOC’s plans to offer upstream
projects to foreign investors, under a new
Iran Petroleum Contract (IPC), which
replaces the previous unpopular buybacks
contract. The latest provisional deal is
with Russian state firm Tatneft (see box).
Last week NIOC signed its first devel-
opment deal under IPC terms, with well-
connected local firm Persia Oil and Gas
(MEES, 7 October). At the signing of the
NPC/Shell deal, deputy petroleum minis-
ter Amir Zamaninia said Iran aims to sign
upstream deals worth $10bn by the end of
the current Iranian year in March 2017. ¶
Shell has been lined up to study Iranian petchems projects, and Japan’s Sojitz a
propylene plant. The deals coincide with an EOR MoU with Russia’s Tatneft.
IRAN
IRAN’S POST-SANCTIONS PRELIMINARY PETCHEMS DEALS
Company Country Project/Program Covers
Haldor Topsoe Denmark Methanol plant, Chabahar Licenses, engineering, equipment, catalysts
Total France Ethane cracker Feasibility study
PetroSA South Africa Gas-to-Liquids research Cooperation in developing reactors
Linde Germany 12th Olefin, Assaluyeh FEED for cracker, butadiene, benzene units
Shell UK/Netherlands Various (ethane cracker, GTL etc) Feasibility studies
Sojitz Japan Methanol-to-propylene plant Feasibility study
SOURCE: SHANA, IRNA, MEES.
Russian state firm Tatneft on 10
October signed an MoU with Ira-
nian counterpart NIOC for further
development of Dehloran oilfield.
Dehloran is a mature field on the bor-
der with Iraq, an area that Iran has prior-
itized for foreign involvement. Discov-
ered in 1972, the field entered production
in 1978. Output is currently 24,000 b/d
from 16 wells. But the plan is that a deal
under the new Iran Petroleum Contract
would raise output of the field’s 29.8°API
crude to 40,000 b/d. Gas output is slated
to rise from the current 37mn cfd – all of
which is flared – to 77mn cfd sales gas.
Tatneft’s pitch to NIOC focussed on
the firm’s “unique experience in develop-
ing oilfields through the application
of [the] most advanced enhanced oil
recovery techniques,” Tatneft says.
Of the seven post-sanctions upstream
deals to date, three are with Russian
firms: Lukoil has an MoU for projects in
Mansuri and Ab Teymour, and Zarubesh-
neft for West Paydar (MEES, 7 October).
TATNEFT INKS EOR MOU
Iran’s KEY BORDER OIL FIELDS
IRAQ
IRAN
Nasiriyah
Basra
DEHLORAN
MAJNOUN
AZADEGAN
YARAN
MARUN
YADAVARAN
AZAR
BADRA
Ahvaz
Abadan
OIL FIELD GAS FIELD
3. ©Middle East Petroleum and Economic Publications (Cyprus) Ltd
Reproducing MEES Is Strictly Prohibited
14.October.20163
OIL & GAS
††
September 2016 Breakdown
Sep16 vAug16 vSep15 Aug16 Jul16 Sep15 Sep14 Oil vSep15 Gas vSep15 Onshore vSep15 Offshore vSep15
Saudi Arabia 124 - -1 124 125 125 107 71 -2 53 +1 109 +3 15 -4
Oman 64 -1 -2 65 65 66 62 55 -4 9 +2 64 -2 0 -
Iran 57 - +3 57 57 54 54 na na na na na na na na
Iraq 40 +2 -9 38 39 49 58 40 -9 0 - 40 -9 0 -
Kuwait 48 +1 +5 47 47 43 43 39 +5 9 - 48 +5 0 -
Abu Dhabi 49 - +9 49 48 40 35 42 +6 7 +3 27 +3 22 +6
Dubai 4 +2 +2 2 2 2 2 4 +2 0 - 1 +1 3 +1
Qatar 9 +4 +3 5 7 6 10 8 +3 1 - 5 +3 4 -
Bahrain 1 - +1 1 1 0 4 1 +1 0 - 1 +1 0 -
GCC Total 299 +6 +17 293 295 282 263 220 +11 79 +6 255 +14 44 +3
Middle East Total 396 +8 +11 388 391 385 379 260 +2 79 +6 295 +5 44 +3
Algeria 53 -3 +2 56 55 51 45 35 -4 18 +6 53 +2 0 -
Egypt 26 -1 -12 27 27 38 51 22 -4 4 -8 20 -12 6 -
Libya 1 - - 1 1 1 5 0 - 1 - 0 - 1 -
N Africa Total 84 - -9 84 85 93 103 57 -11 24 -1 74 -11 7 -1
MENA Total 472 - -6 472 476 478 482 317 -9 103 +5 369 -6 51 +2
MENA % of World* 29 - +8 29 31 21 13 US WEEKLY RIGCOUNT (WEEK ENDING)
OPEC Total 466 +5 -29 461 457 495 484 26-Aug 2-Sep 9-Sep 16-Sep 23-Sep 30-Sep 7-Oct
OPEC % of World* 28 -0 +6 29 30 22 13 TOTAL 489 497 508 506 511 522 524
World Total* 1641 +37 -584 1604 1538 2225 3713 Oil 406 407 414 416 418 425 428
of which US 509 +28 -339 481 449 848 1930 Gas 81 88 92 89 92 96 94
SOURCE: BAKER HUGHES RIG COUNT EXCEPT IRAN-OPEC ESTIMATES. OIL/GAS BREAKDOWN EXCLUDES RIGS CLASSIFIED AS ‘MISCELLANEOUS’ *’WORLD’ EXCLUDES ONSHORE CHINA AND FORMER SOVIET UNION (EXCEPT SAKHALIN).
MIDDLE EAST DRILLING SHOWS RESILIENCE WITH REGION’S SEPTEMBER RIG COUNT AT NEAR RECORD LEVELS
• Drilling in Saudi Arabia has remained at near-record
levels since the beginning of last year. The kingdom’s
rig count, according to services firm Baker Hughes, has
remained above 120 since February 2015. Rig counts
averaged 125 in the first nine months of this year, up
marginally from 123 during the same period last year.
• Saudi crude production in September dipped to
10.53mn b/d but still the second highest this year, follow-
ing peak summer electricity demand (MEES, 7 October).
• Saudi Arabia’s investment focus over the next decade
is on developing its conventional and unconventional gas
reserves Aramco CEO Amin Nasser said on 11 October.
It plans to nearly double gas production capacity from
14bn cfd to 24bn cfd over this period, hitting 18bn cfd in
2020. But while the kingdom’s oil rig count of 71 is just
shy of January’s annual high of 72, the number of gas
rigs has fallen from a record 60 in November 2015 to 53
in September.
• Under Opec’s planned production cut to 32.5-33mn
b/d (see p7) Saudi Arabia would shoulder the majority of
the burden.
• Drilling in Kuwait in September reached a 2016 rig
count-high of 48, not far off the all-time record of 53 in
March last year. Its 39 oil rigs is the highest since June
2015, while output is at record heights.
• The same holds true in the UAE, where drilling is also at
near-record levels as Dubai doubled its rig count to four.
Adding two oil rigs, one onshore and one offshore (see
table). In Abu Dhabi, the onshore/offshore split was 27
and 22, the closest to balancing since November 2015
when the division was 26 apiece.
• Qatar also saw an 80% rise in its rig count in Septem-
ber from August, rising to 9, equaling the 2016 high in
January. The number of oil rigs doubled to 8, the highest
level since April 2015.
• All of this has meant drilling within the GCC remains
near record levels in September, totaling 299 (see graph),
and within touching distance of December’s record 303.
Regarding oil, September’s 219 rigs is an all time high.
• There has also been a gradual uptick in US drilling, with
the rig count in September going above 500 for the first
time since February, reaching 524 in the first week of Oc-
tober, according to weekly data. But this is still more than
70% down on October 2014 when it hit a record 1,929.
• Drilling in Egypt has yet to see an uptick from the
recent modest recovery in oil prices. At 26 active rigs the
number is the lowest since September 2005.
• One company that has explicitly said that it is raising
drilling activity in response to higher oil prices is Toronto-
listed TransGlobe. The company’s Eastern Desert output
fell to a 5-low of 11,000 b/d in May after the company
halted drilling, but it has since rebounded to 11,730 b/d in
Q3 and is on course to achieve its end-2016 target of 13-
14,000 b/d output, CEO Ross Clarkson said last week.
GCC Countries Keep Middle East Drilling At NEAR-Record Levels
GCC Countries CONTINUE DRILLING AT RECORD LEVELS AS US RIG COUNT SHOWS SUSTAINED SIGNS OF RECOVERY
300
250
200
150
100
50
0
3,000
2,500
2,000
1,500
1,000
500
0
Qatar
Oman
UAE
Kuwait
Saudi Arabia
US
1990
1991
1992
1993
1994
1995
1996
1997
1998
1999
2000
2001
2002
2003
2004
2005
2006
2007
2008
2009
2010
2011
2012
2013
2014
2015
Jan-16
Feb-16
Mar-16
Apr-16
May-16
Jun-16
Jul-16
Aug-16
Sep-16
4. ©MiddleEastPetroleumandEconomicPublications(Cyprus)Ltd
ReproducingMEESIsStrictlyProhibitedwww.mees.com14.October.2016
4
„„transportation
UAE Goes LNG Import Crazy:
Sharjah Follows Dubai And Abu Dhabi
T
he UAE is a net gas im-
porter and last week inked
a deal to increase piped
imports from Qatar. But,
amid political competition between the
emirates, that hasn’t stopped Shar-
jah this week joining Abu Dhabi and
Dubai in signing up to import LNG.
According to an MoU signed this
week between Sharjah National Oil
Company (SNOC) and German energy
trader Uniper, SNOC will receive LNG
from spring 2018 via a floating stor-
age and regasification unit (FSRU) to
be moored at the Port of Hamriyah.
A Uniper spokesman confirmed the
deal to develop an FSRU import facility,
without giving any detail on the amount
of LNG supplies, the necessary infrastruc-
ture development, or the duration of a
potential sales and purchase agreement.
However the companies say the MoU
paves the way for LNG imports as a
long-term solution. “The natural gas will
be marketed to existing gas consumers
in the region and new business seeking
a reliable long-term supply of energy,”
SNOC says. Gas will flow to the Sajaa gas
field complex in Sharjah and then into
the existing pipeline network throughout
the northern Emirates (Ajman, Fujairah,
Ras al-Khaimah, and Umm al-Quwain),
serving to meet growing gas demand
from the power and industrial sectors.
ADDING TO DOLPHIN GAS ç
The move follows last week’s news
that Sharjah Electricity and Water
Authority (Sewa) and Ras al-Khaimah’s
Rakgas had signed up for extra import
volumes from Qatar via the 3.2bn cfd
Dolphin pipeline (MEES, 7 October).
The additional supplies through the
Gulf’s only cross-border gas pipeline
were delayed for years, as Qatar Petro-
leum would not agree on a price that
did not at least match LNG netbacks to
higher-priced destinations in Asia.
But more recently Qatar has been keen
to lock its uncommitted volumes under
medium- to long-term contracts, as a glob-
al supply glut pushed prices down from
$14/mn BTU in early 2015 to around $6/
mn BTU now, causing greater convergence
between Asian and European markets.
The northern Emirates were already
receiving interruptible gas volumes
through Dolphin during summer peak pe-
riods – although it is unclear whether this
will continue following last week’s deal.
Gas-to-power demand in the north-
ern Emirates has been growing at a
rapid pace. Power consumption increased
by 80% since 2004, hitting 20.4TWh
in 2014, 18% of the UAE’s total.
Sewa and the Federal Water and
Electricity Authority (Fewa), which over-
sees the remaining northern Emirates,
together operate a total of 3.62GW gen-
eration capacity (see table). Sharjah has
2.89GW ofgenerationcapacity,butlimited
local gas supplies have forced the emirate
to import almost half of its 2014 electric-
ity needs from Abu Dhabi (see chart).
For its part, Fewa has just 733MW
capacity (all gas turbine). It produced
just 0.4TWh of power in 2016, leaving it
reliant on ‘imports’ from Abu Dhabi to
meet fully 96% of 10.2TWh demand.
The two authorities aim to increase
capacity through investment in coal and
solar. New gas-fired capacity will include
the expansion of the Hamriyah power
plant as well as a new 2.2GW combined
cycle gas turbine plant – requiring 250
mn cfd – for which an MoU was signed
this year between Fewa and Siemens.
Sharjah has been seeking new gas sup-
plies amidst a long-term decline in local
output, though the February start-up of
the Zora field, operated by local firm Dana
Gas has provided a boost. Output here
is currently 16mn cfd with Dana target-
ing 40mn cfd plateau output (MEES,
4 March). However these volumes are
modest compared to the nominal 700mn
cfd processing capacity at the onshore
processing plant, which also handles
output from the declining Sajaa, Moveyeid
and Kahaif gas-condensate fields.
Plans to import gas from Iran via
pipeline have failed as a long-running
dispute over a gas supply contract
between Sharjah-based Crescent
Petroleum (Crescent and Dana have a
substantial cross-shareholding) and
Iran’s NIOC remains unresolved.
Ironically at least some future LNG
may come from Qatar, with which Uniper
has an established relationship. Uniper’s
parent company E.ON in October 2013
signed a medium-term LNG supply con-
tract with Qatargas for 2013-18 supplies.
BUDGETARY PRESSURE ç
Low LNG prices and the limited infra-
structure needed for FSRUs (compared
to pipeline projects) have lowered the
barriers to individual emirates developing
their own separate import infrastruc-
ture. The Sharjah FSRU will add to Abu
Dhabi’s FSRU moored off Ruwais and
Dubai’s Excelerate facility at Jebel Ali
port. The floating technology is prov-
ing to be a much cheaper and quicker
alternative to now indefinitely-shelved
plans to develop a 9mn tons/year onshore
terminal at Fujairah (MEES, 19 August).
Following the oil price collapse in 2014,
growing budgetary constraints have made
LNG a more viable option to meet urgent
gas requirements compared with the cost
of extracting domestic sour gas in Abu
Dhabi. With the UAE’s power demand
rising rapidly, the huge dependence of
the electricity sector on gas (over 90% of
the generation mix) is adding pressure
on fuel supplies. Consumption more than
doubled in the past decade from around
52TWh in 2004 to 111.7TWh in 2014.
In this context, Abu Dhabi is looking to
streamline operations and reduce costs in
its oil and gas industry, exemplified with
the recently announced Adma-Zadco
merger (MEES, 7 October). As part of this,
Abu Dhabi is understood to be reviewing
its gas strategy, with an allocation plan
expected in the coming months. This
will likely include future policy on LNG
exports, on which a decision has yet to
be made (MEES, 30 September). ¶
UAE
UAE INSTALLED GENERATING CAPACITY (GW)*
Adwea Dewa Sewa Fewa TOTAL
Gas Turbine 0.67 1.93 2.43 0.73 5.76
Steam Turb. 1.49 0.43 1.92
Comb. Cycle 13.34 7.72 21.06
Diesel 0.03 0.03
Solar 0.05 0.01 0.06
TOTAL 15.55 9.66 2.89 0.73 28.83
gas fired 15.50 9.65 2.86 0.73 28.74
bn cfd gas^ 1.78 1.11 0.50 0.13 3.52
*END-2014. ^IMPLIED. SOURCE: UAE ENERGY MINISTRY, MEES.
UAE: 2014 POWER SUPPLY/DEMAND (TWh)
120
100
80
60
40
20
0
Production Consumption
TOTAL: 116.5 TWh TOTAL: 111.7 TWh
Fewa
Sewa
Dewa
Adwea
FIGURES IMPLY TRANSMISSION LOSSES OF 4.1%.
SOURCE: UAE ENERGY MINISTRY, MEES.
70.85
39.60
5.68
0.40
52.84
38.42
10.16
10.27
5. ©MiddleEastPetroleumandEconomicPublications(Cyprus)Ltd
ReproducingMEESIsStrictlyProhibitedwww.mees.com14.October.2016
5
‰‰refining&petrochemicals
Oman Announces New Bid Round
As Record Output Continues
O
man’s Ministry of Oil and Gas
(MOG) announced details
of a new oil and gas bidding
round on 12 October. Four
blocks are on offer in Oman’s first bid
round since 2014. It opens on 23 Octo-
ber and extends to 15 February. When
the bid round was initially proposed
earlier this year, Oman had suggested it
could offer up to five blocks (MEES, 24
June). Of the four blocks on offer one
is offshore (Block 52), with three on-
shore (Blocks 30,31 and 49 – see map).
The bid round comes at a time when
there is considerable momentum within
Oman’s oil and gas sector. Latest figures
from the ministry show that September
production of crude oil and condensate
was 1.003mn b/d. While 10,000 b/d
down on August’s record 1.013 mn b/d,
it marked a record fifth consecutive
month of production being above 1mn
b/d. Production in the first three quar-
ters of 2016 has averaged 1.013 mn b/d,
meaning that the Sultanate is on track to
easily break its 990,000 b/d 2016 target.
A HARD SELL? ç
Nevertheless, drumming up interest in
the upcoming bid round looks like a hard-
sell. With firms having cut back on invest-
ment in response to low prices, few are
clamoring for new acquisitions. Moreover,
firms have been leaving Oman of late, with
near-bankrupt Circle Oil shutting up shop
in 2015 (relinquishing Blocks 49 and 52)
owing to poor drilling results and failure
to find a farm-in partner (MEES, 19 June
2015). Last year Total also handed back
the offshore Block 41, Norway’s DNO re-
linquished Blocks 30 and 31 and in August
Thailand’s state owned-PTT said it was
selling its 1,600 b/d Block 44 to local firm
ARA Petroleum (MEES, 9 September).
Given that the latest bid round consists
of those blocks relinquished by Circle
and DNO, the signs are not positive.
Block 30 was last held by DNO. It
neighbors US firm Occidental’s Block 27
and state-led Petroleum Development of
Oman (PDO) massive Block 6. Accord-
ing to MOG, six of the nine wells drilled
in the block have discovered gas – it is
predominantly a tight gas play – and have
tested at rates between 7-18mn cfd. The
last well was drilled in January 2010.
Block 31 abuts the north-western
border with Oman, along with Oxy’s
Block 9 and PTT’s relinquished
Block 44. Again a tight gas play, the
last well was drilled in 2011.
The final onshore offering is Block
49, which is on the south-western
border with Saudi Arabia. To the east
of the block is DNO’s Block 36. DNO
announced on 24 May that its “Hayah-1
exploration well in Oman’s onshore
Block 36 failed to encounter hydrocar-
bons other than minor gas shows and
will be plugged and abandoned.” How-
ever, it has not relinquished the asset.
Block 49 is listed as an oil
block, the last well was spudded
by Circle Oil in January 2015.
The offshore Block 52 is listed as an
expected oil play. Circle relinquished
the block without drilling a single well,
indeed, only one well has been drilled
there – in 1991 by PDO. MOG highlights
that it borders Block 50 to the north and
that Masirah Oil made a “major discov-
ery” there in 2014 – however this was
the first offshore discovery in Oman for
more than 30 years. The field is produc-
ing around 3,000 b/d of light oil. ¶
OMAN
Liwa Plastics
Delayed To 2020
State refiner Orpic has begun
construction of its $6.5bn Liwa
Plastics complex at Sohar, 100km
northwest of Muscat. Although
initially intended to start up in 2018,
the schedule has slipped to 2020.
The plant will process 36,000
b/d of light ends from nearby Sohar
refinery and 24,000 b/d of NGLs
from Fahud field to produce 1.1mn
tons/year of petrochemicals, includ-
ing 800,000 t/y of polyethylene
and 215,000 t/y of polypropylene.
CEOMusabal-MahruqisaysLiwa
will “change Orpic’s product mix by
extracting more value from natural
gas and crude.” Orpic currently
produces over 1mn t/y of aromatics
and 350,000 t/y of polypropylene at
plants alongside the Sohar refinery.
Orpic awarded $4.5bn worth
of engineering, procurement and
construction work for Liwa. US
firm CBI is building the 880,000
t/y cracker, Italy’s Tecnimont the
polymers unit, Korea’s GS Engineer-
ing Construction and Japan’s
Mitsui the NGL extraction plant,
and India’s Punj Lloyd the 300km
NGL pipeline (MEES, 27 November
2015, MEES, 30 October 2015).
The project schedule appears
to have been pushed back due to
the squeeze on Oman’s spending
by lower oil prices combined with
Orpic’s bumper development pro-
gram. The company is also spend-
ing $2.1bn on expanding – from
116,000 b/d to 197,000 b/d – and
upgrading its Sohar refinery. The
schedule here has also slipped, from
2016 to Q1 2017 (MEES, 19 August),
with the UK’s Petrofac and Korea’s
Daelim the key contractors.
Orpic is also building 290km
of 93,000 b/d products pipelines
linking the Sohar and 106,000 b/d
Mina-al-Fahal refineries and a new
170,000m3
storage terminal near
Muscat airport. Meanwhile, the
DRPIC joint venture of state oil
firm OOC and Abu Dhabi invest-
ment fund IPIC is tendering for a
230,000 b/d refinery at Duqm on the
Arabian Sea coast of central Oman.
GULF OF OMAN
ARABIAN SEA
UAE
OMAN
IRAN
SAUDI ARABIA
YEMEN
QATAR
Muscat
Sohar
Al-Buraymi
Sur
Duqm
Salalah
30
41
RELINQUISHED
6
(PDO)
50
(MASIRAH)
36
(DNO)
9
(OXY)
44
(ARA/PTTEP)
27
(OXY)
49
52
31
oman 2016 licensing round
oil field/pipeline gas field/pipeline blocks on offer oil terminal lng terminal
6. ©MiddleEastPetroleumandEconomicPublications(Cyprus)Ltd
ReproducingMEESIsStrictlyProhibitedwww.mees.com14.October.2016
6
ååpowerwater
SEC Fate Sealed As Falih Plots
65GW Powergen Privatization
S
audi Energy Minister Khalid
al-Falih told the World Energy
Congress in Istanbul this week
that Riyadh plans to privatize
65GW of Saudi power generating capac-
ity, as part of a massive shake-up of the
kingdom’s energy sector under the govern-
ment’s Vision 2030 long term strategy.
The strategy was instigated by Deputy
Crown Prince Muhammad bin Salman
to end the Saudi economy’s “addic-
tion to oil.” A medium term National
Transformation Program to achieve the
vision aims for 100% of Saudi elec-
tricity to be generated by “strategic
partners” in 2020 (MEES, 10 June).
Central to the vision will be a public
listing of state-owned integrated petro-
leum giant Saudi Aramco. “Although the
share that will be listed will be small, it
will be by far the largest IPO in history,”
Mr Falih told delegates at the congress.
“Also, about 65GW of power genera-
tion will be privatized in the next couple
of years, along with other state-owned
assets that the government is currently
putting into its plans,” Mr Falih added.
“Helped by these privatizations, the
asset portfolio of our sovereign wealth
fund, the PIF, will approach $2 tril-
lion dollars and will become the largest
sovereign wealth fund in the world.”
SAUDI POWER FIRMS ç
Seventeen companies generate elec-
tricity in Saudi Arabia, having combined
capacity of 81.6GW. The largest of these is
Saudi Electricity Company (SEC) owned
74% by the government, 7% by Aramco
and 19% by private investors through
the Saudi Stock Exchange (Tadawul).
SEC has generating capacity of
57.1GW, but can deliver up to 69.2GW
through its transmission and distribu-
tion grid by selling electricity gener-
ated by third parties. These include
independent power producers (IPPs), in
which SEC holds equity, and industrial
firms powering their own operations.
While Mr Falih gave no indication
of which companies would provide the
capacity to be privatized, SEC will likely
provide it all. SEC’s end-2015 capacity
of 57.1GW will be boosted by 8.7GW
from four SEC projects due to start up
by end-2017, taking total capacity to
65.8GW in time for privatization.
The Saudi government has been plan-
ning to sell off SEC for many years, but
only this year has the prospect of privati-
zation become a certainty. A key reason
to break up SEC is its growing difficulty
in financing the capacity expansions it
needs to keep ahead of consumption.
SEC has raised $34.5bn since 2007
to fund new capacity, since its own
budgets are constrained by govern-
ment’s insistence on unfeasibly low
electricity tariffs. SEC recently wors-
ened its funding headache by approv-
ing plans to add 5.4GW of capacity at
Dhuba and Taiba (MEES, 7 October).
SOLAR ‘POWERHOUSE’ ç
Besides enabling the privatization
of SEC, the transformation program
also appears to be making Saudi plans
for renewable energy projects more
feasible. Before the vision, Riyadh had a
target of 54GW of renewables by 2030,
but had developed just 0.05% of this, a
mere 25MW of solar, by end-2015.
“We have taken a range of energy
efficiency measures, while also taking
steps to turn the kingdom into a global
solar energy powerhouse with an initial
target of about 10GW in five years as part
of fulfilling our COP21 commitments,”
Mr Falih said. “And beyond this 10GW
of renewables – solar and wind, which is
phase one – we also intend to introduce
nuclear in a gradual and deliberate way.”
SEC recently sanctioned six renewa-
bles projects with a combined capacity
of 300MW. These comprise three 50MW
solar plants, a 50MW wind farm, and
two integrated solar combined cycle
(ISCC) projects, each with a 50MW
solar component (MEES, 19 August).
Riyadh’s earlier nuclear plan, set out by
King Abdullah City for Atomic and Renew-
able Energy (Kacare) in 2013, called for
16 nuclear power plants with a combined
capacity of 18GW by 2032. Progress has
been glacial (MEES, 14 August 2015).
So far Kacare has drafted nuclear
legislation, which has yet to be put before
the Riyadh legislature. Recently Kacare
has signed agreements with a number of
nuclear developers, including one with
Korea in June for a small research reactor
on which to train plant operators. ¶
Saudi plans to sell off 65GW of state-owned generating capacity – an apparent
reference to the entire capacity of SEC, already earmarked for break-up.
SAUDI ARABIA
SAUDI YEAR-END GENERATING CAPACITY (GW)
Generator Plants 2015 15v14 15v10
Saudi Electricity 47 57.14 +2.42 +16.28
Saline Water Conv. Cor. 7 6.22 +1.46 +1.10
Hajr Electricity 1 4.10 +0.68 +4.10
Jubail Water Power 1 2.88 - -0.07
Saudi Aramco 7 1.56 -0.36 +0.55
Durmah Electric 1 1.76 - +1.76
Marafiq 1 1.59 - +0.55
Rabigh Electric 1 1.32 - +1.32
Shuaiba Water Elec. 1 1.19 - -
Tihama Power Gen. 4 1.64 +0.56 +0.56
Shuqaiq Water Elec. 1 1.02 - -
Rabigh Water Elec. 1 0.60 - +0.12
Jubail Energy 1 0.25 - -
Saudi Cement 2 0.23 - -0.04
Tuwairqi Energy 1 0.07 - +0.07
Alaman 3 0.02 - +0.02
Obeikan Paper Indust. 1 0.02 - +0.02
Total 81 81.60 +4.76 +26.34
of which available to SEC* 69.16 +3.65
SEC as % of available 82.6 -0.9
*EXCLUDES OUTPUT CONSUMED BY RELATED INDUSTRY. SOURCE: ECRA.
Jordan’s PM Hani al-Mulki has inau-
gurated a 52.5MW solar PV plant near
Ma’an 230km south of Amman, devel-
oped by the Shams Ma’an JV of Japan’s
Mitsubishi, Qatar’s Nebras and Jordan’s
Kawar. The plant was built by US firm
First Solar at a cost of $170mn. First
Solar was originally a partner in the
project company, but divested its stake
when it was awarded the EPC deal.
Jordan has already brought 43MW
of solar capacity online this year at
Ma’an, in three projects led by Nor-
way’s Scatec, while Spain’s Elecnor
started up an 80MW wind farm nearby.
This takes Jordan’s renewables capac-
ity to 293MW, after the 117MW Tafila
wind farm started up last year.
Jordan’s total generating capac-
ity at the end of 2015 was 4.74GW.
With the decommissioning earlier
this year of the 99MW Hussein steam
turbine plan and the start-up of the
new renewables projects, Jordan’s
total capacity now stands at 4.82GW.
Jordan Starts Up 53MW Of Solar
JORDAN
7. OPEC
©Middle East Petroleum and Economic Publications (Cyprus) Ltd
Reproducing MEES Is Strictly Prohibited
14.October.20167
O
il markets are inching back into bal-
ance.Priceshaveedgedabove$50/B
thanks to Opec’s proposed produc-
tion cuts. But the jury is still out on
the likelihood of serious Opec action to hasten
rebalancing, let alone provide the further boost
to prices many members are calling for. Kingpin
Saudi Arabia has made it clear that it is acting to
prevent prices from increasing too fast with its
officials making statements seemingly aimed
at dampening any short-term price gains.
Opec Secretary General Mohammed
Barkindo spoke confidently about the im-
pact of the group’s planned production cut
and the probability of reciprocal action from
non-Opec producers at the World Energy
Congress in Istanbul on 11 October. But con-
siderable questions remain over whether it
can be implemented when Opec next meets
on 30 November, and indeed whether it
will even help rebalance the market.
IEA Executive Director Fatih Birol told
reporters on the sidelines of the event that he
has two key questions regarding Opec’s plans.
Firstly, the contentious issue of how the targets
will be distributed among Opec’s member states
and secondly, if “that policy works and if there
is upwards pressure on the prices what will be
the reaction from the shale oil production and
how will that once again affect the market?”
Without any Opec action, the IEA expects
the market to rebalance in the second half of
2017 Mr Birol says. This is backed up by data
from its latest Monthly Oil Market Report
(MOMR), released 11 October, which implies
that stocks will only begin to be drawn down
in the fourth quarter next year and then
only by a modest 80,000 b/d (see chart).
There is considerable uncertainty over
what price is required to provide the US shale
industry with renewed impetus, how much
can realistically be brought back online and
over what timeframe. However, preliminary
data indicates that US crude output grew
34,000 b/d last month, the first rise since
March. With data indicating that drilling
has bottomed out, the IEA may be forced to
upgrade its US and non-Opec production
forecasts for the rest of the year and 2017.
Opec’s Internal Obstacles ç
A number of Opec and non-Opec produc-
ers held talks on the sidelines of the confer-
ence on 12 October, but none of the difficult
answers were resolved. Saudi Arabia, on
whom the burden of any production cut
will fall the hardest, left before the meet-
ing, but Energy Minister Khalid al-Falih
at least held a series of bilateral talks with,
among others, his Russian counterpart.
Opec numbers two and three, Iraq and
Iran respectively, however were not present
at the event. The pair pumped 8.1mn b/d
between them last month, 24% of Opec’s
output. Iran, along with Nigeria and Libya,
will be “treated specially” according to Mr
Barkindo as its output rebounds from sanc-
tions. But Iraq poses an altogether different
headache for Opec once its technical com-
mittee meets in Vienna on 28-29 October.
Iraq’s official production figures appear
inflated, most likely due to double-counting
of output around Kirkuk, and it has taken
umbrage at the lower figures provided by
secondary sources. Iraq’s official 4.78mn b/d
for September is a record high and consider-
ably higher than MEES’ figure of 4.48mn b/d,
the IEA’s 4.46mn b/d and the Opec second-
ary sources aggregation of 4.46mn b/d.
Further complicating the matter,
Iraq’s Oil Ministry this week reiterated
claims that the country’s “share” of out-
put is even higher at 4.75-5.0mn b/d.
Mr Barkindo sought to sidestep the is-
sue, saying that every member has “their
own sovereign national aspirations…so
there is no conflict with decisions taken in
Opec.” This appears wishful thinking that
underestimates the scale of the problem.
Turning Point or
A Gentle Hand on the Wheel? √
Where Mr Barkindo and Opec mem-
bers such as Venezuela and Algeria favor
a more interventionist policy from Opec
and non-Opec members alike, Saudi
Arabia and Russia appear to continue to
back a more laissez-faire approach.
Since assuming his position in August,
Mr Barkindo has been busy trying to create a
consensus within Opec. The 28 September Al-
giers agreement was a potential breakthrough,
but is a long way from the “turning point” Mr
Barkindo claims it to be. His comments in
Istanbul that there was need “for a change in
direction” contrasts sharply with Mr Falih’s
statement that “it’s a very gentle hand on the
wheel, we are not doing anything dramati-
cally different and I think that market forces
have shifted significantly through 2015.”
Describing the Saudi approach, Mr Falih said
that the divergence that existed between supply
anddemandin2014whenpricesbegantoslump
was now being reversed. “Opec made its deci-
sion not to intervene because it was a long term
strategy of divergence. And in June I said that
the divergence is being reversed and now we are
seeing the convergence of supply and demand.”
Indeed when touching on the price of
oil, Mr Falih focused more on the risks of
prices spiking rather than falling again. “Opec
needs to make sure that we don’t crimp too
tightly and create a shock to the market” he
said, adding that “there needs to be relief,
but at the same time we don’t want to give
the market the opposite signal and shock
markets into prices that could be harmful.”
Saudi Arabia’s Q3 output hit a record
10.53mn b/d according to MEES estimates.
According to the country’s official submission
to Opec it was an even higher 10.65mn b/d, with
September again in line with this figure. Output
is set to fall from this level regardless of any
Opec agreement as seasonal crude burn falls
OPEC CUT PLANS: WILL THEY HAPPEN? WILL THEY WORK?
WORLD OIL SUPPLY/DEMAND BALANCE BASED ON LATEST IEA PROJECTIONS* (MN B/D)
*PRESUMED FUTURE OPEC OUTPUT UNCHANGED FROM SEP16 REPORT (33.5MN B/D FOR 4Q16 AND 1Q17, 33.7MN B/D FOR 2Q17 AND 33.8MN B/D FOR 3Q 4Q17).
2.5
2.0
1.5
1.0
0.5
0.0
-0.5
-1.0
-1.5
-2.0
-2.5
100
99
98
97
96
95
94
93
92
91
90
Surplus/Deficit
2013 2014 2015 2016 2017
1Q 2Q 3Q 4Q 1Q 2Q 3Q 4Q 1Q 2Q 3Q 4Q 1Q 2Q 3Q 4Q 1Q 2Q 3Q 4Q
World Oil Supply*
World Oil Demand
-0.39 1.32-0.85 1.16-0.25 1.17 0.340.88 0.26 0.09-0.23 2.08-1.18 1.760.62 0.17 0.801.32 0.25 -0.08
SOURCE: IEA, MEES.
Continued on – p8
It’s a very gentle hand on the
wheel, we are not doing anything
dramatically different... Opec needs
to make sure that we don’t crimp
too tightly and create a shock to the
market.”
- Khalid al-Falih, Saudi Energy Minister
8. OPEC
©Middle East Petroleum and Economic Publications (Cyprus) Ltd
Reproducing MEES Is Strictly Prohibited
14.October.20168
and it embarks on maintenance at two refiner-
ies with a total capacity of 785,000 b/d (MEES,
30 September). Output in the previous three
quarters was around 10.2mn b/d, and simply
returning to these levels would mean a reduc-
tion of around 400,000 b/d from September.
This brings Opec to the upper boundary
of the 32.5-33.0mn b/d production target.
Key allies Kuwait and the UAE would likely
chip in with a further 200,000-300,000 b/d
output cut, with smaller contributions
from the likes of Angola and Algeria.
However, sizeable output gains are likely
from Nigeria and Libya in the short term, al-
though there is also significant potential for
subsequent reversals. Add in further incre-
mental gains from Iran and the upshot is that
reaching an agreement whereby sufficient cuts
are made to reach 33mn b/d is far from assured.
Six months, is it enough? Ç
Buthowlongwouldanyoutputcutremainin
place for? According to Mr Barkindo “the over-
whelming majority of views both within Opec
and non-Opec” is that it will last “in the first in-
stance about six months, and then be reviewed.”
Six months from 30 November effectively
means it would be reviewed at the subse-
quent Opec meeting in mid-2017. As this is
when seasonal demand typically leads to
production gains in the Gulf, any produc-
tion limits will come under increasing pres-
sure. Furthermore, Opec’s notional 30mn
b/d production ceiling that was scrapped
in December 2015 was routinely flouted,
highlighting the limits to enforcement.
This will also be when the market is close
to balancing according to data from both the
IEA and Opec. Unlike the IEA, Opec expects
supply to outstrip demand again in Q4 2017
due to a surge in non-Opec production.
Non-Opec Participation ç
Mr Falih says major non-Opec produc-
ers such as Russia, Azerbaijan, Colombia and
Mexico should be at the table in joint ef-
forts to cut production. “Many of them have
indicated that they are eager to work with
us, including in the next few weeks” he says,
adding that they “have been working dili-
gently with us since the start of the year.”
Representatives from non-Opec countries
will be invited to attend the talks in Vienna
later this month, although it’s unclear ex-
actly which countries will be invited. More
uncertain still is how, if at all, they would
contribute to any effort to rein in supply.
Russian figures have said producers need
to work together, and have praised Opec’s
plan to cut output. But while Energy Minister
Alexander Novak has said Russia is willing to
freeze production, he has skirted the issue of
actually cutting output from its September
record high 11.11mn b/d. President Vladimir
Putin was similarly effusive about Opec’s plans
saying Russia supports the group and expects
to see results in November, while veering
away from suggesting Russia might cut.
Even freezing production is no simple
matter for Russia. Igor Sechin, boss of Rus-
sian state oil giant Rosneft and the country’s
leading energy figure told Reuters this week
that his company will not be capping output.
Demand Growth Steady ç
Both the IEA and Opec expect demand
growth to remain strong for the remainder
of the year, and into 2017. They each project
annual growth of around 1.2mn b/d for both
2016 and 2017. While this is a significant
fall from 2015’s growth – put at 1.82mn b/d
and 1.73mn b/d – respectively, it is broadly
in line with growth in previous years.
This is the key point underpin-
ning Saudi Arabia’s stated concerns
over the risk of a future price spike.
Aramco CEO Amin Nasser said in Is-
tanbul that if current trends persist, Saudi
Arabia expects around $1 trillion of invest-
ment in hydrocarbons may be “delayed or
cancelled by the end of this decade.” He added
“I am concerned that the capital deferent
we are currently witnessing” risks causing
global supply growth to fall behind demand
growth and have a “major impact on both
oil prices and the global economy.” ¶
IEA SUPPLY DEMAND FORECASTS OCTOBER 2016 (MN B/D) *FOR FUTURE PERIODS IEA/OPEC ‘CALL’ VERSUS LATEST MEES PRODUCTION ESTIMATE (33.40 MN B/D FOR SEP).
2015 2016 vs'15 2017 vs'16 vs'15 1Q16 2Q16 3Q16 4Q16 1Q17 2Q17 3Q17 4Q17
World Oil Demand 95.04 96.28 +1.24 97.51 +1.23 +2.47 95.48 95.77 96.80 97.04 96.76 96.93 98.13 98.19
chg vs September 16 report +0.20 +0.16 -0.04 +0.19 +0.04 -0.00 +0.10 +0.19 +0.15 +0.18 +0.25 +0.17 +0.16 +0.19
Non-OPEC Supply 57.57 56.62 -0.95 57.05 +0.43 -0.52 57.04 56.05 56.60 56.80 56.59 57.01 57.36 57.23
chg vs September 16 report +0.07 -0.04 -0.11 +0.01 +0.04 -0.06 +0.00 +0.03 -0.01 -0.17 -0.02 +0.02 +0.10 -0.06
OPEC NGLs 6.76 6.91 +0.15 7.04 +0.13 +0.28 6.84 6.86 6.95 7.00 7.01 7.02 7.06 7.07
Call on OPEC crude 30.71 32.74 +2.04 33.42 +0.67 +2.71 31.61 32.85 33.26 33.25 33.16 32.90 33.71 33.88
chg vs September 16 report +0.12 +0.23 +0.10 +0.19 -0.03 +0.07 +0.10 +0.16 +0.16 +0.48 +0.26 +0.15 +0.06 +0.29
OPEC Crude Oil Production 32.29 n/a n/a n/a n/a n/a 32.77 33.03 33.52 n/a n/a n/a n/a n/a
OPEC Production vs Call* +1.58 +0.66 -0.92 -0.02 -0.67 -1.60 +1.17 +0.17 +0.26 +0.15 +0.24 +0.50 -0.31 -0.48
World Oil Supply 96.62 96.65 95.94 97.07
OPEC SUPPLY DEMAND FORECASTS, OCTOBER 2016 (MN B/D)
2015 2016 vs'15 2017 vs'16 vs'15 1Q16 2Q16 3Q16 4Q16 1Q17 2Q17 3Q17 4Q17
World Oil Demand 93.17 94.40 +1.23 95.56 +1.16 +2.39 93.46 93.70 95.15 95.29 94.60 94.75 96.39 96.46
chg vs September 16 report +0.13 +0.13 +0.00 +0.14 +0.01 +0.01 +0.23 +0.16 +0.03 +0.13 +0.23 +0.16 +0.02 +0.13
Non-OPEC Supply 56.98 56.30 -0.68 56.54 +0.24 -0.44 56.93 55.48 56.10 56.69 56.78 56.28 56.20 56.90
chg vs September 16 report +0.06 -0.02 -0.08 +0.02 +0.04 -0.04 -0.01 -0.13 -0.03 +0.12 +0.07 +0.04 +0.01 -0.02
OPEC NGLs 6.13 6.29 +0.16 6.43 +0.14 +0.30 6.24 6.27 6.30 6.34 6.36 6.40 6.45 6.52
Call on OPEC crude 30.06 31.82 +1.76 32.59 +0.77 +2.53 30.29 31.95 32.75 32.26 31.46 32.07 33.75 33.04
chg vs September 16 report +0.07 +0.15 +0.08 +0.11 -0.04 +0.04 +0.24 +0.29 +0.05 +0.01 +0.16 +0.12 +0.02 +0.15
OPEC Crude Oil Production 32.10 n/a n/a n/a n/a n/a 32.50 32.75 33.25 n/a n/a n/a n/a n/a
OPEC Production vs Call* +2.04 +1.58 -0.46 +0.81 -0.77 -1.23 +2.21 +0.80 +0.65 +1.14 +1.94 +1.33 -0.35 +0.36
World Oil Supply 95.21 95.67 94.50 95.65
Continued from – p7
9. ©MiddleEastPetroleumandEconomicPublications(Cyprus)Ltd
ReproducingMEESIsStrictlyProhibitedwww.mees.com14.October.2016
9
¨¨geopoliticalrisk
Egypt: IMF Demands More Reform
Before Cash Release
E
gypt is in line to receive
the first $2.5bn tranche of
a three-year, $12bn loan
(MEES, 23 September)
from the IMF by early November.
But this can only happen once the IMF
board meets to discuss the loan. And be-
fore this happens, “in relation to both ex-
change rate [liberalization] and [cutting]
subsidies there is still a little bit of imple-
mentation to be had,” IMF chief Christine
Lagarde said on 8 October in Washington.
Speaking the previous day IMF
regional director Masood Ahmed said
that Egypt and the IMF are close, but not
quite there, on “wrapping up the financing
required for the first year [of the pro-
gram]… hopefully more than the first year.”
Egypt, with the IMF’s help has been
looking to bridge the “gap of between $5
and $6 billion of bilateral financing which
would come on top of the financing from
the IMF, the financing from The World
Bank and other regional development
banks, and financing that had been already
identified from bilaterals.” China and
Saudi Arabia have already indicated that
they will chip in (MEES, 23 September)
– though a recent political spat related
to Egyptian backing for a Russian UN
resolution on Syria could throw the lat-
ter’s contribution into doubt (see below).
Meanwhile, Mr Ahmed says the IMF has
“also been having some discussions with
some of the G7 countries” on chipping
in. “We’re making very good progress on
it and I’m hopeful we will be able to be
in a position to firm up these financing
pledges in the coming weeks,” he says.
“I will be hoping that by the end of the
month, early next month, we should be in a
position then, to go to the IMF board with
the program,” Mr Ahmed says. The first
$2.5bn tranche would be “made available
within a day or so [of the board meeting]…
there’s no delay,” he adds. The remaining
$9.5bn would be paid in five further install-
ments subject to six-monthly reviews.
Egypt is having to deal with a raft
of issues, growth is “much too low,
budget deficits are high, double digits,
the external position has been weaken-
ing, even though it’s been supported by
a lot of financing from friendly, neigh-
boring countries, and inflation has
been high as well,” Mr Ahmed says.
SAUDI SUPPORT STALLED? ç
As far as Egypt’s foreign support-
ers under the rule of President Sisi are
concerned, Saudi Arabia has been first
among equals. The most recent contribu-
tion was a deposit of $2bn received by the
Central Bank of Egypt (CBE), which saw
the country’s foreign exchange reserves
increase to $19.6bn in September from
$16.9bn in August (MEES, 7 October).
But indications that all is not well in
the bilateral relationship surfaced this
week. In addition to regular cash trans-
fers Saudi Arabia had been providing
Egypt with 400,000 tons/month of diesel
200,000 tons/month of gasoline and
100,000 tons/month of fuel oil on easy
extended credit terms (MEES, 15 April).
But October deliveries appear to have
been cancelled. Though the Egyptian Oil
Ministry’s only official statement says that
“[state oil firm] EGPC has not received
any official correspondences from the
Saudi company, Aramco, regarding the
status of petroleum shipments” it adds
that “EGPC has contracted additional
amounts,” a move that indicates it does
not expect the Saudi volumes to arrive.
Whilst Egypt is clearly heavily reliant
financially on Saudi Arabia and other Gulf
monarchies, the Arab world’s most popu-
lous country, and long its cultural capital,
is also highly sensitive to being seen as
subservient to countries it sees as upstarts.
President Sisi faced a wave of popular
anger when he seemingly ceded sover-
eignty (or handed it back, depending on
your view of events) over some Red Sea
islands to Saudi Arabia earlier this year.
FOREX REFORM NEEDED… ç
Egypt’s debt levels remain high and
“getting rid of the imbalance in the foreign
exchange market” is key to decreas-
ing them, the IMF’s Mr Ahmed says.
“Moving to a foreign exchange sys-
tem which is going to be more flexible
where the price of foreign exchange is
determined by supply and demand, and
where, in fact, foreign exchange is avail-
able more easily to people rather than
having to queue for a long, long time,
as you have to do,” Mr Ahmed adds.
…AND SUBSIDIES ç
Cairo will also need to show the IMF
progress on energy subsidy reform. But
it is more than likely, spending on fuel
subsidies will exceed the E£35bn ($3.9bn
at the official exchange rate of $1 = E£8.88)
allocated in the 2016-17 budget as it used
a Brent crude price assumption of $40/B
and prices last week surpassed $50/B. Oil
Minister Tariq al-Mulla says that Egypt is
looking at every possible way of reduc-
ing its subsidies bill, with the increasing
likelihood that Cairo will have to hike
prices however unpopular that might be.
In anticipation of the reforms
needed to receive the IMF cash, Cairo
hiked electricity prices in August as
it looked to curb its soaring energy
subsidies bill (MEES, 12 August).
Spending on energy subsidies as a
whole fell to E£82.7mn for the 2015-
16 financial year (to June 2016) from
E£95.1bn the previous year. How-
ever this is less than the fall in the
price of Brent crude (see graph).
Power subsidies have actually risen
in recent years, though they are slated
to edge lower this year. However, the
country’s electricity ministry plans to
reduce spending on subsidies to zero by
2018-19 with higher prices for well-off
consumers slated to pay for discounts
for those in lower income brackets.
iRAQ: MORE WORK NEEDED ç
The IMF’s ‘more work needed’ assess-
ment was repeated in an uncharacter-
istically blunt 12 October press release
on Iraq. “Once agreed upon additional
information has been provided and agreed
prior actions have been implemented,
the IMF Board will consider the first
review of the SBA, likely in November
or December,” the IMF said referring
to July’s 36-month $5.34bn ‘Stand By
Arrangement’ (MEES, 22 July). ¶
EGYPT
EGYPT CUTS SPENDING ON OIL SUBSIDIES, BUT BY LESS THAN THE FALL IN CRUDE PRICES,
WHILST SPENDING ON POWER SUBSIDIES RISES (E£ BN)
140
120
100
80
60
40
20
0
SOURCE: EGYPT FINANCE MINISTRY, EGPC, ICE, MEES CALCULATIONS.
Oil Products Subsidies Electricity Subsidies
2009-10 2010-11 2011-12 2012-13 2013-14 2014-15 2015-16 2016-17
Budget
66.5
75.3
95.5
112.1
126.2
13.3
109.2
55.0
27.7
44.6
67.7
96.7
120.0
8.6
108.9
71.5
23.6
74.8
35.0
27.4
Brent
Crude ($/B)
FINANCIAL YEARS ENDING JUNE.
10. ©MiddleEastPetroleumandEconomicPublications(Cyprus)Ltd
ReproducingMEESIsStrictlyProhibitedwww.mees.com14.October.2016
10
ππcorporate
KRG Repayments Cannibalize Revenues
As DNO Cuts Drilling Program
T
he KRG sold $612mn of crude
oil in September, the most
since November 2015, yet
the government retained just
$328mn of this according to the Ministry
of Natural Resources (MNR), the lowest
amount since May. Although payments
to IOCs resumed last month after a
near-50 day hiatus, some have already
pressed pause on their investment plans.
Exports were boosted by the resump-
tion of around 30,000 b/d exports from
fields operated by Baghdad’s North
Oil Company (NOC) in Kirkuk prov-
ince (MEES, 7 October). The gradual
ramp up of the 170,000 b/d Bai Hassan
field following the 31 July attack by the
Islamic State also boosted exports.
Overall, KRG oil sales from the Turk-
ish port of Ceyhan rose 143,000 b/d to
564,808 b/d in September. Refinery runs
have been slashed in recent months as
the KRG has prioritized crude exports,
but some relief was provided in Sep-
tember as they increased 26,000 b/d
to 57,460 b/d; still just a 43% run rate.
Meanwhile, the government brought
to an end two consecutive months of
stock-building, with a 1.21mn barrel draw
down, leaving 2.1mn barrels in storage.
MEES calculates that production
from the KRG increased from 484,000
b/d in August to 582,000 b/d last month.
Further, more modest, production and
export gains appear on the way in October.
OCTOBER SET FOR
RECORD EXPORT REVENUE… √
The upshot is that the value of KRG ex-
ports grew almost 200,000 b/d to $612mn
last month. Again this should grow next
month. KRG exports averaged $36.10/B
in September, an $11/B discount to Brent.
With Brent averaging more than $51/B
in the first two weeks of October, sales
could edge above $700mn this month if
prices and export volumes remain stable.
The higher September revenues
enabled payment to be made to the
three key IOCs – DNO, Genel and
Gulf Keystone – for exports.
However, the $75.8mn was for
July exports and similar amounts
are owed for August and as of 14 Oc-
tober, September exports, while
DNO is still owed $8mn for June.
A further $20mn was “allocated to
Kirkuk petrodollar, other producers
and electricity costs.” Other producers
include Gazprom, operator of the 5,000
b/d Garmian license, HKN, operator of the
3,000 b/d Sarsang field, and Oryx, opera-
tor of the 3,000 b/d Demir Dagh field.
… BUT THAT’S BEFORE REPAYMENTS ç
But the real hit to the balance sheet
was for revenues retained by buyers
against past prepayments. This more
than doubled to $188mn in September,
a record sum for the KRG. Moreover,
where the KRG received $110mn in
new prepayments the previous month,
they received nothing in September.
MEES calculations indicate that this
puts the KRG in the black with its buy-
ers for the year-to-date, and in fact has
paid out around $100mn more than it’s
received. However, this doesn’t mean a sig-
nificant easing of pressure on the balance
sheet. A World Bank report released in
May estimated the KRG had accumulated
cumulative debts of $2.3bn with traders,
so significant sums remain outstanding.
Kurdish media estimate that the
government needs around $430mn each
month to pay public sector salaries, follow-
ing cuts in February (MEES, 5 February),
increasing the risk of further disruptive
industrial action. Last month saw govern-
ment oil revenues fall $100mn short of
this. October has already seen teachers
strike over non-payment and further pub-
lic sector industrial action is very possible.
This feeds into public dissatisfaction with
the dominant Kurdistan Democratic Party
(KDP) and risks exacerbating the growing
rift between the Erbil-based party and its
key rivals the Sulaimaniyah-based Patri-
otic Union of Kurdistan (PUK) and Goran.
DNO: ‘10% RISE,’
BUT FROM A LOWER BASE? √
Norway’s DNO and London-listed
Gulf Keystone have delayed invest-
ment plans due to the recent payment
concerns, although Anglo-Turkish
Genel has maintained that its plans are
unaltered (MEES, 30 September).
The impact of DNO’s cut backs
became clear this week, with its 12
October operational update show-
ing a reduced drilling program.
The firm’s Tawke field averaged
109,159 b/d in Q3, up from 105,000 b/d
in Q2. However, Q2 figures were skewed
by the February-March export pipeline
outage, when output was significantly
curtailed. Production was 118,000 b/d in
July, indicating that output averaged just
105,000 b/d in August and September.
Average Tawke production for the
year-to-date has also been around
105,000 b/d, significantly down on 2015’s
135,200 b/d. Investment cutbacks have
ensured that no month in 2016 has ap-
proached this, with the highest output
of 123,000 b/d coming in January.
DNO has targeted reaching 135,000 b/d
by end-2016, but the latest update, while
keeping the output target, has dropped
any mention of a timeframe. The firm had
announced in its August’s Q2 update that
five wells would be drilled at Tawke in the
second half of the year (three in the Creta-
ceous reservoir, averaging $9mn each, and
two in the shallower Jeribe at $3mn each).
This $33mn program has now been
cut to four wells totaling less than $20mn,
and DNO has cancelled plans to oper-
ate a third drilling rig from September.
The Tawke-31 well in the Cretaceous,
along with Tawke-33 and Tawke-34 in
the Jeribe have now been completed
in line with the original plan and will
enter production imminently.
The fourth well, Tawke-37 is to be
spudded next week, but this was not
listed on the original drilling plan.
Given the costings, it would appear that
the well will be in the Jeribe reservoir,
meaning that the firm has cut the two
more expensive Cretaceous wells.
While in the August Q2 report DNO
said the five wells would add 10% to exist-
ing capacity of 120,000 b/d, the latest
update says 10% will be added from just
four, but doesn’t quantify current capac-
ity. Natural decline may mean the 10% is
from a reduced base and hence the 10%
increase would therefore be smaller. ¶
IRAQ
KRG 2016 Monthly Crude Oil Sales Overview
Jan Feb Mar Apr May Jun Jul Aug Sep
Sales at Ceyhan (‘000 B/D) 614 414 300 515 515 514 490 412 565
Exports to Ceyhan (‘000 B/D) 602 350 327 512 513 500 511 484 524
Value of Exports* ($mn) $423 $294 $270 $489 $555 $562 $495 $414 $612
Payments for Liftings ($mn)^ $650 $304 $407 $376 $391 $591 $433 $433 $423
Implied Overpayment ($mn) $227 $10 $137 -$113 -$164 $29 -$62 $19 -$188
IOC Payments ($mn) $75 $71 $36 $59 $75 $112 $43 $83 $96
Amount to KRG ($mn) $575 $233 $332 $305 $315 $479 $390 $350 $328
*INCLUDES OFFSET LIFTINGS ^INCLUDES PREPAYMENTS SOURCE: MNR, MEES CALCULATIONS.
11. ©MiddleEastPetroleumandEconomicPublications(Cyprus)Ltd
ReproducingMEESIsStrictlyProhibitedwww.mees.com14.October.2016
11
^^economicsFinance
Saudi Debt Doubles, Further Rise Planned
With Imminent Bond Launch
S
audi Arabia this week
kicked off the roadshow for
the launch of its planned
$15bn debut international
bond with representatives from the
kingdom promoting the issue in Lon-
don to be followed by New York.
Citi, HSBC and JP Morgan have
been hired as lead managers: also
involved are Bank of China, BNP
Paribas, Deutsche Bank, Goldman
Sachs, Morgan Stanley, Mitsubishi
UFJ, and Saudi bank NCB Capital.
The kingdom plans to use the proceeds
to help fund the 2020 National Transfor-
mation Program (NTP), as well as to make
good on delayed payments to contractors
and others. The planned bond has received
an AA-rating from Fitch, contingent
on the receipt of final documents.
According to the bond prospectus seen
by Bloomberg, Saudi capital expendi-
ture is being slashed by 71% to $20.6bn
in 2016 from $70.3bn in 2015, while
the budget deficit is projected to fall to
13.5% of GDP in 2016 from 15% in 2015.
DEBT DOUBLES
IN FIRST 8 MONTHS OF 2016… √
Latest numbers from the Saudi Arabian
Monetary Agency (Sama), the kingdom’s
central bank, show public debt hitting
SR274bn ($73bn) at end-August 2016,
almost double the SR142bn ($38bn)
end-2015 level which equated to 5.9% of
GDP. Debt is now six times the end-2014
low of SR44bn (1.6% of GDP – see chart).
That said, even the current rela-
tively-elevated debt level of around
11.5% of GDP is very low by interna-
tional standards: US debt is 72% of
GDP and Japanese debt over 200%.
…BUT ‘NO NEED TO PANIC’ Ç
Speaking at the World Energy Congress
in Istanbul on 10 October, Saudi Energy
Minister Khalid al-Falih said “there is no
reason to panic. We essentially have one
of the lowest debt [levels in the world].”
Indeed this near-absence of leverage
“is really not healthy,” he adds. “So we are
reconstructing our balance sheet, freeing
up some of that equity on the balance
sheet to be invested for productive uses.”
Though the country’s budget
deficit and falling reserves due to the
collapse in oil prices since mid-2014
may be the proximate reason, “raising
debt needs to happen anyway no mat-
ter what the oil prices are,” he says.
This is a view shared by the IMF in
its 13 October “Selected Issues” report
on the kingdom. The IMF speculates
that it might be valuable for the king-
dom to increase borrowing above the
level needed to balance its deficit in
order to increase its asset holdings.
ARAMCO IPO SLATED FOR 2018 Ç
Of course boosting its assets is also cen-
tral to Vision 2030, with Saudi Arabia con-
tinuing to prepare for its planned 5% IPO
of state energy firm Saudi Aramco in 2018.
A 5% stake is expected to raise at least
$100bn (valuing Aramco at $2 trillion-
plus), although Aramco CEO Amin Nasser
says the size of the exact stake has yet to
be decided upon. On timing, Mr Nasser
says that the market is now recovering
and “we expect it to recover even more in
2017, and I think the time in 2018 will be
almost right.” All potential listing loca-
tions remain on the table for the king-
dom, including New York, London, Hong
Kong and Tokyo according to the CEO.
As well as helping to diversify the
economy – the key tenet of Saudi Arabia’s
Vision 2030 – and acting as a hedge
against oil price volatility, assets serve
as collateral against debt and therefore
help reduce borrowing costs. These are
already at historic lows which makes
tapping capital markets a more appeal-
ing prospect than in previous years.
In April, Saudi Arabia signed a $10bn
loan agreement with a consortium of
international banks, marking its first foray
into international markets. For the IMF,
this carries both upsides and downsides.
Along with alleviating pressure on Saudi
Arabia’s domestic markets, foreign invest-
ment has the potential to boost transpar-
ency in the kingdom. Potential risks and
complications flagged up by the IMF
include the threat of reversal of capital
flows and “risks relating to the currency
composition of debt and the foreign ex-
change rate” – although the kingdom’s peg
against the dollar greatly mitigates this.
Adding debt to the balance sheet
enables Saudi Arabia to reduce the need
to draw down its foreign assets. Sama
holdings in August were down 15.1%
year-on-year, at $562bn. But the rate has
fallen substantially since the beginning
of the year – January was 18% down on
the previous year – and current projec-
tions imply reserves could end the year
down 13% annually. The kingdom is
evidently looking to fill its budget black
hole in a more balanced fashion than in
previous years with a strategy of tap-
ping domestic and international markets
along with its own foreign reserves.
‘DEBT MANAGEMENT OFFICE’ Ç
The Saudi Ministry of Finance this
week completed the establishment of a
Debt Management Office (DMO), whose
main objective will be to secure the best
solutions for the kingdom’s financing
needs at the lowest cost in the “short,
medium and long term with risks compat-
ible with the kingdom’s fiscal policies.”
In May the ministry hired Fahd al-Saif
a top Saudi banker in charge of global
markets at HSBC Holdings to set up the
DMO at the ministry and handle the
kingdom’s first international bond issue.
The DMO is part of the structural,
economic and fiscal reforms envisaged
in the 2020 NTP to achieve Saudi Vision
2030. These reforms are part of the
shakeup of the Saudi economy to reduce
dependence on oil revenue, initiated by
Deputy Crown Prince Muhammad bin
Salman. As part of the kingdom’s strat-
egy to develop the debt capital markets,
the government plans to register, list
and trade government debt instruments
on the Saudi Stock Exchange. ¶
Saudi arabia
SAUDI FOREIGN ASSETS DOWN, DEBT SOARS
($BN, END PERIOD)
800
700
600
500
400
300
200
100
0
80
70
60
50
40
30
20
10
0
2011 2012 2013 2014 2015 Aug-16
535
36
717
16
616
38
648
22
732
12
562
73
SOURCE: SAMA, MEES CALCULATIONS.
Net Foreign Assets Public Debt
We have one of the lowest debt
levels... It is really not healthy.
We are reconstructing our
balance sheet to be invested for
productive uses.”
- Khalid al-Falih, Saudi Energy Minister
12. ©MiddleEastPetroleumandEconomicPublications(Cyprus)Ltd
ReproducingMEESIsStrictlyProhibitedwww.mees.com14.October.2016
12
^^economicsFinance
Algeria Gets Real
With $50/B 2017 Budget Oil Price
A
lgeria is finally adopting a
realistic oil price of $50/B in
its 2017 draft budget, instead
of the $37/B “reference fiscal
price” which was assumed in all previous
budgets since 2009. This bore no resem-
blance to actual market prices, especially
at times when the price of Algeria’s Saha-
ran Blend crude was well over $100/B.
Not only has Algeria shifted to a
market-related oil price, but it is also
abandoning its awkward practice of
understating oil revenue and exaggerating
the deficit. This was done by accumulat-
ing any surplus oil revenue derived from
the difference between realized market
prices and the lower reference price of
$37/B into a reserve fund, the Fond de
Regulation des Recettes (FRR), from
which off-budget allocations were made at
the end of each year to finance the deficit.
As of 2017 this accounting practice will
be discontinued and all hydrocarbons
revenue will accrue to the budget.
SPENDING SLASHED ç
The 2017 draft budget, approved by
cabinet on 4 October, cut spending by
14% in nominal terms (to AD6,883bn:
$62.6bn at official budget exchange rate
of $1=AD110), an eye-watering real-terms
cut of almost 18% if the IMF’s 4.8% 2017
inflation forecast is factored in (see table).
Current spending falls by 9% in real
terms, with social spending slated for
a 15% fall – a brave move given fears
of popular unrest. Unemployment is
projected to rise to 10.4% in 2017 from
9.9% in 2016, according to the IMF.
But capital spending will be slashed
by a massive 28% (31% in real terms) to
AD2,291bn ($20.8bn) in 2017, with plans
to delay or postpone some infrastructure
projects. After previously claiming that oil
and gas capex would not be cut, Sonatrach
in April quietly slashed its five-year
spending plan by $17bn to $73bn, a 19%
cut (MEES, 27 May). That said, falling
costs mean that so far drilling activity
has remained at near-record levels (see
p3), with a $1.4bn EOR contract at the
aging giant Hassi R’mel gas field recently
awarded to Japan’s JGC, Reuters reports.
In the first eight months of 2016 oil
and gas exports brought in just $16.46bn,
down 30% on the same period a year
earlier which in turn was 40% below
2014 levels. An indication of just how
dependent Algeria is on hydrocarbons
is that even with the revenue collapse
oil and gas still provided 94% of export
revenue: the figure was 97% in 2014.
wAlgeria recorded a trade deficit of $14bn
in the first eight months of 2016. Even
factoring in a modest ‘recovery’ with
higher oil prices in the last months of
2016 the country is on course for a record
$20bn deficit, up almost 50% on 2015.
On the revenue side expectations of
a 30.7% rise in oil and gas revenues on
first glance look optimistic. However the
baseline 2016 budget figure was based on
$37/B crude. Saharan Blend is actually
on track to average just shy of $45/B this
year. Factoring this in the 2017 budget
implies a 5.8% dollar-terms increase
to $22bn, substantially less than the
expected 23% oil price increase cur-
rently factored in by futures markets.
Perhaps more optimistic, especially
given spending cuts which are bound to hit
income, are plans to raise non-hydrocar-
bon revenue by a nominal 7%. VAT will be
raised from 17% to 19% (from 7% to 9% for
“reduced rate” products) whilst ‘luxury’
taxes will cover new items. In 2016 taxes
were raised on cars with large-capacity en-
gines,exoticfruit,salmonandcaviar.Taxes
on tobacco will be raised by up to 100%.
The draft budget projects mod-
est increases in hydrocarbons rev-
enue after 2017: AD2,360bn in 2018
and AD2,644bn in 2019, without
specifying an oil price assumption.
The budget projects a nominal fall
of 61% in the 2017 deficit to AD1,247bn
($11.3bn) – whether or not this can
be achieved will depend on whether
the spending cuts can be made to
stick… and of course oil prices.
Should oil prices fall below $50/B
Algeria will face significant budget prob-
lems: spending would have to be further
slashed, hitting economic activity. Becom-
ing less of an option is further drawing
down reserves, given that these are set
to fall to $116bn by end-2016 (MEES, 12
August). Another option, devaluation of
the dinar, will introduce new problems
for a country dependent on imports.
The draft budget makes no mention of
previously-reported supposed govern-
ment plans to allow foreign investors
to buy controlling stakes in state banks.
Before this could happen Algerian state
banks would have to list on the local stock
exchange, a move that is expected to help
develop Algeria’s financial markets and
diversify the sources of funding in the
aftermath of the oil price collapse. The
draft budget is expected to be approved by
parliament with only minor amendments,
given that Mr Bouteflika’s supporters
enjoy parliamentary majority. ¶
ALGERIA
ALGERIA’S BUDGETS (AD BN)
2017 vs 2016 (%)
2017 Nominal **Real 2016 2015 2014 2013
REVENUE 5,636 +18.7 +13.3 4,748 4,952 4,218 3,820
Oil Gas Revenue 2,200 +30.7 +24.7 1,683 1,723 1,578 1,616
‘Ordinary’ Revenue 3,436 +12.1 +7.0 3,065 3,229 2,640 2,204
SPENDING 6,883 -13.8 -17.7 7,984 7,588 7,656 6,880
Current Spending (Ministries) 4,592 -4.5 -8.8 4,807 3,807 4,714 4,336
of which: Social Spending 1,631 -11.4 -15.4 1,840
Capital Spending 2,291 -27.9 -31.2 3,177 3,781 2,942 2,544
SURPLUS/DEFICIT -1,247 -61.5 -63.2 -3,236 -2636 -3,438 -3,060
AD per $ (budget figure) 110 +12.2 98 98 80 76
AD per $ (actual)^ 110.5 +1.4 109 99 80.5 79.6
Budget Oil Price ($/B) 50 +35.1 37 37 37 37
DOLLAR TERMS: Revenue ($bn) 51.2 +5.8 48.4 50.5 52.4 48.0
Spending ($bn) 62.6 -23.2 81.5 77.4 95.1 86.4
Deficit ($bn) -11.3 -65.7 -33.0 -26.9 -42.7 -38.4
WITH ACTUAL OIL PRICE ($/B)* 55 +22.8 44.8 52.79 99.86 108.35
Oil Gas Revenue 22.0 +5.8 20.8 25.1 53.2 62.3
AD bn 2,420 +18.8 +13.3 2,038 2,458 4,258 4,732
Total Revenue ($bn) 53.2 +2.2 52.1 58.0 86.2 91.3
AD bn 5,856 +14.8 +9.5 5,103 5,687 6,899 6,936
Surplus/Deficit ($bn) -9.3 -68.2 -69.7 -29.4 -19.4 -8.9 4.8
*FOR 2016 ACTUAL JAN-SEP AVG. ($42.41/B FOR SAHARAN BLEND), $52/B FOR OCT-DEC. FOR 2017 $55/B IN LINE WITH THE CURRENT (14 OCT)
BRENT FUTURES STRIP. **PRESUMES 4.8% 2017 INFLATION (IMF FORECAST), ^LATEST EXCHANGE RATE FOR 2017. YEAR TO DATE FOR 2016.
SOURCE: ALGERIA’S OFFICIAL GAZETTE, APS, OPEC, IMF, OANDA, MEES CALCULATIONS.
13. ©MiddleEastPetroleumandEconomicPublications(Cyprus)Ltd
ReproducingMEESIsStrictlyProhibitedwww.mees.com14.October.2016
13
^^economicsFinance
Gulf Equity Markets:
Change Is Afoot
I
t has been easy to overlook
the considerable changes
that have been taking
place across the Gulf eq-
uity markets, given the bumper year that
GCC conventional bond issuance has
been enjoying – well over $50bn for the
year to date (MEES, 23 September).
But 2016 has seen a raft of new
regulations implemented and mooted,
along with the launch of new products.
On 1 September the Nasdaq Dubai ex-
change began trading single-stock futures
on shares in seven of the UAE’s biggest
companies accounting for almost half UAE
markets’ traded value. This marks a major
development for equity markets in the
UAE, where short-selling is restricted and
lack of opportunities to hedge has been
a key concern among foreign investors.
With the exception of Kuwait, Gulf
Arab stock markets have been slow to in-
troduce futures – agreements to buy or sell
shares at an agreed price on a future date –
and options. Nasdaq Dubai unfortuitously
launched equity derivatives in 2008 at the
height of the financial crisis and therefore
trading failed to reach critical mass.
But UAE markets are now much more
developed than in 2008. The investor base
is more sophisticated, including an open-
ness to international investors, especially
afterthecountry’sinclusionintotheMSCI
and FTSE emerging markets indexes.
IN FROM THE FRONTIER ç
In May 2014, global index provider
MSCI upgraded UAE and Qatar from fron-
tier to emerging market status. This move
has enabled both markets to improve li-
quidity and increase foreign capital inflow,
given that more than $7.3trillion of funds
track the MSCI emerging markets index.
In May 2014, the UAE’s MSCI weight-
ing accounted for 0.4% with around
$370mn of passive inflow; for Qatar
the figures were 0.45% and $450mn.
Both weights were subsequently
hiked in May 2015 – to 0.6% UAE and
0.9% Qatar, allowing more inflows.
The introduction of futures is aimed
at further drawing fresh money into
UAE equity markets. While trading has
got off to a slow start, it is expected that
volumes will increase in coming months
as investors become familiar with them.
“Futures are the next natural step for
emerging markets, especially at the UAE
financial markets’ current life cycle stage.
They are the most basic form of deriva-
tive but have been highly successful in
the markets they have been introduced
into, so much so that futures market
volume has often exceeded cash equity
volume,” Ross Abbott, Head of Capital
Markets at SHUAA Capital, a Dubai-based
financial services provider, tells MEES.
SHUAA Capital is acting as the
sole market maker for the futures,
and working alongside six brokers: Al
Ramz Capital, EFG Hermes, Integrated
Securities, Menacorp, Mubasher Fi-
nancial Services and Arqaam Capital.
“We think that this is an integral step
towards increased foreign interest in the
UAE and the overall improvement in the
market infrastructure. Over time their
introduction could be a game changer, as
in most developed markets derivative mar-
kets represent a multiple of cash markets,”
Jaap Meijer, Dubai-based research chief
at specialist emerging markets invest-
ment bank Arqaam Capital tells MEES.
“It is also worth noting that the UAE is
now starting to target developed market
status in the MSCI indexes, and a devel-
oped futures market will definitely help its
chances. Usually the options are actively
used by retail clients, while futures are re-
served for mostly institutional investors.”
The exchange aims eventually to
develop futures based on UAE stock
indexes as well as single-stock futures
for companies listed elsewhere in the
region, according to Hamed Ahmed
Ali, chief executive of Nasdaq Dubai.
There are also currently moves to
introduce Islamic hedging into the
UAE market. On 11 October, the Dubai
Financial Market (DFM) published draft
rules covering sharia-compliant hedg-
ing which define possible substitutes for
conventional derivatives-based hedging.
SAUDI SHAKE-UP ç
However, the most sweeping and radi-
cal regulatory changes are those relating
to Saudi Arabia’s exchange, Tadawul.
As the region’s largest exchange
with a market capitalization of al-
most $400bn, it has also historically
been the most impenetrable market
but times are certainly changing.
On 3 May, Saudi’s Capital Markets
Authority (CMA) announced three initia-
tives aimed at boosting foreign participa-
tion in the Saudi equity market. They
consist of increasing foreign investment
limits, moving from a T+Zero to T+2
settlement cycle for securities and the
introduction of securities lending and
covered short selling regulations. The
proposed changes will be the subject of
new regulations published by the CMA
in the first half of 2017 (MEES, 20 May).
“Whilst some of these amendments
focused on loosening previous rules on
participation and ownership levels of QFIs
[Qualified Foreign Investors], another
strand of these reforms introduced new
types of trading options and settlement
processes, in line with international
standards,” notes a May 2015 report
from local investment bank Jadwa.
“As the region’s largest, diverse and
Gulf equity markets have been slow to develop and liberalize. But 2016 has seen
the introduction of potentially-transformative new products and regulations.
REGIONAL
Continued on – p14
SAUDI CAPITAL MARKETS AUTHORITY RELAXES
QUALIFIED FOREIGN INVESTOR RULES
WAS NOW
Assets Under
Management (min)
$5bn $1bn
Max stake/investor 5% 10%
Max overall QFI/firm 20% *49%
Accepted QFI
institutions
banks as prev. plus
brokerages SWFs
securities university
endowmentsfund managers
insurance
*Foreign investors including residents and non-residents,
swaps and QFIs. SOURCE: JADWA.
TADAWUL: QFI NET MONTHLY INFLOWS (SR mn)
600
500
400
300
200
100
0
-100
2015 2016
a s o n d j f m a m j j a
SOURCE: TADAWUL.
-3
+85
+579
+65
+24 -28
+41
+93
-77 +9
+157
-2 +7
14. ©MiddleEastPetroleumandEconomicPublications(Cyprus)Ltd
ReproducingMEESIsStrictlyProhibitedwww.mees.com
14.October.2016
14
COUNTRYREGIONAL
most mature capital market, these rules,
when applied, during H1 2017, will mean
that Tadawul will lead the region in being
the first to introduce market instruments
and processes that not only increase
market liquidity, but also add to institu-
tional confidence and investor choice.
Whilst these latest set of rules/amend-
ments form a part of a long-standing plan
to further open up Tadawul, they have
been given added impetus as a result
of the broader reforms set out by the
Saudi Vision 2030 plan,” Jadwa says.
Unveiled by Saudi’s Deputy Crown
Prince Muhammad bin Salman on 25 April
this year, Saudi Vision 2030 is a roadmap
for economic structural change. It aims
to end the kingdom’s dependence on oil
by 2020 and to boost non-oil revenue by
an additional SR600bn ($160bn) by 2020
and by SR1 trillion ($266bn) by 2030
from SR163bn in 2015 (MEES, 29 April).
Stung by a more than 50% drop in
the price of oil in the past two years,
the kingdom has been on an unprec-
edented drive to open its markets in
order to lure foreign cash to the coun-
try – this fits into one of the Vision’s
broader goals to increase FDI to 5.7%
from its current 3.8% of GDP by 2030.
The CMA had relaxed the limits on
QFIs in June 2015, allowing foreign-
ers to buy shares directly in the Tad-
awul – previously foreigners could only
invest indirectly using derivatives sold
by Saudi intermediaries. This measure
was hailed as historic but its success to
date has proven to be rather subdued.
Data from the Tadawul shows that for
the 12-month period to July 2016, net
inflow from QFIs amounted to SR944mn,
equivalent to less than 0.1% of market
capitalization of SR1.5 trillion (see chart).
“The uptake has been limited, due
to, in our view, the very stringent QFI
criteria and approval process that made
it very difficult for investors to actually
sign up, in addition to the challenging
macro environment that Saudi Arabia
has been facing since the oil price started
to drop in 2014,” says Mr Meijer.
“This has made the country less at-
tractive to foreign investors. It is also
worth noting that the uptake of the
[earlier] participatory notes (P-note)
program was also initially slow, though
not as slow as the current QFI program.”
On 4 September 2016, the CMA eased
restrictions on who can qualify as a foreign
investor in an attempt to boost inflows into
the market (see table). However, it will
take time for the full benefit of this regula-
tory change to take hold according to one
industry expert. “This was a very positive
surprise – I did not expect the easing to
come that quickly following the initial
opening up to foreigners. There have been
several media reports saying the relaxa-
tion of QFI limits was a disappointment
because it didn’t lead to a wall of money
coming in but this was never the intention
of the Saudi policy-makers,” Dr Ryan Le-
mand, Managing Director, head of wealth
and asset management at Abu Dhabi-
headquarteredADSSecurities,tellsMEES.
“Institutional investors have tradition-
ally invested in the Saudi market through
P-notes. The changeover from P-notes
into direct investing requires institutional
investors to change mid-office, back office
and settlement processes etc. So it will
take time for institutional investors to
gradually switch from P-notes to direct
investing - it will not be a binary thing
where they suddenly flick the switch
overnight and change how they invest.”
On 18 August, the CMA approved
another significant regulatory change
that will come into effect next year. As of
January 2017, foreign investors are to be
allowed, for the first time, to invest directly
in Saudi stocks at the time of their IPOs.
By allowing foreign investors ac-
cess to IPOs, the kingdom may not only
attract more private listings, but also
break the monopoly that Saudi inves-
tors, and by extension Saudi banks, have
historically had on IPOs in Riyadh.
“Allowing foreigners to participate
in IPOs is another welcome and sensible
step in the direction of fully opening up
the Saudi equity market. The dominant
participants have been local institutional
funds and local authorized persons, with
some participation from the local retail
investor base. Many IPOs saw significant
price volatility in the early stages of listing
which might have created some uncertain-
ty in the market,” Andrew Brudenell, Port-
folio Manager, Frontier Market Equities at
specialist emerging markets (EM) invest-
ment manager Ashmore, tells MEES.
“The advantage of opening up the IPO
process to all should be better price discov-
ery, hopefully leading to less price volatil-
ity, and it should give management teams
early access to foreign investors who can
give feedback on disclosures and general
investor communication. In fact, I believe
this latter point has been a key reason for
opening up the equity market in general.”
Furthermore, on 7 September, Saudi
Arabia announced that it will launch a
new stock market aimed at small and
mid-cap companies that it plans to
launch at the end of February 2017.
Regulators are proposing lower listing
requirements of minimum capitaliza-
tions to SR10mn ($2.7mn) – 10% of the
capitalization required for the main
market. Companies would be permitted
to float a minimum of 20% of their shares
and have as few as 50 public shareholders,
compared to 30% and 200 shareholders.
Some industry observers have com-
mented that along with improving busi-
nesses’ access to capital, the kingdom is
also keen to reduce the financing burden
onSaudibanksgiventhecurrenttightened
liquidity. The three-month Saudi Inter-
bank Offered Rate, a key benchmark used
for pricing loans, rose to 2.308% on 29 Au-
gust, its highest level since January 2009,
according to data compiled by Bloomberg.
Supporting SME entrepreneurship,
privatization and investments in new
industries has been identified as a key
pillar of the Saudi Vision 2030 that is
targeting raising SME contribution to
GDP from 20% to 35% and for SMEs to
be allocated up to 20% of government
funding by 2030 (MEES, 29 April).
“I don’t think the market is being cre-
ated to take pressure off the local banks.
Many of these companies don’t source
a lot of capital from the banks but from
other private sources,” says Mr Brudenell.
“In addition, the idea of a secondary
market has been in the works for some
time and over this period the bank-
ing sector has largely been liquid. The
secondary market brings more depth
and breadth to the Saudi equity offer-
ing and works towards making it more
representative of the overall economy.”
The successful implementation of
the outlined reforms will prove crucial
for Saudi Arabia’s much-anticipated
inclusion into the MSCI Emerging
Market Index. The speed at which they
are being rolled-out is leading some
industry analysts to predict that inclu-
sion will happen earlier than expected.
MSCI highlighted four key concerns
around Saudi Arabia’s inclusion during its
June 2016 review, namely: low first order
linear system (FOLs), delivery versus
payment (DvP), segregated accounts and
very complicated QFI registration process.
The Arqaam Capital report notes that:
“On our numbers, we expect Saudi to
have a weight of c.2.5-4.0% in the MSCI
EM Standard Index which should result
in passive inflows of c.$6-8bn. In addi-
tion, a $100bn IPO of Aramco should
bring the total KSA weight to 4.7-6.1%
with total passive inflows of c.$10-13bn.”
2018: ARAMCO BOOST? ç
A 5% sale of Saudi Aramco, the world’s
largest state-owned oil company, is
currently slated for early 2018. Deputy
Crown Prince Muhammad bin Salman
estimates Aramco is worth $2-3 trillion,
which means a 5% listing could in theory
raise $100-150bn for the kingdom. This
would become the largest IPO in history.
In addition to the Aramco IPO, sev-
eral government assets in the aviation
sector are being prepared for a listing,
along with the Saudi bourse itself whose
market capitalization stands at $383bn.
The government has publicly an-
nounced that it is looking to increase
the number of listed companies on the
Tadawul from its current 170 to 250
within the next seven years. It recognizes
that developing the equity markets by
undertaking an unprecedented overhaul
of regulation and adding new listings can
serve as an invaluable source of revenue
for the economy going forward. ¶
Continued from – p13
^^economicsFinance
15. ©Middle East Petroleum and Economic Publications (Cyprus) Ltd
Reproducing MEES Is Strictly Prohibited
14.October.201615
selected data
Sep15 Oct15 Nov15 Dec15 Jan16 Feb16 Mar16 Apr16 May16 Jun16 Jul16 Aug16 Sep16 Oct16 Nov16
ALGERIA (vs Dated Brent)
Saharan Blend (45.7°) +0.75 +0.95 +1.00 +0.43 +0.53 +0.80 +0.90 +0.85 +0.90 +0.70 +0.30 +0.50 +0.40 +0.05
DUBAI
Dubai (31°, vs Oman) +0.00 -0.05 -0.20 -0.25 -0.25 -0.50 +0.00 -0.20 -0.20 -0.20 +0.00 +0.15 +0.00 -0.25 -0.15
outright price 56.33 47.83 45.56 45.78 42.03 34.09 27.40 30.03 36.14 39.20 44.33 46.75 43.40 43.77 43.77
IRAN
to Asia (FOB Kharg Island, vs Oman/Dubai average)
Iranian Light (33-34°) +0.60 +0.25 -1.45 -1.15 -1.20 -0.60 -0.80 -0.50 -0.60 +0.50 +0.85 +0.45 -0.85 +0.00 -0.25
vs Saudi Arab Light +0.20 +0.15 +0.15 +0.15 +0.20 +0.20 +0.20 +0.25 +0.25 +0.25 +0.25 +0.25 +0.25 +0.20 +0.20
Iranian Heavy (30-31°) -0.85 -1.37 -3.27 -2.97 -3.30 -2.60 -2.60 -2.60 -2.60 -1.60 -1.25 -1.45 -2.45 -1.50 -1.60
vs Saudi Arab Medium -0.05 -0.07 -0.07 -0.07 -0.10 -0.10 -0.20 -0.20 -0.20 -0.30 -0.25 -0.25 -0.25 -0.25 -0.25
Foroozan (31°) -0.68 -1.20 -3.10 -2.80 -3.13 -2.43 -2.43 -2.43 -2.43 -1.40 -1.05 -1.25 -2.25 -1.30 -1.40
Soroosh (18.6°) (vs Iranian Heavy) -6.30 -6.78 -6.78 -6.68 -6.65 -6.45 -5.70 -5.65 -5.65 -5.60 -5.55 -5.45 -5.45 -5.45 -5.35
Norooz (20.6°) (vs Iranian Heavy)* -6.30 -6.78 -6.78 -6.80 -6.65 -6.45 -5.70 -5.65 -5.65 n/a n/a n/a n/a n/a n/a
to Northwest Europe/South Africa (FOB Kharg Island, vs BWAVE)
Iranian Light (33-34°) -3.00 -3.55 -3.50 -3.50 -4.30 -4.85 -4.95 -4.65 -4.60 -4.40 -4.75 -4.55 -4.30 -4.75 -5.20
Iranian Heavy (30.7°) -4.40 -5.15 -5.10 -5.10 -6.00 -6.55 -6.30 -6.20 -6.45 -6.40 -6.85 -6.40 -5.80 -6.40 -6.70
Foroozan (31°) -4.20 -4.95 -4.90 -4.90 -5.80 -6.35 -6.10 -6.00 -6.25 -6.20 -6.65 -6.20 -5.60 -6.20 -6.50
to Mediterranean (FOB Kharg Island, vs BWAVE)
Iranian Light (33-34°) -4.40 -3.95 -4.45 -5.00 -4.55 -4.70 -4.95 -5.00 -5.05 -4.75 -4.85 -5.30 -4.70 -5.45 -5.55
Iranian Heavy (30-31°) -5.65 -5.35 -5.75 -6.25 -5.95 -6.05 -6.40 -6.50 -6.85 -6.75 -7.05 -7.20 -6.25 -7.15 -7.15
Foroozan (31°) -5.45 -5.15 -5.55 -6.05 -5.75 -5.90 -6.25 -6.30 -6.65 -6.55 -6.85 -7.00 -6.05 -6.95 -6.95
Soroosh (18.6°) -10.15 -10.15 -10.45 -10.95 -10.85 -10.85 -10.25 -10.35 -10.95 -10.75 -11.20 -11.05 -9.65 -10.95 -11.15
Norooz (20.6°)* -10.15 -10.15 -10.45 -10.95 -10.85 -10.85 -10.25 -10.35 -10.95 n/a n/a n/a n/a n/a n/a
FOB Sidi Kerir (vs BWAVE)
Iranian Light (33-34°) -3.00 -2.45 -2.90 -3.55 -3.30 -3.45 -3.65 -3.50 -3.50 -3.20 -3.30 -3.75 -3.10 -3.75 -3.80
Iranian Heavy (30-31°) -4.25 -3.85 -4.20 -4.80 -4.70 -4.70 -5.00 -5.00 -5.30 -5.20 -5.50 -5.65 -4.65 -5.45 -5.40
Foroozan (31°) -4.05 -3.65 -4.00 -4.60 -4.50 -4.55 -4.85 -4.80 -5.10 -5.00 -5.30 -5.45 -4.45 -5.25 -5.20
IRAQ
to Asia (vs Oman/Dubai average)
Basra Light (FOB) -1.45 -1.95 -3.70 -3.35 -3.45 -2.80 -2.60 -2.60 -2.50 -1.40 -1.10 -1.30 -2.30 -1.40 -1.45
vs Saudi Arab Medium -0.65 -0.65 -0.50 -0.45 -0.25 -0.30 -0.20 -0.20 -0.10 -0.10 -0.10 -0.10 -0.10 -0.15 -0.10
Basra Heavy (FOB) -5.55 -6.65 -8.65 -8.15 -8.20 -7.30 -6.30 -6.55 -6.60 -5.70 -5.60 -5.75 -6.40 -5.70 -6.15
to Europe (vs Dated Brent)
Basra Light (FOB) -5.15 -4.60 -4.60 -5.25 -4.75 -5.05 -4.95 -4.85 -5.00 -4.65 -4.85 -4.70 -3.95 -4.70 -4.90
Basra Heavy (FOB) -9.10 -9.75 -10.35 -10.55 -10.30 -10.40 -9.60 -9.60 -9.75 -9.30 -9.45 -8.95 -7.95 -8.75 -9.15
Kirkuk (FOB Ceyhan) -5.15 -4.60 -4.60 -5.05 -4.65 -4.65 -4.50 -4.55 -4.55 -4.45 -4.40 -4.30 -4.05 -4.85 -4.85
to US (vs ASCI)
Basra Light (FOB) -0.15 -0.65 -0.65 -0.55 -0.80 -0.95 -0.55 -0.55 -0.35 -0.50 -0.50 -0.60 -0.60 -0.60 -0.60
Basra Heavy (FOB) -3.90 -5.65 -5.85 -5.85 -6.25 -6.40 -5.65 -5.65 -5.60 -5.55 -5.45 -5.30 -5.00 -5.00 -4.90
Kirkuk (FOB Ceyhan) +0.50 +0.30 +0.30 +0.30 +0.30 +0.20 +0.70 +0.90 +0.80 +0.80 +0.50 +0.50 +0.80 +0.50 +0.35
KUWAIT
Kuwait Export Blend (31º)
to Asia (FOB, vs Oman/Dubai) -1.35 -1.95 -3.80 -3.50 -3.75 -3.05 -2.90 -2.85 -2.90 -1.80 -1.50 -1.70 -2.65 -1.75 -1.90
vs Saudi Arab Medium -0.55 -0.65 -0.60 -0.60 -0.55 -0.55 -0.50 -0.45 -0.50 -0.50 -0.50 -0.50 -0.45 -0.50 -0.55
to Mediterranean (FOB, vs Dated Brent) -5.50 -5.65 -5.75 -5.75 -5.40 -5.70 -5.40 -5.10 -5.50 -5.60
to North West Europe (FOB, vs Dated Brent) -6.75 -6.25 -6.05 -6.10 -5.80 -6.15 -5.70 -5.15 -5.65 -6.00
FOB Sidi Kerir (vs Dated Brent) -5.25 -5.40 -5.40 -5.40 -5.15 -5.25 -5.75 -4.90 -5.30 -5.45
to US (FOB, vs Saudi Arab Medium) -0.45 -0.40
delivered US Gulf (vs Saudi AM delivered US Gulf) -0.45 -0.40
CRUDE OFFICIAL SELLING PRICES ($/B)
16. ©Middle East Petroleum and Economic Publications (Cyprus) Ltd
Reproducing MEES Is Strictly Prohibited
14.October.201616
selected data
Publisher: Dr.Saleh S Jallad sjallad@mees.com Editors: Melissa Hancock mhancock@mees.com
Managing Director: Fadi Aboualfa faboualfa@mees.com Jamie Ingram jingram@mees.com
Managing Editor: James Cockayne jcockayne@mees.com David Knott dknott@mees.com
Consultant: Walid Khadduri wkhadduri@mees.com Richard Nield rnield@mees.com
Production: Ledha Socratous lsocratous@mees.com Fatima Sadouki fsadouki@mees.com
Irene Stylianou istylianou@mees.com Peter Stevenson pstevenson@mees.com
Advisor: Basim Itayim bitayim@mees.com
MEES EDITORIAL STAFF
US CRUDE IMPORTS FROM MIDEAST GULF, BY COMPANY 1H16 (‘000 B/D) *Bahrain, Iraq, Kuwait, Qatar, Saudi Arabia, UAE. SOURCE: EIA, MEES CALCULATIONS.
60
50
40
30
20
13-Oct 3-7 Oct 26-30 Sep Sep-16 Aug-16 Q3 2016 Q2 2016 Q1 2016 2015 2014 2013
WTI 50.44 49.52 46.74 45.25 44.81 45.03 45.75 33.53 48.83 92.92 98.03
ICE Brent 52.03 51.61 48.06 47.24 47.16 47.20 47.01 35.22 53.59 99.44 108.69
DME Oman 49.68 48.95 45.07 44.00 44.44 44.23 43.62 31.69 51.20 96.95 105.47
ICE Dubai 49.31 48.80 45.37 44.00 44.40 44.20 43.70 32.00 51.37 96.97 105.49
OPEC Basket 48.07 47.52 43.13 42.89 43.10 43.00 42.39 30.14 49.51 96.30 105.89
JCC na na na na 45.37 na 40.98 33.18 55.03 105.17 110.38
AVERAGE SETTLEMENT PRICES FOR PERIOD IN QUESTION.
benchmark crude prices ($/b)
OCT-16
ICE Brent WTI DME Oman OPEC Basket
FEb-16 Mar-16 aPR-16 May-16 JUN-16 JUl-16 aug-16 sep-16
1,000
900
800
700
600
500
400
300
200
100
0
100
90
80
70
60
50
40
30
20
10
0
Phillips66
Chevron
Marathon
ExxonMobil
Valero
Motiva
PaulsboroRef.
BP
Tesoro
FlintHills
Citgo
Shell
PhiladelphiaEnergy
HoustonRefining
PdV
ParHawaii
Hunt
Total
Total *Gulf Gulf %
TOTAL IMPORTS: 7.80MN B/D
GULF IMPORTS: 1.64MN B/D (21.6%)
101
272
107 94
0 0 11
325
179
274 282
0 20 0 0 80 5
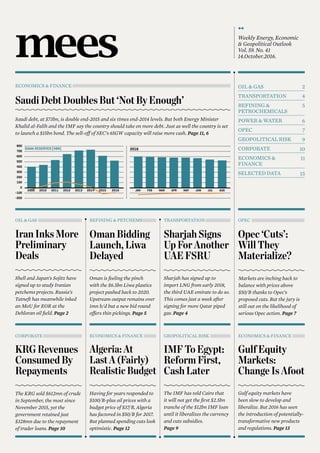
![©MiddleEastPetroleumandEconomicPublications(Cyprus)Ltd
ReproducingMEESIsStrictlyProhibitedwww.mees.com14.October.2016
2
††oil&gas
Iran Inks Petchems Deals With Shell, Sojitz;
Tatneft Signs Up For EOR
I
ran’s National Petrochemi-
cal Company (NPC) has
signed preliminary agree-
ments with Anglo-Dutch
firm Shell and Japan’s Sojitz for petro-
chemicals projects studies. This brings
to six the number of deals the state firm
has secured since the lifting of interna-
tional sanctions in January (see table).
NPC and Shell signed a letter of
intent (LoI) to study a variety of po-
tential petchem prospects. Shell’s Iran
vice-president Hans Nijkamp says
the projects that Shell would consider
developing in Iran include an ethane
cracker and a gas-to-liquids (GTL) plant.
“The LoI gives us a framework for
detailed discussions with NPC,” Mr
Nijkamp says. “We need to study the
areas where we can work together before
we can then consider commercial and
technical options for a joint venture.”
While Shell developed Iran’s So-
roush and Nowruz offshore fields before
sanctions, it had no petrochemicals
projects underway. However, Shell
and NPC had been negotiating for the
joint development of a 74,000 b/d GTL
plant, having completed a feasibil-
ity study (MEES, 24 May 2004).
NPC has also signed a memorandum of
understanding (MoU) with Sojitz to study
the feasibility of a methanol-to-propylene
project. The plant would be built near the
Gulf port of Assaluyeh – home to the on-
shore processing plants for South Pars gas
– to utilize feedstock made from methane.
POST-SANCTIONS PUSH ç
NPC’s first post-sanctions deal was
for a methanol plant, although this will
be built at a new industrial zone at the
Gulf of Oman port of Chabahar. Dan-
ish firm Haldor Topsoe aims to revive
pre-sanctions cooperation with NPC, and
has recently reopened a Tehran office.
Topsoe and NPC signed a preliminary
agreement for licenses, engineering,
proprietary equipment and catalysts
for the methanol plant. The company
was contracted to provide process
technology for nine projects – mainly
methanol plants at Assaluyeh – before
sanctions (MEES, 12 February).
France’s Total, which completed the
offshore Sirri A and E fields developments
in Iran before sanctions, but concluded no
agreements downstream, has signed an
MoU with NPC for a feasibility study into
building an ethane cracker on the Iranian
coast (MEES, 18 March). It also has an
MoU, for the South Azadegan field, which
currently produces around 60,000 b/d.
NPC subsequently secured a GTL
research deal with South Africa’s Pet-
roSA, before signing a ‘mainstream’
petchems agreement with Germany’s
Linde, for front end engineering de-
sign (FEED) work on four units at the
long-delayed 12th Olefin complex.
Further agreements between NPC
and international petchems firms are
anticipated, with local media reporting
talks with France’s Axens for catalysts,
France’s Air Liquide for a methanol
to propylene plant, and Germany’s
BASF for an ethylene and polyethyl-
ene complex (MEES, 12 August).
Although BASF dismissed the lo-
cal reports as “market rumors”, NPC
Managing Director Marzieh Shahdaie
said this week that BASF and Air Liq-
uide are among a group of companies
that are finalizing plans for invest-
ment in Iranian petrochemicals.
Iran’s post-sanctions petchems deals
are being overshadowed by state upstream
firm NIOC’s plans to offer upstream
projects to foreign investors, under a new
Iran Petroleum Contract (IPC), which
replaces the previous unpopular buybacks
contract. The latest provisional deal is
with Russian state firm Tatneft (see box).
Last week NIOC signed its first devel-
opment deal under IPC terms, with well-
connected local firm Persia Oil and Gas
(MEES, 7 October). At the signing of the
NPC/Shell deal, deputy petroleum minis-
ter Amir Zamaninia said Iran aims to sign
upstream deals worth $10bn by the end of
the current Iranian year in March 2017. ¶
Shell has been lined up to study Iranian petchems projects, and Japan’s Sojitz a
propylene plant. The deals coincide with an EOR MoU with Russia’s Tatneft.
IRAN
IRAN’S POST-SANCTIONS PRELIMINARY PETCHEMS DEALS
Company Country Project/Program Covers
Haldor Topsoe Denmark Methanol plant, Chabahar Licenses, engineering, equipment, catalysts
Total France Ethane cracker Feasibility study
PetroSA South Africa Gas-to-Liquids research Cooperation in developing reactors
Linde Germany 12th Olefin, Assaluyeh FEED for cracker, butadiene, benzene units
Shell UK/Netherlands Various (ethane cracker, GTL etc) Feasibility studies
Sojitz Japan Methanol-to-propylene plant Feasibility study
SOURCE: SHANA, IRNA, MEES.
Russian state firm Tatneft on 10
October signed an MoU with Ira-
nian counterpart NIOC for further
development of Dehloran oilfield.
Dehloran is a mature field on the bor-
der with Iraq, an area that Iran has prior-
itized for foreign involvement. Discov-
ered in 1972, the field entered production
in 1978. Output is currently 24,000 b/d
from 16 wells. But the plan is that a deal
under the new Iran Petroleum Contract
would raise output of the field’s 29.8°API
crude to 40,000 b/d. Gas output is slated
to rise from the current 37mn cfd – all of
which is flared – to 77mn cfd sales gas.
Tatneft’s pitch to NIOC focussed on
the firm’s “unique experience in develop-
ing oilfields through the application
of [the] most advanced enhanced oil
recovery techniques,” Tatneft says.
Of the seven post-sanctions upstream
deals to date, three are with Russian
firms: Lukoil has an MoU for projects in
Mansuri and Ab Teymour, and Zarubesh-
neft for West Paydar (MEES, 7 October).
TATNEFT INKS EOR MOU
Iran’s KEY BORDER OIL FIELDS
IRAQ
IRAN
Nasiriyah
Basra
DEHLORAN
MAJNOUN
AZADEGAN
YARAN
MARUN
YADAVARAN
AZAR
BADRA
Ahvaz
Abadan
OIL FIELD GAS FIELD](data:image/gif;base64,R0lGODlhAQABAIAAAAAAAP///yH5BAEAAAAALAAAAAABAAEAAAIBRAA7)