The long run dynamic relationship between broad money supply and the gdp of bangladesh
•
1 like•394 views

The International Institute for Science, Technology and Education (IISTE). Science, Technology and Medicine Journals Call for Academic Manuscripts

Recommended
Recommended
More Related Content
What's hot
What's hot (20)
Similar to The long run dynamic relationship between broad money supply and the gdp of bangladesh
Similar to The long run dynamic relationship between broad money supply and the gdp of bangladesh (20)
More from Alexander Decker
More from Alexander Decker (20)
The long run dynamic relationship between broad money supply and the gdp of bangladesh
- 1. Developing Country Studies www.iiste.org ISSN 2224-607X (Paper) ISSN 2225-0565 (Online) Vol.4, No.14, 2014 167 The Long-Run Dynamic Relationship between Broad Money Supply and the GDP of Bangladesh: A VECM Approach Md. Arfanuzzaman Independent Researcher and Graduate Student, Dhaka School of Economics Email- arfan@asia.com Abstract After commencing the cash economy money appeared as an engine of economic growth. The endeavor has given in this study to uncover out the underlying relationship between broad money supply (M2) and GDP of Bangladesh and ascertain the influence of M2 on GDP in selected study period. The Johansen Cointegretion test signifies that broad money supply and GDP are close-fitting and moving together in the long run. After fitting the Vector Error Correction Model it is discerned that there is an establishment of long run association between M2 supply and GDP. The parameters of this model demonstrate that causality is running from broad money supply to GDP, meaning that M2 manipulates the GDP enduringly. It is originated in the post estimation specification tests that there is no auto-correlation at lag order and residuals are normally distributed. Keywords: Money Supply, GDP, VECM, Forecasting, Impulse Response Function 1. Introduction Money is remarkably significant for any economy for its necessity and diverse characteristics. If money supply increases by expansionary monetary policy of central bank, interest rate will go down. Consequently, cash flow and lending activities will be prolonged. As a result, investment will gear up and gross output level is also expected to increase defining a positive relationship between money supply and economic growth. It is believed that, the channels through which monetary policy affects output are continually changing. And it might be too complex to identify all the transmissions mechanism in an economic system. From the perspective of liquidity, money can be classified in two types. One is Narrow money (M1) and another one is defined as broad money (M2). If the performance and effective circulation of broad money can be ensured, GDP growth is likely to go up. Besides, if monetization of the economy increases, GDP is also expected to increase startlingly. One of the most important determinants of economic growth is variation in the quantity of money and the country that devotes more time to study the behavior of aggregate money supply hardly experiences much variation in their economic performances (Robinson, 1952). It is expected from this study that the causality of broad money supply and GDP can be revealed and it will be helpful for the policy makers to formulate a more realistic monetary policy which can create an upbeat pressure on GDP the of Bangladesh. The amount of money floating around the economy and available for spending is need to studied fervently for clues to economic growth. Nevertheless to say, Money Supply has a powerful effect on economic activity which is directly linked to inflation also. If money supply grows faster than real GDP, inflation results since velocity stays relatively stable. Thus, it deserves special concentration on the study of money supply mechanism on GDP to ascertain the causality, sensitiveness, and cointegration exists between them. 2. Objective of the Study The broad objective of this study is to explore the collision of money supply with the nominal GDP of Bangladesh. The specific objectives are to: Examine the role of Broad Money (M2) supply in economic growth of Bangladesh Assess the causal relationship between M2 and GDP since independence. Validate whether broad money supply eventually affects the GDP of Bangladesh and to what extent. 3. Literature Review Sauer and Scheide (1995) revealed a causal relationship between M1 and real domestic spending within a cointegration framework. Whereas, Estrella and Mishkin (1997) disclosed monetary aggregates are not helpful in predicting GDP irrespective of the chosen forecasting horizon. For Germany, Kirchgassner and Savioz (2001) demonstrate real GDP growth depends on M1 and real interest rate. Furthermore, Fritsche (2002) found that M1 is one of the best indicators for business cycle turning points, computed by the index of industrial production. Lee and Li (1983) investigated causality among money, income and prices for Singapore and concluded bi- directional causality between income and money and uni-directional causality from money to prices. Joshi and Joshi (1985) founded a bi-directional causality between money and income in India. Abbas (1991) performed a causality test between money and income for Asian countries and found bi-directional causality in Pakistan, Malaysia and Thailand. Bengali et al. (1999) identified a bi-directional causality between money and income and uni-directional causality from money to prices in Pakistan.
- 2. Developing Country Studies www.iiste.org ISSN 2224-607X (Paper) ISSN 2225-0565 (Online) Vol.4, No.14, 2014 168 Mehrara et. al (2010) examined the dynamic causal relationships among money, GDP and prices for Iran using annual data over the period 1960-2008. Here, they used Gregory-Hansen co-integration technique, allowing for the presence of potential structural breaks in data to empirically examine the long-run co- movement between the variables. The results suggested the presence of a long-run relationship between these variables. Mohamadpour et. al (2012) unveil the relationships between monetary policy and GDP in Malaysia for quarterly data from 1991 to 2011. Here, the cointegration analysis and Vector Error Correction Models (VECM) were indicated a possibility of long-run equilibrium relationship between real GDP regards to M1, M2, M3, and real interest rate. However, results of trace and maximum Eigenvalue methods suggested two co-integration equations among the variables. Altogether, VECM analysis indicates monetary supply variables included in the model (M1, M2, and M3) are statistically significant and have long-term influence on GDP. Findings of this study suggested increasing money supply would eventually increase the real GDP in Malaysian economy. Daniela and Mihali (2010) analyzed the relationship between money supply and gross domestic product for Romania. Analyzing the data of money supply (M3) and of GDP over ten years through the Augmented Dickey- Fuller they obtained that both series are non-stationary. Applying the co-integration analysis method it is concluded that the two series have a cointegration relationship between them and moving together in the long run. 4. Methodology and Data Source Economic growth is a major concern for any developing countries because employment, human development, social welfare, poverty elevation is mostly depends on the substantial GDP growth. In this study I used following econometric techniques to show the impact and causality of broad money supply on the GDP of Bangladesh. 4.1 Semi Log Model For better analyzing the time series data of different variables the significance of finding growth rate is high. For the estimation of constant growth rate following semi log model has been estimated. iUTLogY ++= 10 ββ Where, Y is the depended variable, ß0denotes intercept, ß1 indicates regression co-efficient, T represents time, and U considered as the error term. Trend compound growth rate can be estimated as follows; Growth rate = (Antilog ß2 - 1)*100 4.2 Johansen Cointegretion Test Johansen test is a superior procedure for cointegretion testing of several time series. Johansen Cointegration (JC) Test is used for series that are integrated of the same order. it is safe to proceed with Johansen Cointegration Test if all the variables are stationary after first difference in Augmented Dicker Fuller (ADF) unit root test. JC test permits more than one cointegrating relationship. Thus, it is more generally applicable than the Engle–Granger test which is based on the augmented Dickey–Fuller test for unit roots in the residuals from a single cointegrating relationship. Johansen test has been used in the study because it addresses many of the limitations of the Engle-Granger method. It avoids two-step estimators and provides comprehensive testing in the presence of multiple cointegrating relations. Its maximum likelihood approach incorporates the testing procedure into the process of model estimation, avoiding conditional estimates. Moreover, the test provides a framework for testing restrictions on the cointegrating relations B and the adjustment speeds A in the Vector Error Correction model. There are two types of Johansen test, either with trace or with eigenvalue, and the inferences might be a little bit different. The null hypothesis for the trace test is the number of cointegration vectors. Just like a unit root test, there can be a constant term, a trend term, both, or neither in the model. For a general VAR (p) model: ,... 11 ttptptt eXXDX +++++= −− ππφµ Tt ,...,1= At the core of the Johansen method is the relationship between the rank of the impact matrix C = AB′ and the size of its eigenvalues. The eigenvalues depend on the form of the VEC model, and in particular on the composition of its deterministic terms (see The Role of Deterministic Terms). The method infers the cointegration rank by testing the number of eigenvalues that are statistically different from 0, then conducts model estimation under the rank constraints. Although the method appears to be very different from the Engle- Granger method, it is essentially a multivariate generalization of the augmented Dickey-Fuller test for unit roots. 4.3 Vector Error Correction Model (VECM) If cointegration is detected between series we know that there exists a long-term equilibrium relationship between them so we apply VECM in order to evaluate the short run properties of the cointegrated series. The VEC model extends the single equation error correction model to allow y and x to evolve jointly over time as in a VAR system. A vector error correction model (VECM) is a restricted VAR that has cointegration restrictions built into the specification, so that it is designed for use with nonstationary series that are known to be cointegrated. The VEC specification restricts the long-run behavior of the endogenous variables to converge to their
- 3. Developing Country Studies www.iiste.org ISSN 2224-607X (Paper) ISSN 2225-0565 (Online) Vol.4, No.14, 2014 169 cointegrating relationships while allowing a wide range of short-run dynamics. Cointegration term is known as error correction term since the deviation from long-run equilibrium is corrected gradually through a series of partial short-run adjustments. There are two possible specifications for error correction: 1. The long run VECM: ,1111 ... ttptppttt XXXDX επµ +∆Γ++∆Γ+++=∆ −+−−− Tt ,...,1+ Where, ,...1 Iii −++=Γ ππ 1,...,1 −= Pi 2. The transitory (Short run) VECM: ,1111_ ... tttptptt XXXDX επφµ ++Γ∆−−∆Γ−+=∆ −−+− Tt ,...,1+ Where, ),...( 1 pii ππ ++=Γ + 1,...,1 −= Pi The chief objective of estimating VECM is to define the exact long run relationship between broad money supply and GDP in Bangladesh. The error correction terms of VECM describe how the time-series adjust to disequilibrium. In VECM the cointegration rank shows the number of cointegrating vectors. 4.4 Lagrange-multiplier Test The VEC lagrange-multiplier (VECLMR) technique has been used to test the serial serial correlaion in the residuals. Here the Hypothesis is, H0: no autocorrelation at lag order H1: autocorrelation at lag order If the H0 can rejected on the basis on VECLMR estimates it can be concluded that there is a auto correlation in the residuals and vice versa. 4.5 Normality test of VECM In this study Jarque-Bera test approach has been adopted to test the normality of VECM. By adopting Vector error correction normality test it can be confirmed that whether the errors are normally distributed or not. Here the Hypothesis is, H0: errors are normally distributed H1: errors are not normally distributed The Null Hypothesis (H0) can be strongly rejected if Most of the errors are both skewed and kurtotic and vice versa. 4.6 Augmented Dicky-Fuller (ADF) Test Time series stationarity is the statistical characteristics of a series such as its mean and variance over time. If both are constant over time, then the series is said to be a stationary process (i.e. is not a random walk/has no unit root), otherwise, the series is described as being a non-stationary process (i.e. a random walk/has unit root). Differencing a series using differencing operations produces other sets of observations such as the first- differenced values, the second-differenced values and so on. x level tx x1st -diiferenced value 1−− tt xx x 2nd -diiferenced value 2−− tt xx Dicky-Fuller (DF) test is widely used to test the unit root of time series data. DF Unit Root Test are based on the following three regression forms: I. Without Constant and Trend: ttt uyy +=∆ −1δ II. With Constant : ttt uyy ++=∆ −10 δα III. With Constant and Trend: ttt uyTy +++=∆ −10 δβα Hypothesis: H0 :δ = 0 (Unit root or Non stationary) H1 :δ≠ 0 (Stationary) Decision rule: If t* > ADF crtitical value, ==> not reject null hypothesis, i.e., unit root exists. If t* < ADF critical value, ==> reject null hypothesis, i.e., unit root does not exist. There is a scope to arise autocorrelation in Dicky-Fuller (DF) test. Thus to avoid this problem I used Augmented Dicky-Fuller (ADF) test to check the unit root of the variables.
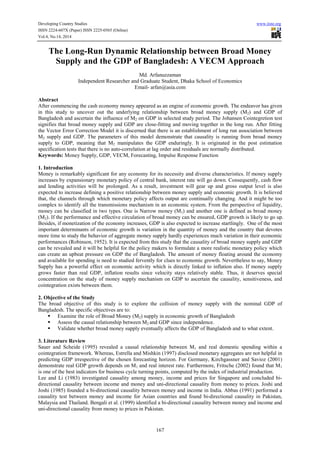
- 4. Developing Country Studies www.iiste.org ISSN 2224-607X (Paper) ISSN 2225-0565 (Online) Vol.4, No.14, 2014 170 4.7 Impulse Response Functions for VECM Impulse response function (IRF) describes how the economy reacts over time to exogenous impulses, which usually call 'shocks'. These functions illustrate the reaction of endogenous macroeconomic variables such as output, consumption, investment, and employment at the time of the shock and over subsequent points in time. In this study it will be possible to say whether monetary shock affects the GDP of Bangladesh over time by estimating IRF. From the well specified VECM, it can be estimated and interpret the IRFs. Whereas IRF from a stationary VAR die out over time, IRF from a co-integrating VECM do not always die out. Because each variable in a stationary VAR has a time-invariant mean and finite, time-invariant variance, the effect of a shock to any one of these variables must die out so that the variable can revert to its mean. In contrast, the variables modeled in a cointegrating VECM are not mean reverting, and the unit module in the companion matrix imply that effects of some shocks will not die out over time. These two possibilities gave rise to new terms. When the effect of a shock dies out over time, the shock is said to be transitory and when the effect of a shock does not die out over time, the shock is said to be permanent. 4.8 Data Source Data for this study has been collected form the Central Bank of Bangladesh. All time series data of broad money and GDP is available in the e-portal of Bangladesh Bank (Central Bank). It deserves special mention that, the variable GDP which is considered for the analysis is in nominal term. From 1974 to 1989 M2 is formulated by adding narrow money (M1) and time deposits. Here, narrow money consists of currency outside the bank and demand deposits. Counting procedure for M2 has changed slightly from 1990 to till date. Net foreign assets and net domestic assets are considered to construct M2 at the present. 5. Results and discussion In this section, a quantitative study has been conducted based on the real time data. In this instance time series econometrics (i.e. JC test, VECM, Lagrange-multiplier test, ADF test, IRF), semi log and ARMAX model has been estimated and interpret the results and probabilities, as well as provide further explanation of the method behind. 5.1 Historical Trend of M2 and GDP It is appeared in the figure below that quantity of broad money supply was minimal initially and starts increasing modestly after 1985. Trend of M2 was almost same between the periods of 1974 to 1985. It seems after 1990 M2 is in upward trend and continue to soar. Here it is noted that in 1973 supply of broad money was counted for 1244.5 crore and in 1990 it stood up at 25004.4 crore with a growth of 19%. Total broad money goes to 517109.5 crore in 2012. Figure 1: Trend of M2 supply from 1974 to 2012 Figure 2: Trend of GDP from 1974 to 2012
- 5. Developing Country Studies www.iiste.org ISSN 2224-607X (Paper) ISSN 2225-0565 (Online) Vol.4, No.14, 2014 171 From the trend line of GDP it seems that it is moving with the similar pattern of M2. Initially the GDP of Bangladesh was low. Then it is flickered that GDP is in upbeat trend as quantity of M2 increases. It is evident that after 1990s the GDP of Bangladesh is going tremendously higher. So there is a similar trend subsists between GDP and M2 5.2 Growth of M2 and GDP It is essential to derive the constant growth rate of GDP and M2. From the derivation of growth rate, it can be stated that whether any differential exists between GDP and M2. The estimated log linear model helps to scan the constant growth rate of GDP and M2 over the time period. Here the adjusted R2 is found 0.98 for both estimates which indicates the models are explained 98% of total variation. From the regression co-efficient it is evident that the growth rate of GDP and M2 are correspondingly 12%, and 15% and statistically significant at 1%. It seems that growth of M2 is notably higher than the growth of GDP during the period of 1974 to 2012. Table 1: Estimates of Log Linear Model Note: ** p<0.05, *** p<0.01 From the below table a comparative view can be found of the growth rate of GDP and M2 for the pre floating exchange rate period and post fixed exchange rate period. Here the adjusted R2 is significantly higher for the both results which indicate the better reliability of the model. The estimated semi log model postulates that growth rate of GDP and M2 are 13% and 16% respectively during fixed exchange rate period and regression co- efficient is statistically significant at 1 percent level. It seems growth rate of M2 is prominently higher than the growth rate of GDP in that period. Besides, the model based on floating exchange rate period denotes that growth rate of GDP and M2 are correspondingly 12% and 17%. It is appeared that growth rate of M2 is remarkably higher than the growth rate of GDP which is similar to the pre floating exchange rate period models’ outcome. It is also notable that growth rate of M2 is significantly higher in floating, fixed and entire exchange rate period compared to that of GDP. Moreover, it is appeared that there is no any momentous change in GDP growth rate during the different time period. 7.3 Cointegration Analysis If the log likelihood of the unconstrained model that includes the cointegrating equations is significantly different from the log likelihood of the constrained model that does not include the cointegrating equations, we reject the null hypothesis of no cointegration. Johansen’s approach derives two likelihood estimators for the cointegration (CI) rank. One is trace test and another one is maximum Eigen value test. The trace statistic either rejects the null hypothesis of no cointegration among the variables or does not reject the null hypothesis that there is one cointegration relation between the variables. Table 2: Johansen Cointegration Test Note: Trace statistic is significant at 1% and 5% level with rank 1 It seems in Table 1 that, there is cointegration between log M2 and log GDP. In the output above, we strongly reject the null hypothesis of no cointegration between the variables of rank 0 and fail to reject the null hypothesis of at most one cointegrating equation of rank 1. Thus we accept the null hypothesis that there is one cointegrating equation in the bivariate model. Hence, it can be avowed that M2 and GDP are cointegrated and moving together in the long run. 5.4 Fitting Vector Error Correction Model (VECM) Since the variables are cointregrated we are allowed run the VECM. It is proved in JC test that GDP and M2has long run association. So fitting the VECM is now considerable for further analysis. GDP M2 GDP M2 GDP M2 Co-efficient 0.12 0.15 0.13 0.16 0.12 0.17 0.98 0.98 0.98 0.98 0.98 0.98 51.96*** 61.08*** 40*** 39.2*** 67.9*** 59.7*** 0.002 0.058 0.003 0.004 0.001 0.002 Floating ER Regime T-statistics Standard Error Adj. R2 Whole Period Fixed ER regime Rank ParametersEigenvalue 0 20 34.45 24.6 1 24 0.618 12.97 2 26 0.077 33 Lag 6 5% Critical Value 2.6707*1*5 No. of observation Trend: Restricted constant; Sample (1980-2012) Trace Statistic
- 6. Developing Country Studies www.iiste.org ISSN 2224-607X (Paper) ISSN 2225-0565 (Online) Vol.4, No.14, 2014 172 The first model is error correction model and this one is our target model where GDP is dependent variable. Here the error correction term is -1.253 and probability value is very small and found less than 5 percent, meaning that error correction term is significant. Since the co-efficient is negative and statistically significant, it can be said that there is a long run causality running form independent variable such as M2to GDP, meaning that broad money supply has influence on GDP in the long run. Furthermore, it seems first four lag of GDP and all six the lag of M2 is significant. So, these variables can explain the dependent variable individually. Table 3: Estimates of VECM, Trend: restricted constant Above estimates of VECM demonstrates co-efficient of determination for 1st difference of log GDP is 0.92 and co-efficient of determination for 1st difference of log M2 is 0.93 which signifies the model explain 92 percent and 93 percent of total variation respectively. 5.5 Postestimation Specification Testing Inference on the parameters in α depends crucially on the stationarity of the cointegrating equations, so we should check the specification of the model. Now, testing for serial autocorrelation in the disturbance term we find out that there is no autocorrelation at lag order (Table-4).It seems p value is higher than 5% critical values which allow accepting the null hypothesis of having no auto correlation in lag order. So, it can be stated that this model has goodness of fit and explain the co integrating relationship accurately among the variables. Whether the residuals are normally distributed or not we run the normality distribution test. Here Jarque-Bera test method is used for this diagnostic check. In the test null hypothesis is designed as Residuals are normally distributed. In the first model GDP is dependent variable and the probability is 37.3 percent which is more than 5 percent. In this case we accept the null hypothesis, which indicates residuals are normally distributed. For the second model p value is also more than 5%, which allow us to accept the null hypothesis. Now as a whole the probability value is 71.75 percent which is more than 5 percent, meaning that we cannot reject the null hypothesis rather we accept the null hypothesis. So it can be confirmed that residuals are normally distributed which is desirable outcome. Now it is proved that model is well specified and can be accepted because it doesn’t have autocorrelation problem and residuals are normally distributed. 5.5.1 Stationary Test for Co-integration Equation Coef. z P>|z| Coef. Z P>|z| Cointegrating Equation of Lag 1 -1.25 -5.15 0 0.175 0.6 0.552 lag Difference of log GDP 0.457 2.67 0.008 -0.2386 -1.15 0.249 lag Difference of log M2 -0.538 -2.17 0.03 0.599 2 0.046 0.92 0.93 33 121.03 R2 of 1st Diff. of log GDP R2 of 1st Diff. of log M2 No. of Observation Log likelihood 1st Difference of log GDP 1st Difference of log M2 lag Chi Square Degrees of freedom 1 0.5721 4 0.96611 2 5.4765 4 0.2418 Table 4: Lagrange-multiplier test Prob> Chi2 Equation Chi Square Degrees of Freedom 1 st Difference of log gdp1.971 2 1 st Difference of log m0.128 2 All 2.099 4 Table 5: Jarque-Bera test Prob> chi2 0.37331 0.93797 0.71759 Estimates of ADF Unit Root Test for Error Term Test Statistic 1% Critical Value 5% Critical Value No. of observation P value -4.547 -3.62 -2.964 38 0.0002
- 7. Developing Country Studies www.iiste.org ISSN 2224-607X (Paper) ISSN 2225-0565 (Online) Vol.4, No.14, 2014 173 It is very significant to check whether stationary exists in the variables after co-integration test. Above Augmented Dickey-Fuller estimates obviously signifies the stationary in the error term of the variables such as M2 and GDP. Hence, it can be stated that the model is correctly specified and the conclusion from the simulation is satisfactory. 5.5.2 Stability Check By the stability check it can be affirmed that whether number of cointegrating equations are correctly specified. The companion matrix of a VECM with K endogenous variables and r cointegrating equation K-r unit eigenvalues. If the process is stable, the moduli of the remaining r eigenvalues are strictly less than one. From the above graph, the plotted eigenvalues of the companion matrix can be observed. The graph of the eigenvalues shows that none of the remaining eigenvalues close to the unit circle. The outcome of the stability check does not indicate that the VECM model is misspecified. 5.6 Impulse-response functions for VECMs In this state the IRF has bent estimated to identify the shock of money supply on GDP. There are two outcomes of the results. When the effect of a shock dies out over time, the shock is said to be transitory. When the effect of a shock does not die out over time, the shock is said to be permanent.
- 8. Developing Country Studies www.iiste.org ISSN 2224-607X (Paper) ISSN 2225-0565 (Online) Vol.4, No.14, 2014 174 Finding out impulse response functions it seems that there is a positive effect on GDP if there is a exogenous shock on money supply, and if there is a positive shock on money supply GDP has an exogenous positive shock. It can be stated from the estimates that the shock of M2 is permanent on GDP where the effect of a shock does not die out over the time. 5.7 Forecasting with VECM Cointegrating VECM are also used to produce forecasts of both the first-differenced variables and the levels of the variables. Comparing the variances of the forecast errors of stationary VARs with those from a cointegrating VECM reveals a fundamental difference between the two models. Whereas the variances of the forecast errors for a stationary VAR converge to a constant as the prediction horizon grows, the variances of the forecast errors for the levels of a cointegrating VECM diverge with the forecast horizon. Because all the variables in the model for the first differences are stationary, the forecast errors for the dynamic forecasts of the first differences remain finite. In contrast, the forecast errors for the dynamic forecasts of the levels diverge to infinity. Fig 5: Forecasting of M2 and GDP Here, i obtain dynamic forecasts of the levels and generate graph of these dynamic forecasts, along with their asymptotic confidence intervals. As expected, the widths of the confidence intervals grow with the forecast horizon. It seems that M2 grows along with the GDP with similar trend during the forecasting period 2013 to 2035. Which signifies GDP is optimistically impacted with the growth of M2. 6. Conclusion It is evident that broad money supply and GDP are cointegrated at rank 1 in johansen test, meaning that these two variables are moving together. Consequently, VECM model is fitted and seems GDP and M2 has relationship both in short run and long run, which indicates there is an influence of M2 on the GDP. Here, no autocorrelation is found at lag order. After that, the impulse response function is estimated to examine whether there is a permanent or transitory shock of broad money supply on GDP. It is found that there is a positive effect on GDP if there is an exogenous shock on broad money supply and the shock of M2 is appeared permanent on GDP. In the present context of Bangladesh, beside the broad money supply it is very requisite to ensure that
- 9. Developing Country Studies www.iiste.org ISSN 2224-607X (Paper) ISSN 2225-0565 (Online) Vol.4, No.14, 2014 175 money is going to productive sector rather than unproductive sector. In order to meet the targeted growth, liquidity and investment friendly interest rate is obligatory and apart from this other relevant issues like producer and consumer confidence, political stability, necessary infrastructure and level playing field for all is very essential. Finally, it can be acknowledged confidently from the study that expansionary monetary policy has momentous impact on GDP as well as economic expansion. It is also noteworthy to take accommodating fiscal and monetary policy to stimulate economic growth and prosperity. Only fiscal or monetary policy can’t bring fruitful outcome for the Bangladesh economy. Reference (s) Abbas, K. 1991. “Causality Test between Money and Income: A Case Study of SelectedDeveloping Asian Countries (1960—1988)”, The Pakistan Development Review, (30)4, p: 919-929. Ahmed, S. 1977 “Demand for Money in Bangladesh: Some Preliminary Evidence”, Bangladesh Development Studies, vol-5, issue-2. Bengali, K., H. A. Khan, and M. Sadaqat 1999. “Money, Income, Prices and Causality: The Pakistani Experience”, Journal of Developing Areas, Volume-3. Barro, R., 1994. “Money Supply and Economic Growth in a Cross Section of Countries”, Quarterly J. Economic, 105: 407-443. Daniela and Mihali. 2010. “Linking Money Supply With the Gross Domestic Product in Romania”. Annales Universitatis Apulensis Series Oeconomica. Volume-12. Issue-1. Feldstein, M. and Stock, J. H. 1994, “The Use of a Monetary Aggregate to Target Nominal GDP”, National Bureauof Economic Research. P: 7-69. Frederic S. 2007. “The Economics of Money, Banking and Financial Markets”. 8th Ed., Boston: Pearson Education. Feldstein, M., Stock, J.H. (1997): The Use of a Monetary Aggregate to Target Nominal GDP, in: Mankiw, N.G. (ed.), Monetary Policy, The University of Chicago Press, Chicago and London, pp. 7-69. Joshi, K., and Joshi S. 1985. “Money, Income, and Causality: A Case Study for India. Arthavikas”. Kirchgässner, G., Savioz, M. (2001): Monetary Policy and Forecasts for Real GDP Growth: An Empirical Investigation for the Federal Republic of Germany, German Economic Review, 2, pp. 339-365. Lee, S. and W. Li. 1983. “Money, Income and Prices and their Lead-lag Relationship in Singapore”.ǁ Singapore Economic Review, p:73 - 87. Levine, R. and Renelt, 1992. “A Sensitivity Analysis of Cross-Country Growth Regression the American Economic Review’’, 82: 4. Mehrara, Mohsen et. al 2010. “The Dynamic Causal Relationships Among money, Output And Prices In Iran”, Asian Journal of Business and Management Sciences, Volume-1, P:31-37. Mohamadpour, Babak et. al 2012. “Study of Association between Monetary Policy and GDP: An Econometric Perspective in Malaysia”. Australian Journal of Basic and Applied Sciences, Volume-6, Issue-1 Ogunmuyiwa, M.S. and A.F. Ekone, 2010. “Money Supply-Economic Growth Nexus in Nigeria”. J. Soc Sci., 22(3): 199-204.
- 10. Developing Country Studies www.iiste.org ISSN 2224-607X (Paper) ISSN 2225-0565 (Online) Vol.4, No.14, 2014 176 Appendix Year GDP at Market Price (Tk in Crore) M2 (Tk in Crore) 1973-74 7108.6 1244.5 1974-75 12574.1 1259.6 1975-76 10745.8 1396.8 1976-77 10536.1 1739.8 1977-78 14636.5 2141.0 1978-79 17281.9 2760.0 1979-80 19798.5 3244.9 1980-81 23326.3 4136.0 1981-82 26514.4 4548.7 1982-83 28842.3 5899.2 1983-84 34992.2 8385.8 1984-85 41696.2 10534.2 1985-86 46622.7 12338.1 1986-87 53920.1 14353.1 1987-88 59713.6 16408.0 1988-89 65959.8 19078.1 1989-90 100329 22297.6 1990-91 110518 25004.4 1991-92 119542 28526.0 1992-93 125370 31535.6 1993-94 135412 36403.0 1994-95 152518 42212.3 1995-96 166324 45690.5 1996-97 180701 50627.5 1997-98 200177 55869.1 1998-99 219697 63027.1 1999-00 237086 74762.4 2000-01 253546 87174.2 2001-02 273201 98616.0 2002-03 300580 113994.5 2003-04 332973 129721.2 2004-05 370707 151446.4 2005-06 415728 180674.2 2006-07 472477 211504.4 2007-08 545822 248794.9 2008-09 614795 296499.7 2009-10 694324 363031.2 2010-11 796704 440519.9 2011-12 914784 517109.5
- 11. Developing Country Studies www.iiste.org ISSN 2224-607X (Paper) ISSN 2225-0565 (Online) Vol.4, No.14, 2014 177 _cons -4.260878 .0796948 -53.46 0.000 -4.417077 -4.104679 lm2 -.7479096 .005173 -144.58 0.000 -.7580486 -.7377707 lgdp 1 . . . . . _ce1 beta Coef. Std. Err. z P>|z| [95% Conf. Interval] Johansen normalization restriction imposed Identification: beta is exactly identified _ce1 1 20903 0.0000 Equation Parms chi2 P>chi2 Cointegrating equations L5D. .4018463 .2752026 1.46 0.144 -.1375408 .9412334 L4D. .2471432 .2854197 0.87 0.387 -.3122691 .8065555 L3D. .0651354 .2910328 0.22 0.823 -.5052784 .6355493 L2D. .2293549 .2748918 0.83 0.404 -.3094232 .768133 LD. .5992729 .2996811 2.00 0.046 .0119087 1.186637 lm2 L5D. .0778571 .0961954 0.81 0.418 -.1106824 .2663965 L4D. -.1528772 .1637242 -0.93 0.350 -.4737708 .1680165 L3D. .1038019 .1708713 0.61 0.544 -.2310996 .4387034 L2D. -.0174409 .1878 -0.09 0.926 -.3855221 .3506402 LD. -.2386295 .2072049 -1.15 0.249 -.6447437 .1674847 lgdp L1. .1753117 .2945226 0.60 0.552 -.401942 .7525653 _ce1 D_lm2 L5D. -.4765827 .2272807 -2.10 0.036 -.9220447 -.0311207 L4D. -.7066321 .2357187 -3.00 0.003 -1.168632 -.244632 L3D. -.6498488 .2403544 -2.70 0.007 -1.120935 -.1787628 L2D. -.7699622 .2270241 -3.39 0.001 -1.214921 -.3250031 LD. -.5382375 .2474968 -2.17 0.030 -1.023322 -.0531528 lm2 L5D. .0027163 .0794446 0.03 0.973 -.1529922 .1584248 L4D. .1995995 .1352144 1.48 0.140 -.0654159 .4646149 L3D. .3546423 .1411169 2.51 0.012 .0780582 .6312264 L2D. .3186017 .1550978 2.05 0.040 .0146157 .6225878 LD. .4571578 .1711237 2.67 0.008 .1217615 .7925541 lgdp L1. -1.25338 .2432365 -5.15 0.000 -1.730115 -.7766453 _ce1 D_lgdp Coef. Std. Err. z P>|z| [95% Conf. Interval] D_lm2 11 .054131 0.9300 279.0987 0.0000 D_lgdp 11 .044705 0.9270 266.7589 0.0000 Equation Parms RMSE R-sq chi2 P>chi2 Det(Sigma_ml) = 2.23e-06 SBIC = -4.792773 Log likelihood = 121.0388 HQIC = -5.514939 AIC = -5.881142 Sample: 1980 - 2012 No. of obs = 33 Vector error-correction model
- 12. Developing Country Studies www.iiste.org ISSN 2224-607X (Paper) ISSN 2225-0565 (Online) Vol.4, No.14, 2014 178 2 26 122.37421 0.07774 1 24 121.03884 0.61836 2.6707*1*5 9.42 12.97 0 20 105.1447 34.4590 19.96 24.60 rank parms LL eigenvalue statistic value value maximum trace 5% critical 1% critical Sample: 1980 - 2012 Lags = 6 Trend: rconstant Number of obs = 33 Johansen tests for cointegration The VECM specification imposes a unit modulus. -.02418005 - .5196861i .520248 -.02418005 + .5196861i .520248 -.670084 - .2095992i .7021 -.670084 + .2095992i .7021 -.4091781 - .6437522i .762787 -.4091781 + .6437522i .762787 .2457001 - .7901496i .827469 .2457001 + .7901496i .827469 .6993845 - .4875771i .852567 .6993845 + .4875771i .852567 .9886485 .988649 1 1 Eigenvalue Modulus Eigenvalue stability condition
- 13. The IISTE is a pioneer in the Open-Access hosting service and academic event management. The aim of the firm is Accelerating Global Knowledge Sharing. More information about the firm can be found on the homepage: http://www.iiste.org CALL FOR JOURNAL PAPERS There are more than 30 peer-reviewed academic journals hosted under the hosting platform. Prospective authors of journals can find the submission instruction on the following page: http://www.iiste.org/journals/ All the journals articles are available online to the readers all over the world without financial, legal, or technical barriers other than those inseparable from gaining access to the internet itself. Paper version of the journals is also available upon request of readers and authors. MORE RESOURCES Book publication information: http://www.iiste.org/book/ IISTE Knowledge Sharing Partners EBSCO, Index Copernicus, Ulrich's Periodicals Directory, JournalTOCS, PKP Open Archives Harvester, Bielefeld Academic Search Engine, Elektronische Zeitschriftenbibliothek EZB, Open J-Gate, OCLC WorldCat, Universe Digtial Library , NewJour, Google Scholar
- 14. Business, Economics, Finance and Management Journals PAPER SUBMISSION EMAIL European Journal of Business and Management EJBM@iiste.org Research Journal of Finance and Accounting RJFA@iiste.org Journal of Economics and Sustainable Development JESD@iiste.org Information and Knowledge Management IKM@iiste.org Journal of Developing Country Studies DCS@iiste.org Industrial Engineering Letters IEL@iiste.org Physical Sciences, Mathematics and Chemistry Journals PAPER SUBMISSION EMAIL Journal of Natural Sciences Research JNSR@iiste.org Journal of Chemistry and Materials Research CMR@iiste.org Journal of Mathematical Theory and Modeling MTM@iiste.org Advances in Physics Theories and Applications APTA@iiste.org Chemical and Process Engineering Research CPER@iiste.org Engineering, Technology and Systems Journals PAPER SUBMISSION EMAIL Computer Engineering and Intelligent Systems CEIS@iiste.org Innovative Systems Design and Engineering ISDE@iiste.org Journal of Energy Technologies and Policy JETP@iiste.org Information and Knowledge Management IKM@iiste.org Journal of Control Theory and Informatics CTI@iiste.org Journal of Information Engineering and Applications JIEA@iiste.org Industrial Engineering Letters IEL@iiste.org Journal of Network and Complex Systems NCS@iiste.org Environment, Civil, Materials Sciences Journals PAPER SUBMISSION EMAIL Journal of Environment and Earth Science JEES@iiste.org Journal of Civil and Environmental Research CER@iiste.org Journal of Natural Sciences Research JNSR@iiste.org Life Science, Food and Medical Sciences PAPER SUBMISSION EMAIL Advances in Life Science and Technology ALST@iiste.org Journal of Natural Sciences Research JNSR@iiste.org Journal of Biology, Agriculture and Healthcare JBAH@iiste.org Journal of Food Science and Quality Management FSQM@iiste.org Journal of Chemistry and Materials Research CMR@iiste.org Education, and other Social Sciences PAPER SUBMISSION EMAIL Journal of Education and Practice JEP@iiste.org Journal of Law, Policy and Globalization JLPG@iiste.org Journal of New Media and Mass Communication NMMC@iiste.org Journal of Energy Technologies and Policy JETP@iiste.org Historical Research Letter HRL@iiste.org Public Policy and Administration Research PPAR@iiste.org International Affairs and Global Strategy IAGS@iiste.org Research on Humanities and Social Sciences RHSS@iiste.org Journal of Developing Country Studies DCS@iiste.org Journal of Arts and Design Studies ADS@iiste.org