1. 1
IMPACT OF FISCAL AND MONETARY POLICY ON ECONOMIC GROWTH IN
VIETNAM
Le Thanh Tung
Ton Duc Thang University - Faculty of Business Administration
No 19 Nguyen Huu Tho, Tan Phong, District 7, HCMC
Email: lethanhtung@tut.edu.vn
Abstract: This paper uses the Johansen cointegration test and the Vector Error Correction
Model (VECM) to study the impact of fiscal and monetary policy on economy growth in
Vietnam during the period from quarter I/2004 to quarter II/2013. The results showed the
cointegration relation between the macroeconomic policies and economic growth. Besides,
the variance decomposition and impulse response functions from VECM model showed the
impact of the two policies on economic growth were limited, in which the impact of the
monetary policy on growth is greater than that of the fiscal policy on growth. Subsequently,
the paper provides some recommendations to improve the efficiency of the implementation of
these policies in Vietnam.
Keywords: economic growth, fiscal policy, monetary policy, VECM
1. Introduction
On the basis of modern economics, fiscal and monetary policies are significant tools to
express the government’s opinions and orientation for economic growth to the economy.
Fiscal policy is implemented using two main tools as tax and the government expenditure.
Meanwhile, monetary policy is implemented by the government’s control in money supply
and even the foreign exchange rate adjustment (Gregory Mankiw, 2007). Expansionary fiscal
policy is implemented on the principles of tax reduction and an increase in the government
2. 2
expenditure; however, an increase in tax and a decrease in the government’s expenditure are
called discretionary fiscal policy. If the government increases the money supply, it indicates
that an expansionary monetary policy is implemented; meanwhile, if the money supply
decreases, it means a discretionary monetary policy is performed (William and Alan, 2008).
In Vietnam, with the economic development on the basis of socialist-oriented market
economy model, fiscal policy and monetary policy are tools commonly applied by the
Government in order to regulate the economy. However, some questions need to be
thoroughly answered:
What is the impact of fiscal and monetary policies on the GDP and economic growth of
Vietnam in the past period ?
Is that a positive or negative impact ?
What is the separate impact of each tool ?
Thenceforth, the objectives of this study include: (i) Using quantitative tools to
investigate the impact of fiscal and monetary policy tools on Vietnam economic growth in the
past period, (ii) Recommending planning and administration policies to foster Vietnam
economic growth in stable and sustainable way in the next period.
2. Literature review
In reality, the researches on the impact of fiscal and monetary policies on economic
growth generate inconsistent results and even contrary. A case study for Pakistan using linear
regression model by Shahid and Naved (2010) found that an expansionary fiscal policy
beyond budget will result in a decrease in economic growth. Khosravi and Karimi (2010)
applying ARDL model for the case of Iran during 1960-2006 period concluded that an
expansionary fiscal policy may stimulate economic growth in short run and long run while
there is no evidence for the relationship between economic growth and monetary policy (via
the change in money supply).
In contrast, Irfan and Ume (2011) stated that the government’s increase in money
supply has positive relationship with economic growth. Similarly, a research by Syed et. al.
(2011) for the case of Pakistan using data from 1980-2009, with an application of ECM
model, showed that the government’s expenditure and money supply have positive impact on
3. 3
economic growth. However, a study by Goher et. al (2011) using TSLS model showed that
budget deficit (because of long-lasting expansionary fiscal policy) inhibits economic growth.
A research by Musa and Asare (2012) using VECM for the case of Nigeria during the period
of 1970-2010 found that money supply and the Government’s expenditure have positive
effect while exchange rate has negative impact on economic growth.
The previous studies showed that the impact of the policies on economic growth is
mainly explained via two issues: (i) The fitness of the policy with the economy and (ii)
Specific characteristics of each economy.
3. Methodology and data description
In order to achieve the research objectives, this paper applied Vector Error Correction
Model. On basis of the research model by Khosravi and Karimi (2010) as well as Musa and
Asare (2012), the impact of fiscal and monetary policies on Vietnam economic growth may
be depicted by the following function:
LGDPt = 0 + 1LTAXt + 2LGEt + 3LMt + 4LEXCHt +t (1)
Where, the dependent variable LGP is the natural logarithm of gross domestic product
(GDP); the independent variables such as LTAX, LGE, LM, LEXCH are the natural
logarithm of tax, the Government expenditure (two tools of fiscal policy) and money supply,
foreign exchange rate (two tools of monetary policy) respectively. Firstly, the variables in
function (1) will be tested for unit root using Augmented Dickey-Fuller tests.
Firstly, all the variables in function (1) will be tested for unit root using two criteria of
ADF (Augmented Dickey-Fuller) test.
If these variables are I(1) stationary and there exist first-order or I(1) cointegration
relationship, VECM will be estimated. VECM model is constructed as follows:
First of all, we examine a VAR model with p orders, where y is the vector of the
variables with k=n
t
k
t
k
2
t
2
1
t
1
t u
y
A
...
y
A
y
A
y
(2)
4. 4
Where, yt is a vector of non-stationary vector but I(1) cointegrated, and Ai (n x n) is a
matrix of estimated coefficients, ut = (u1t, u2t,..., unt) is a matrix of residuals in the model. The
function can be re-written as follows:
1
n
1
i
t
1
t
i
1
t
t u
Δy
φ
y
Δy (3)
Where: )
A
(I
n
1
i
i
and
n
1
i
j
j
i (L)
*
A
)
A
(
(4)
With an application of exogenous dummy variables or exogenous variables D, yt can
be presented as follows:
t
t
1
t
1
1
t
t u
D
Δy
Γ
y
Δy
(5)
The multinomial in yt:
λ)
λ(1
Γ
λ
λ)I
(1
λ
λ
I
λ 1
p
2
2
1
p
has unit root, then 0
)
(
at =1 and
'
)
1
(
. Finally, VECM model is written as follows:
t
t
1
t
1
1
t
'
t u
D
Δy
Γ
y
αβ
Δy
(6)
Before the estimation of VECM model, testing for cointegration relationship among
variables in the model was conducted using Johansen and Juselius test. Moreover, a lag
selection for VECM model was based on AIC (Akaike Information Criterion) and SBC
(Schwarz Bayesia Information Criterion). Finally, the measurement of the impact of fiscal
and monetary policy on economic growth was investigated by Variance Decomposition
analysis of Impulse response functions (IRF).
In order to implement the research objectives, the research applied the quarterly data
from quarter I/2004 to quarter II/2013, with the number of observations n=38. All the data in
this research (except exchange rate) are adjusted to price of the base year 1994. Gross
domestic product (GDP) data are from Vietnam General Statistics Office (GSO); Tax and
Government expenditure (GE) data are from the Vietnam Ministry of Finance; money supply
(M) data are from State Bank of Vietnam. Exchange rate (EXCH) data are nominal exchange
rate between Vietnam Dong and US dollar from the State Bank of Vietnam. Data of the
5. 5
above-mentioned variables are converted into natural logarithm form when putting into
VECM model.
4. Research result
In order to conduct unit root test for the variables in VECM, this study employed ADF
(Augmented Dickey-Fuller) test. The testing results from Table 1 showed that only LGE is
I(0) stationary series (significant at 1 percent) while the remaining variables are non-
stationary.
The result from table 1 indicated that only LGE is I(0) stationary series at 1%
significant level while the remaining variables are non-stationary. However, testing for first
order difference showed that these variables are first order I(1) stationary series at 1%
significant level. This implied that if the first-order cointegration relationship among the
variables exists in the model, VECM will be constructed using first order difference I(1)
series.
TABLE 1: Results of Unit Root Test
Variable
ADF Criteria
I(0) I(1)
LGDP 0,045775 -2,938063***
LTAX -1,680730 -3,996594***
LGE -5,654529*** -5,289334***
LM -2,022853 -8,881039***
LEXCH 0,760485 -5,428546***
Note: ***,**,* Stationary with significant level at 1%, 5%, 10%
Source: Calculated from research data
After unit root test, Johansen and Juselius (1990) tests are also employed to test for
long-run cointegration relationship among the variables in VECM. The results from table 2
showed that the hypothesis of no cointegration vector is rejected at 5% significant level.
Trace test confirmed that there exists at most 2 vectors and Max-Eigenvalue test also
confirmed the existence of at most 01 cointegration vector among the variables at 5%
6. 6
significant level. The testing results indicated that the variables are first-order stationary and
there exists the cointegration relationship; therefore, it is qualified for VECM estimation in
the next part.
TABLE 2: Results of Johansen's Cointegration tests
Series: LGDP LTAX LGE LM LEXCH
Johansen Trace Test
Hypothesized
No. of CE(s)
Eigenvalue
Trace
Statistic
Critical value
0,05 Probability **
None * 0,643892 90,14261 69,81889 0,0005
At most 1 * 0,529140 52,97181 47,85613 0,0153
At most 2 0,419082 25,85677 29,79707 0,1331
At most 3 0,154720 6,303515 15,49471 0,6597
At most 4 0,006986 0,252366 3,841466 0,6154
Trace test indicates 2 cointegrating eqn(s) at the 0.05 level
Johansen Maximum Eigenvalue Test
Hypothesized
No. of CE(s)
Eigenvalue
Max-Eigen
Statistic
Critical value
0,01 Probability **
None *
0,643892 37,17080 33,87687 0,0195
At most 1
0,529140 27,11504 27,58434 0,0573
At most 2
0,419082 19,55326 21,13162 0,0819
At most 3
0,154720 6,051149 14,26460 0,6067
At most 4
0,006986 0,252366 3,841466 0,6154
Max-eigenvalue test indicates 2 cointegrating eqn(s) at the 0.05 level
Source: Calculated from research data
The determination of lag length for a VECM is based on a comparison between AIC
and SBC from regression process for VECM with various lags. Finally, we select lag=2 as an
optimal lag length for VECM with the variables in function (1). The regression results for
VECM with 2 lags are presented in table 3:
7. 7
TABLE 3: Estimated Results of VECM
Sample (Adjusted): 4 38
Cointegrating Eq:
CointEq1
LGDP(-1) 1,000000
LTAX(-1) 0,14280
LGE(-1) -0,016769
LM(-1) -0,531113
LEXCH(-1) -0,461971
C 1,606041
Error Correction: D(LGDP) D(LTAX) D(LGE) D(LM2) D(LEXCH)
CointEq1 -2,502438 -3,822600 -3,114814 -1,344468 -0,050779
DLGDP(-1) 1,049382 2,402534 3,349522 0,714568 -0,005414
DLGDP(-2) 0,637549 1,382064 1,254033 0,493524 -0,017173
DLTAX(-1) 0,497605 1,029610 0,461917 0,675934 0,041563
DLTAX(-2) 0,188673 0,297018 0,591717 0,090452 0,038608
DLGE(-1) -0,037841 -0,069836 -1,033541 -0,055339 0,003815
DLGE(-2) -0,038882 -0,013035 -0,576055 -0,016694 0,005145
DLM(-1) -0,811906 -1,692823 0,076561 -1,150201 -0,026177
DLM(-2) -0,305789 -0,933120 0,014591 -0,589048 -0,027511
DLEXCH(-1) -0,001097 -2,368025 -3,788375 -2,313101 0,000386
DLEXCH(-2) 0,189812 -2,206716 1,441378 -0,577168 0,033214
C 0,022718 0,071399 -0,010484 0,098538 0,009052
R2
0,947054 0,825447 0,592846 0,517125 0,264011
Adjusted R2
0,921732 0,741965 0,398120 0,286185 -0,087984
Vector Error Correction Estimates
Date: 08/25/13 Time: 17:31
Sample (adjusted): 5 72
Included observations: 68 after
adjustments
Standard errors in ( ) & t-statistics
in [ ]
Cointegrating
Eq: CointEq1
GRGDP(-1) 1.000000
Source: Calculated from research data
After conducting Variance Decomposition, the estimated result of function (1) VECM
with two lags showed that the tools of fiscal and monetary policy have impact on economic
8. 8
growth. ANOVA results (Table 4) showed that the change in GDP is 74.1% in short run and
declines to 62.2% in long term, the variation of tax is 3.7% in short term and increases to
4.2% in long term,; the Government budget expenditure changes 2.2% in short term and
increases to 5.7% in long term, the short-run change of money supply is 16.7% and in long
run is 23.2%, exchange rate changes 3.14% in short term and increases up to 4.5% in long
term.
The results from Variance Decomposition showed that the tools of monetary policy
cause 19.8 percent of the change of GDP in short term and 27.7 percent in long term;
however, the tools of fiscal policy only resulted in 5.9 percent of the change in GDP in short
term and 9.9 percent of the variation in GDP in long term. Therefore, it could be concluded
that monetary policy has more remarkable impact on GDP than fiscal policy in the period of
the research. In summary, the combination of these two policies resulted in 25.8 percent of
variation in GDP in short run and 37.7 percent in long run.
TABLE 4: ANOVA Result
Variance Decomposition of LGDP
Period S.E. LGDP LTAX LGE LM LEXCH
1 0,073795 100,0000 0,000000 0,000000 0,000000 0,000000
2 0,091677 74,11840 3,759693 2,254428 16,72250 3,144983
3 0,097913 65,92962 3,838928 2,411089 24,88938 2,930983
4 0,100630 62,54437 5,299166 3,937977 24,76645 3,452041
5 0,122243 72,25455 4,161925 3,992244 17,25138 2,339907
6 0,130962 65,29109 4,218568 5,469337 20,79543 4,225576
7 0,135833 61,42808 4,220729 5,355313 25,02505 3,970824
8 0,137718 60,10034 4,670871 5,656551 25,29715 4,275085
9 0,150580 65,97103 4,157567 5,011915 21,28130 3,578185
10 0,155868 62,27665 4,199313 5,728547 23,28355 4,511939
Source: Calculated from research data
9. 9
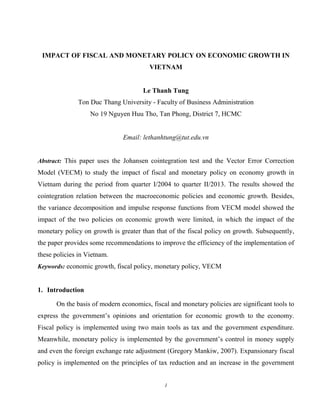
In the next part, the impact of fiscal and monetary policies on economic growth in
Vietnam in research period will be analyzed using impulse response functions (IRF). The
results from IRF analysis will modify the afore-mentioned ANOVA results. The duration
used for IRF analysis is 10 quarters (2.5 years).
FIGURE 1: Response Functions of the Variables from Policy Shocks
-.10
-.05
.00
.05
.10
2 4 6 8 10
Response of LGDP to LGDP
-.10
-.05
.00
.05
.10
2 4 6 8 10
Response of LGDP to LTAX
-.10
-.05
.00
.05
.10
2 4 6 8 10
Response of LGDP to LGE
-.10
-.05
.00
.05
.10
2 4 6 8 10
Response of LGDP to LM2
-.10
-.05
.00
.05
.10
2 4 6 8 10
Response of LGDP to LEXCH
-.2
-.1
.0
.1
.2
2 4 6 8 10
Response of LTAX to LGDP
-.2
-.1
.0
.1
.2
2 4 6 8 10
Response of LTAX to LTAX
-.2
-.1
.0
.1
.2
2 4 6 8 10
Response of LTAX to LGE
-.2
-.1
.0
.1
.2
2 4 6 8 10
Response of LTAX to LM2
-.2
-.1
.0
.1
.2
2 4 6 8 10
Response of LTAX to LEXCH
-.2
.0
.2
.4
.6
2 4 6 8 10
Response of LGE to LGDP
-.2
.0
.2
.4
.6
2 4 6 8 10
Response of LGE to LTAX
-.2
.0
.2
.4
.6
2 4 6 8 10
Response of LGE to LGE
-.2
.0
.2
.4
.6
2 4 6 8 10
Response of LGE to LM2
-.2
.0
.2
.4
.6
2 4 6 8 10
Response of LGE to LEXCH
-.05
.00
.05
.10
.15
2 4 6 8 10
Response of LM2 to LGDP
-.05
.00
.05
.10
.15
2 4 6 8 10
Response of LM2 to LTAX
-.05
.00
.05
.10
.15
2 4 6 8 10
Response of LM2 to LGE
-.05
.00
.05
.10
.15
2 4 6 8 10
Response of LM2 to LM2
-.05
.00
.05
.10
.15
2 4 6 8 10
Response of LM2 to LEXCH
-.01
.00
.01
.02
2 4 6 8 10
Response of LEXCH to LGDP
-.01
.00
.01
.02
2 4 6 8 10
Response of LEXCH to LTAX
-.01
.00
.01
.02
2 4 6 8 10
Response of LEXCH to LGE
-.01
.00
.01
.02
2 4 6 8 10
Response of LEXCH to LM2
-.01
.00
.01
.02
2 4 6 8 10
Response of LEXCH to LEXCH
Response to Nonfactorized One S.D. Innovations
Source: Calculated from research data
IRF analysis (Line 1 Fig 1) indicated the impact of tools of the policies as follows: (i)
tax tool (Fig. Response of LGDP to LTAX) inhibited economic growth during these period,
an increase in tax resulted in a decrease in growth rate; (ii) Government expenditure (Fig.
Response of LGDP to LGE) resulted in up-and-down fluctuation of GDP, but this variation in
GDP is rather small, which indicates the effectiveness of Government expenditure in the
research period is limited; (iii) money supply (Fig. Response of LGDP to LM) has remarkable
impact on economic growth, an increase in money supply will stimulate the growth rate up to
10. 10
optimal level after two quarters, but a decrease in money supply (discretionary monetary
policy) causes a dramatic decline in economic growth; iv) exchange rate tool (Fig. Response
of LGDP to LEXCH) has positive effect on economic growth, but this impact is not
remarkable, which indicates change rate is not primary tool for stimulating economic growth
in the past period.
Moreover, on the basis of IRF, it can be indicated that all the primary tools of fiscal
and monetary policies contribute to the up-and-down fluctuation (positive and negative
impact) in GDP in the research period. It implied that in addition to macro adjustment, the
tools of fiscal and monetary policies are one of the factors that result in the fluctuation of
economic growth during the past time.
5. Conclusion and policy implications
With an application of VECM to evaluate the impact of fiscal and monetary policy on
Vietnam’s economic growth from quarter I/2004 to quarter II/2013, the results are as follows:
(1) Monetary policy (specifically money supply tool) has more significant impact than tools
of fiscal policy; (2) The outstanding impact of money supply in comparison with that of other
tools of both policies showed that Vietnam’s economic growth in the research period relies
much on the increase of money supply, namely a decrease in money supply will lead to a
decline in economic growth; (3) the tools of both policies also contribute to the fluctuation in
GDP (that is, the change in economic growth rate) in the research period.
With the objective of increasing the effectiveness in policy planning and policy
administration and improving the stability and sustainability of Vietnam’s economic growth,
the Government need to concentrate on the following issues:
Firstly: It is necessary to establish the mechanism for comprehensive co-ordination,
exchanging, information response as well as to promote positive impact of application of
policy mix. The results showed that tax and money supply tools, in some certain periods, have
negative impact on the output. This indicated that the tools themselves reduce their
effectiveness and the efficiency of the policy. Moreover, it is necessary to create a transparent
direction of policy administration in medium and long term. It should be noted that the long-
term consistency needs to be ensured in order for the effective promotion of the policies.
11. 11
Secondly: ANOVA results showed that the impact of the two policies on economic
growth is not remarkable. It seemed that the main motivation of Vietnam economic growth
does not result from these important policies but from other economic activities. Moreover,
the research result showed that these policies are the factors that cause the fluctuation in GDP.
Therefore, in the coming time, it is necessary not to implement policies that may cause
“shock” to the national economy such as stimulus policy at the beginning of 2009 or rapid
money supply policy in the period of 2006-2007.
Thirdly: From the results of ANOVA and response function, it was shown that
monetary (especially money supply) has played a significant role in economic growth. In
reality, from 2010-2012, monetary policy was planned and administrated aiming at inflation
stabilization, exchange rate stabilization, financial market and gold market adjustment,
etc…rather than economic growth. Thenceforth, it resulted in a reduction in Vietnam
economic growth to a lowest rate in the last two decades. Moreover, the fact that although
interest rate has decreased dramatically from 2012 up to now, the investment and economic
growth rate still increase slowly indicating that the effectiveness of the policy is not high.
Therefore, in the next period, it is necessary to increase the efficiency of monetary policy via
unblocking the transmission channels such as bank network, financial market, capital market,
etc…
Fourthly: The research results showed that tax tool has obvious impact on inhibiting
the economic growth. In reality, from 2006 to 2010, the ratio of tax/GDP in Vietnam was 26.2
percent, which is higher than that of other countries in the Southeast Asia (Ministry of
Finance, 2012). Therefore, in the coming time, in order to promote economic growth in
Vietnam, there will be a need of a route of tax reduction (This study found that tax reduction
contributes to Vietnam economic growth in both short and long term).
Fifthly: The research found the impact of exchange rate on economic growth was not
remarkable, which means the Government need to continue stabilizing exchange rate as it was
from the beginning of 2012 up to now in order to prevent the economy from “supply shock”
due to an increase in price of production inputs which results in an increase in inflation rate,
macro instability and negative impact on economic growth.
12. 12
Reference
1. Anvar Khosravi and Mohammad Sharif Karimi (2010), “To Investigation the relationship
between monetary, fiscal policy and economic growth in Iran: Autoregressive Distributed
Lag Approach to cointegration”, American Journal of Applied Sciences, No 7 (3), PP 415
-419.
2. Goher Fatima, Ather Maqsood Ahmed and Wali Ur Rehman (2011), “Fiscal deficit and
economic growth: An analysis of Pakistan’s economy”, International Journal of Trade,
Economics and Finance, Vol 2, No 6, 501-504.
3. Irfan Hameed and Ume Amen (2011), “Impact of monetary policy on gross domestic
product”, Interdisciplinary Journal of Contemporary Research in Business”, Vol 3, No 1,
PP 1348-1361.
4. Johansen, Soren and Katarina Juselius (1990), “Maximum Likelihood estimation
and inferences on cointegration – with applications to the demand for money”,
Oxford Bulletin of Economics and Statistics, No 52, PP 169-210.
5. Musa Y. and Asare B. K. (2012), “Long and Short run relationship analysis of monetary
and fiscal policy on Economic growth in Nigeria: A Vec model approach”, Research
Journal of Applied Science, Engineering and Technology, Vol 5, No 10, PP 3044-3051.
6. Gregory Mankiw (2007), Principles of macroeconomics (4th
-edition), Thomson South-
Western, USA.
7. Shahid Ali and Naved Ahmad (2010), “The effects of fiscal policy on economic growth:
Empirical evidences based on times series data from Pakistan”, The Pakistan Development
Review, 49:4 Part II (Winter 2010), PP 497-512.
8. Syed Tehseen Jawaid, Faisal Sultan Qadri, Nasir Ali (2011), “Monetary-Fiscal-Trade
policy and Economic growth in Pakistan: Time series Empirical Investigation”,
International Journal of Economics and Financial Issues, Vol 1, No 3, PP 133-138.
9. Uy ban Ngan sach Tai chinh Quoc hoi-UNDP (2012), Ky yeu Hoi thao quoc te-Cac giai
phap đoi moi chinh sach tai khoa với viec tai co cau nen kinh te, Ha Noi, Vietnam.
13. 13
10.Uy ban Kinh te Quoc hoi-UNDP-Vien Khoa hoc Xa hoi Viet Nam (2011), Ky yeu Hoi
thao kinh te Viet Nam: Nhung van đe đat ra trong trung va dai han, Can Tho, Vietnam.
11.William J. Baumol, and Alan S. Blinder (2008), Macroeconomics Principles and Policy,
Thomson South-Western, USA.