2. Review of Applied Management and Social Sciences (RAMSS) Vol. 4, (2) 2021, 321-333
322
For this research paper, Augmented Dickey Fuller test and Auto Regressive Distributive Lag
Model are used. The period used for this research paper is 1989 to 2020. According to most of the
Central Banks and Economists, low inflation and stable prices trigger the economic growth of a
country on the higher side. Constancy in the prices of goods and services stabilizes the value of
money and minimizes the recurring changes which strengthen the economic growth and eliminate
the inequalities of income amongst the different classes of the society. A sound financial system
enhances employment in the country which promotes economic growth. For this study, I used the
variables Inflation, Gross Domestic Product, Interest Rate, Money Supply, and Exchange Rate.
Pakistan is a developing country and also facing the problem of overpopulation. Overpopulation
demands more and more resources which needs money and which increases inflation. Decreasing
the interest rates by the central bank boosts the inflation in the country because the demand for
money increased in the country and naturally supply of money also increased to meet the demand
for money. Developed countries provide different financial aids to developing countries which also
creates inflation in the country. In developing countries production of the agriculture sector is very
low due to which there is an increasing trend in the price level of commodities which creates
inflation in the economy. Levy of indirect taxes by the government is another reason for an increase
in the price of goods in the country which creates inflation also.
2. Literature Review
Khalid (2005) estimated the relationship between Economic Growth, Inflation rate, and
Monetary Policy in the case of Pakistan's economy. This study used variables that were CPI, Inflation
Rate, Output Gap, Exchange Rate Depreciation, Budget Deficit, US inflation rate, and money supply
to GDP ratio. In this study, CPI is used as a dependent variable and others as independent variables.
This study used methods were ADF, Augmented Dickey Fuller Unit Root Test, and Granger Causality
Test.
Noor and Chaudhry (2009) examined the relationship between economic management and
the roots of inflation in Pakistan. This study used time series data which covered the period from
1972 to 2007. The study used variables that were inflation rate, real growth domestic product,
budget deficit, interest rate, money supply, and inflation rate. This study used methods were ADF
Augmented Dickey Fuller Unit Root Test and Johansen Co-integration test. This study exposed that
there was a positive association between import price and inflation rate.
Ayyoaub Chaudhry and Farooq (2011) examined the effect of inflation on economic growth in
the case of Pakistan. This study used time series data which covered the period from 1972 to 2010.
This study used variables that were the gross domestic product, CPI inflation, Trade Openness,
investment growth rate, labor force and population growth. This study used methods were OLS
(Ordinary Least Square) and DW (Durbin Watson Test). The result of this study showed that there
was a negative relationship between inflation and economic growth.
Chaudhry, Qamber and Farooq (2012) studied the monetary policy, inflation and economic
growth in Pakistan. This study used time series data which covered the period 1972 to 2010. This
study used variables that were Real Gross Domestic Product, money and Quasi money as a
percentage of GDP, Call money rate, CPI, Real Exchange Rate and budget deficit as a percentage of
GDP. This study used methods were Augmented Dickey Fuller Unit Root Test, Error Correction
method, Granger Casualty Test and Johnson Co-integration test. This study showed that the call
money rate has a positive impact on GDP.
3. Review of Applied Management and Social Sciences (RAMSS) Vol. 4, (2) 2021, 321-333
323
Javed et al. (2012) examined the inflation and uncertainty of inflation in Pakistan. This study
used monthly data which covered the period from 1957:1 – 2007:12. This study used the model was
ARMA – GARCH. This study used method was Granger Casualty Test. This study showed that there
was a positive relationship between inflation and inflation uncertainty.
Chughtai, Malik and Aftab (2015) estimated the effect of main economic variables on the
economic growth of Pakistan. This study used secondary data which covered the period from 1081 to
2013. This study used variables that were Gross Domestic Product, Exchange Rate and Inflation. This
study used methods were Regression Analysis and ANOVA Test. In this study, Gross Domestic
Product was used as a dependent variable and Exchange Rate, Interest Rate, and Inflation were used
as independent variables. The observation of this study showed that the Inflation Rate and Interest
Rate hurt economic growth. This study revealed that Exchange Rate has a positive effect on
economic growth.
Chaudhry et al. (2015) estimated the monetary policy and inflation pressure in Pakistan, this
study used variables were Inflation, Money Supply, Gross Domestic Product and Interest Rate. This
study used time series data which covered the period from 1973 to 2013. This study used methods
were Augmented Dickey Fuller Test, Unit Root Test, Auto Regressive Distributive Lag Model and
Error Correction Method. The result of this study showed that the money supply was a dominant
reason for inflation.
Mahmood, Waheed and Khalid (2017) estimated the effect of monetary policy on the
economic growth of Pakistan. This study used time series data which covered the period from 1983
to 2013. This research employed methods were Augmented Dicky FullerUnit Root Test and Johnson
Co-integration Test. This study used variables that were GDP, money supply, inflation, interest rate,
unemployment, government expenditure and exchange rate. The result of this research showed that
there was a positive relationship between money supply, government expenditure and inflation rate.
This study exposed that there was a negative association between GDP and interest rate.
Malik et al. (2020) estimated the effect of monetary policy on the economic growth of
Pakistan. This study used time series data which covered the period from 1973 to 2014. This study
used variables that were gross domestic product, money supply official exchange rate, inflation and
interest rate. This study used methods were ADF (Augmented Dicky Fuller Test), Unit Root Test and
ARDL (Auto Regressive Distributive Lag Model). This study exposed that exchange rate and money
supply have a positive effect on economic growth.
3. Data and Methodology
The objective of this analysis is to analyze the relation of INF (dependent variable) with other
independent variables i.e. GDP, IR, MS and ER. The period used for this study is 1989 to 2020. Data
is collected from World Development Indicator.
4. Review of Applied Management and Social Sciences (RAMSS) Vol. 4, (2) 2021, 321-333
324
Table 1: Description of Variables
Variables Description of Variables Unit of Measure Expected Sign Source
INF Inflation Percentage WDI
GDP Gross Domestic Product Percentage Negative WDI
IR Interest Rate Percentage Negative WDI
MS Money Supply Percentage Positive WDI
ER Exchange Rate Percentage Positive WDI
Source: Data collected from World Development Indicator.
The above table shows the explanation of variables chosen for this research paper. The
resources and measuring units are also mentioned in the table. The data collected from the world
development indicator. The expected sign shows the relationship of INF with other variables. There's
an antagonistic relation between INF and GDP and also a negative relationship between INF and IR.
This research exhibits that there's a positive relation between INF and MS and also a positive
relationship between INF and ER. The data collected in percentage.
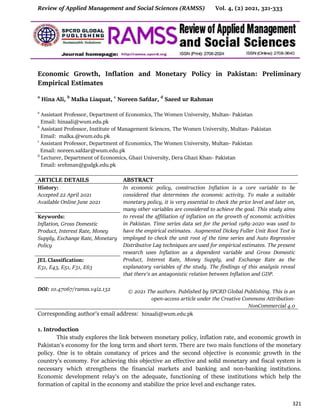
Figure 1: Trend of Independent and dependent Variables
3.1 Description of Variables
We selected different variables proper for the model after a thorough study of different
articles and studies of recent as well as previous scholars. We explain in this section the dependent
and independent variables which are appropriate to this model. In this model, INF is used as the
dependent variable and Gross Domestic Product (GDP), Interest Rate (IR), Money Supply (MS), and
Exchange Rate (ER) as independent variables.
0.0000
50.0000
100.0000
150.0000
200.0000
250.0000
1985 1987 1989 1991 1993 1995 1997 1999 2001 2003 2005 2007 2009 2011 2013 2015
Axis
Title
ER
MS
IR
GDP
INF
5. Review of Applied Management and Social Sciences (RAMSS) Vol. 4, (2) 2021, 321-333
325
Figure 2: Variables
3.1.1 Inflation Rate
In this paper (INF) inflation rate is used as the dependent variable. Inflation is a procedure in
which the level of the price goes up. With raising the price level the value of currency decrease.
These circumstances are not appropriate for the economy because inflation reduces the purchasing
power of customers. In inflation value of money gets lesser and lesser. To measure inflation indicator
used consumer price index. The people wanted to make more money for consumption. Prices of
goods and services increase, so firms pay out more wages in this way income raises.
Figure 3: Inflation
Prices of commodities and policies of government increase inflation in the country. The price
of goods increases inflation rises in the country. Taxes also a cause of inflation, sometimes
government imposes taxes so prices increase which leads to increase inflation. The government also
spends on unproductive expenditure for example on the military, so that government policies also
increase inflation.
3.1.2 Gross Domestic Product
Gross Domestic Product (GDP) is defined as the overall market value of all final goods and
services produced within ranges of an entity in a given time usually a calendar year. GDP is the
complete market worth of production which is created within the limits of the country by
INF
IR
MS
ER
GDP
6. Review of Applied Management and Social Sciences (RAMSS) Vol. 4, (2) 2021, 321-333
326
consumption of both domestic and overseas factors created. GDP growth rate is calculated as the
variation in the proportion of the number of goods and services produced within the limits of a state
within a year.
Figure 4: Gross Domestic Product
3.1.3 Interest Rate
In this paper interest rate is used as the independent variable. There:s an inverse relationship
between interest rate and inflation rate. Interest rate is the very essential determinant of the
economy. All factors and segments depend on it. The interest rate hurts the inflation rate. When the
central bank decreases interest rate money supply increase, consumption and investment also
increase in this way prices of goods increase.
Figure 5: Interest Rate
This diagram shows that when the rate of interest increase the growth of the economy
reduces and inflation also slows because the money supply decrease. On the other hand when the
rate of interest decreases the economic growth rises and inflation increase because the supply of
7. Review of Applied Management and Social Sciences (RAMSS) Vol. 4, (2) 2021, 321-333
327
money increase.
3.1.4 Money Supply
The money supply is the entire quantity of money that circulates in the country. This
circulation includes currency, printed notes, deposits in bank accounts, and all other liquid assets.
When the central bank decreases the interest rate the supply of money increased in the economy.
When the rate of interest increased money supply decreased. When the money supply is increased,
the prices of goods consumption and investment increased too. This shows money supply is the main
cause of inflation.
Figure 6: Money Supply
3.1.5 Exchange Rate
In this paper, the Rate of Exchange is used as the independent variable. There's a positive relationship
between inflation and the rate of Exchange. The rate of Exchange is the value of the foreign currency in terms
of the domestic currency. When the rate of Exchange increases imports also increase and exports decrease.
Figure 7: Exchange Rate
8. Review of Applied Management and Social Sciences (RAMSS) Vol. 4, (2) 2021, 321-333
328
The above diagram shows that low value currency leads to a deficit in trade stability,
technology relocation decrease, and reduction in international payments & capital inflow and also
repair sectors. On the other way, strong currency leads to a boost in worldwide trade, service sector,
equipment transport and foreign aid & flow of capital.
3.2 Model Specification
The ARDL equation estimates the relationship between inflation, monetary policy and
economic growth:
INF =
µ= Distributed term
= Slope Coefficient
3.2.1 The ARDL Model
The Model was prepared to verify the effect of relation amid inflation, monetary policy and
GDP growth in Pakistan. In this model INF is used as a regressed variable and GDP, IR, MS and ER
are used as independent variables. The equation of the ARDL Model is as under:
∑( ) ∑( ) ∑( ) ∑( )
∑( ) ( ) ( ) ( ) ( ) ( )
INF= Rate of Inflation
GDP= Gross Domestic Product
IR = Rate of Interest
MS = Money Supply
ER = Exchange Rate
I used 5 variables in the above cited equation for this research paper. The INF is a dependent
variable whereas GDP, IR, MS and ER are being used as independent variables. The result shows a
negative relationship between INF and GDP. It is revealed from this research that when GDP
increases the inflation decreases. There is a negative relation between INF and IR. There is a positive
relation between INF & MS and INF & ER.
To estimate the relationship between the variables following analysis was done:
9. Review of Applied Management and Social Sciences (RAMSS) Vol. 4, (2) 2021, 321-333
329
Table 1: Descriptive Analysis
INF GDP IR MS ER
Mean 8.2841 -2.4678 3.8224 15.6148 113.0960
Median 7.8826 -2.7639 4.3011 15.4096 110.1521
Maximum 20.2861 5.3300 6.2637 45.5320 193.2350
Minimum 2.5395 -9.2043 1.0628 4.3142 93.7168
Std. Dev 3.9841 2.9358 1.5255 7.3732 20.9799
Skewness 0.7110 0.5616 -0.2155 2.0965 2.1266
Kurtosis 3.7298 4.1779 1.5888 9.8494 8.2099
Jarque-Bera 3.4066 3.5326 2.9030 85.9961 60.3116
Probability 0.1820 0.1709 0.2342 0.0000 0.0000
Source: Data Collected from E-views 9.5 student version
The maximum, generally used measure of an average is the mean. In this table mean of INF is
8.2841 and mean of GDP is -2.4678 and IR, MS and ER values of mean 3.8224, 15.6148 and 113.0960
correspondingly. The value of the maximum of variables INF, GDP, IR, MS and ER is 20.2861,
5.3300, 6.2637, 45.5320 and 193.2350 correspondingly. The median value of INF is 7.8826. The
median is the middle two values of the data. The value of the median GDP is -2.7639. In this paper
standard deviation is used in this study to prove the fluctuations in the data. In this table value of the
standard deviation of GDP is 2.9358 which shows the low level of oscillations. In this table value of
the standard deviation of INF is 3.9841 and the IR value is 1.5255 and While the standard deviation of
MS is 7.3732. In this we use skewness. There are two types of distribution symmetrical distribution
and skewed distribution. The distribution is negatively skewed or has a long left tail. If the value of
skewness is less than zero, it is called symmetrical distribution. The distribution is positively skewed
and has a long right tail; if the units of skewness are greater than zero. In this research paper values
of INF, GDP and IR are 0.71104, 0.5616,-0.2155 negatively skewed. In this paper value of skewness of
MS and ER 2.0965 and 2.1266 is positively skewed.
There are three types of kurtosis:
i) If 2 > 3 it means that the curve is highly peaked it is called leptokurtic.
ii) If 2=3 in this way curve has normally peaked, it is called mesokurtic.
iii) If 2<3 then the curve has flat topped, it is called platykurtic.
3.3 Time Series Analysis
In this research (ADF) Augmented Dickey Fuller examined to examine the data stationarity, if
data is non-stationarity the forecasting cannot be possible.
10. Review of Applied Management and Social Sciences (RAMSS) Vol. 4, (2) 2021, 321-333
330
3.4 Augmented Dickey Fuller Test
In this research data collected from WDI and SBP. In this analysis time series data taken the
period from 1989-2020 to examine the variables stationary ADF (Unit Root Test) applied.
Table 2: Augmented Dickey Fuller Test Result
Variables At level At first Difference Results
Intercept Intercept and
Trend
Intercept Intercept and
Trend
INF -2.507108 -2.406702 -6.849603* -6.932898* I(1)
GDP -2.295329 -2.329832 -5.213837* -5.120329* I(1)
IR -2.488576 -3.485068 -6.931851* -6.838833* I(1)
MS -4.300477 -4.221950 -6.035472* -5.928365* I(1)
ER -8.302695* -5.672215* -5.749140* -5.784779* I(0)
Source: The *, **, *** shows significance at 1%, 10% and 15% respectively.
The table is organized with the help of Eviews Software 9.5 to prove the variables preferred
for this research are stationary or not. To check the stationary level ADF (Augmented Dickey Fuller)
is examined. The Stationarity level of variables is verified too and the time series data used in this
paper. The INF assimilates at level or 1st
difference at 1% level of significance. The GDP integrate at
1st
difference and its ADF value is -5.2138 at a 1% level of significance. The IR assimilates at 1st
difference and its ADF value is -6.9318 at a 1% level of significance. The Ms integrates at level or 1st
difference and 1% level of significance. The ER integrates at 1st
difference and level, at 1 percent
significance level The table 2 shows that dependent variable INF and other Independent variables
GDP, IR, MS, ER.
Table 3: Results of Bound Test for Co- integration
Equation F- Statistic Upper Bond Result
INF,GDP,IR,MS,ER 3.764562 3.29 Cointegration subsists
Source: Data collected from E-views 9.5
In table 3 bound tests are applied. The F-statistics value is 3.764562 which is higher than the
upper bound (I1) value that is 3.29. The F-Statistic value is bigger than the upper Bound (I0) value.
In this way, we deject null preposition which shows in the absence of co-integration, and accept the
alternative hypothesis.
11. Review of Applied Management and Social Sciences (RAMSS) Vol. 4, (2) 2021, 321-333
331
Table 4: Short Run Estimates of Model
Variables Coefficient Standard Error T-Statistics Probability
D(INF) -0.31963 0.2008 -1.5910 0.1725
D(GDP(-3) -1.0934 0.4643 -2.3549 0.0652
D(IR(-3)) 0.0769 0.0585 1.3139 0.2459
D(MS(-3))
D(ER(-3))
-0.7854
-0.7854
0.0965
0.1958
-2.2474
-4.0104
0.0745
0.0102
Cointeq = INF-(-0.5367*GDP-3.1077*IR+0.4509*MS+0.2980*ER-20.3131)
R squared 0.9330 Adjusted R Square 0.6383
AIC 4.5429 SBC 5.6372
HQC 4.8775 Durbin –Watson stat 2.9093
F Statistics 3.1661 Prob of F Statistics 0.1019
Source: Data collected from E-views 9.5
The preceding table demonstrates the short run approximation of variables with cointeq
equation. The calculated value of 'R-Squared' and 'Adjusted R-Squared' are 0.9330 and 0.6383
correspondingly. The Durbin-Watson is 2.9093 which means there is no autocorrelation between
dependent and independent variables.
Table 5: Long Run Estimates of Model
Variables Coefficient Standard Error T-Statistics Probability
GDP -0.5367 1.0068 -0.5330 0.6168
IR -3.1076 1.4359 -2.1642 0.0827
MS 0.4509 0.5434 0.8298 0.4444
ER 0.2979 0.2319 1.2844 0.2553
C -20.3130 24.8370 -0.8178 0.4506
Source: Data collected from E-views 9.5
This table shows the long run estimates of the model. In the table, the value of the coefficient
of GDP is -0.5367 and it is negative. The value of the coefficient of IR is -3.1076. This shows that
there's an antagonistic relation between GDP and INF. The findings show the probability value of
MS, ER, 0.4509 and 0.2979 respectively.
Table 6: Diagnostic Test for Model
Name of Test F-Statistics Probability
Breusch-Godfrey Co- relation LM Test 2.6451 0.2177
Hetroskedasticity Test 0.3933 0.9417
Source: Data collected from E-views 9.5
12. Review of Applied Management and Social Sciences (RAMSS) Vol. 4, (2) 2021, 321-333
332
In the above table, the Breusch-Godfrey Co-relation LM Test applied the value of F-statistic is
0.6451 and probability is 0.2177. In this table, the Hetroskedasticity test applied value of F-statistics
is 0.3933 and probability is 09417.
4. Test to Check the Stability of Economy
In this model, tests are applied to check the stability of the economy. For this objective,
Cumulative Sum of Recursive Residual (CUSUM) and Cumulative Sum of Recursive Residuals of
Squares (CUSUM) techniques are employed. The plotted diagram shows that line amid the critical
region at a 5 % significance level. When tests are applied blue line should between two red lines. It
shows that economy is stable.
4.1 Model Stability
To verify the model stability (CUSUM) and (CUSUM SQ) are applied and check the results. In
this study INF, GDP, IR, MS, and ER variables were used. The economy is stable if in the diagram
Blue strip should amid the two red stripes. In these diagrams blue strip amid the two red strips
which display economy is stable.
Figure 8: Cumulative Sum of Recursive Residuals plot
Figure 9: Cumulative Sum of Square Recursive Residuals plot
In this research, we explain the tables. In the first table, we explain the table of descriptive
analysis in which Mean, Median, Minimum, Skewness, and Standard deviation are shown. In the
second table, variables are expected to sign and the unit of measure is shown. In the third table, ADF
is employed to examine the stationary of the data and its results. In the fourth table Bound test was
-8
-6
-4
-2
0
2
4
6
8
2012 2013 2014 2015 2016
CUSUM 5% Signific anc e
-0.4
0.0
0.4
0.8
1.2
1.6
2012 2013 2014 2015 2016
CUSUM of Squares 5% Signific anc e
13. Review of Applied Management and Social Sciences (RAMSS) Vol. 4, (2) 2021, 321-333
333
applied. In the fourth table short run table explain. In the fifth table long run table explain. In this
chapter CUSUM and CUSUM, squares diagram explain.
5. Conclusion and Policy Implications
The main conclusion of this analysis is to find out the connection between inflation, monetary
policy, and economic growth. This research paper uses the time phase from 1989 to 2020. The article
uses variables (INF) as the dependent variable and independent variables (GDP), (IR), (MS), and
exchange rate. The paper use the (ADF) unit root test and (ARDL) test. There's an affirmative
relation between Inflation, Gross Domestic Product, and Rate of interest. There is an inverse
relationship between inflation and money supply and also a negative between inflation and exchange
rate. In short higher inflation resulted in lower GDP and on the second side low inflation caused
higher GDP.
Government should improve the tax structure to control inflation.
Government must control the supply of money through an efficient monetary strategy.
Reduced unproductive expenditure to decrease inflation.
Government should increase family planning programs to decrease the population in the country.
A price solidity plan was introduced to maintain the price stable.
Government should improve the agriculture segment and industrial region to control inflation.
References
Ayyoub, M., Chaudhry, I. S., & Farooq, F. (2011). Does Inflation Affect Economic Growth? The case of
Pakistan. Pakistan Journal of Social Sciences (PJSS), 31(1).
Malik, M. Y., Latif, K., Khan, Z., Butt, H. D., Hussain, M., & Nadeem, M. A. (2020). Symmetric and
asymmetric impact of oil price, FDI and economic growth on carbon emission in Pakistan:
Evidence from ARDL and non-linear ARDL approach. Science of the Total Environment, 726,
138421.
Chughtai, M. W., Malik, M. W., & Aftab, R. (2015). Impact of Major Economic Variables on Economic
Growth of Pakistan. Acta Universitatis Danubius: Oeconomica, 11(2).
Chaudhry, I. S., Ismail, R., Farooq, F., & Murtaza, G. (2015). Monetary policy and its inflationary
pressure in Pakistan. Pakistan Economic and Social Review, 251-268.
Chaudhry, I. S., Qamber, Y., & Farooq, F. (2012). Monetary policy, inflation and economic growth in
Pakistan: Exploring the co-integration and causality relationships. Pakistan Journal of
Commerce and Social Sciences (PJCSS), 6(2), 332-347.
Javed, S. A., Khan, S. A., Haider, A., & Shaheen, F. (2012). Inflation and inflation uncertainty nexus:
empirical evidence from Pakistan. International Journal of Economics and Financial
Issues, 2(3), 348.
Khalid, A. M. (2005). Economic growth, inflation, and monetary policy in Pakistan: Preliminary
empirical estimates. The Pakistan Development Review, 961-974.
Mahmood, H., Waheed, A., & Khalid, S. (2017). The impact of monetary strategies on economic
growth: an empirical analysis for Pakistan. Asian Journal of Empirical Research, 7(10), 260-
268.
Noor, A., & Chaudhary, M. A. (2009). Economic Management and Roots of Inflation in
Pakistan. Economic Management, 5, 17-34.