
Recommended
Recommended
More Related Content
Similar to Instrumentation and Vibratory Analysis of a Viaduc and Data Post-Processing
Similar to Instrumentation and Vibratory Analysis of a Viaduc and Data Post-Processing (20)
More from AlexanderABANOBI
More from AlexanderABANOBI (6)
Recently uploaded
Recently uploaded (20)
Instrumentation and Vibratory Analysis of a Viaduc and Data Post-Processing
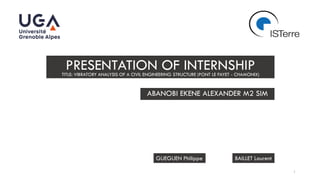
- 1. PRESENTATION OF INTERNSHIPTITLE: VIBRATORY ANALYSIS OF A CIVIL ENGINEERING STRUCTURE (PONT LE FAYET - CHAMONIX) ABANOBI EKENE ALEXANDER M2 SIM GUEGUEN Philippe BAILLET Laurent 1
- 2. • Brief Introduction to parameters of dynamic behaviour of structures • Introduction to the particularities of the work at hand • Comparison of Numerical and Experimental Natural frequencies • Numerical Mode Shapes • Field Notes for experimental organisation of sensors • Flowchart of the experimental signal processing procedure • Further details into of the experimental data processing procedure • Experimental results and numerical comparison • Perspectives & Conclusion 2 TABLE OF CONTENTS
- 3. 3 CHARACTERISATION OFTHELINEAR DYNAMICBEHAVIOUR OFASTRUCTURE RESONANCE FREQUENCIES MODAL SHAPES DAMPING RATIOS Introduction Alexander ABANOBI M2 SIM STIFFNESS YOUNG’S MODULUS
- 4. 4 Alexander ABANOBI M2 SIM Material parameters of the numerical model
- 5. Position of the elastomer layer (blue) modelising contact between the deck and the support Figure 2 shows where the thin elastic layer that models the contact between the deck and the bridge supports (pillars) is located. The area around pillar 29 is shown in the figure. 5 VISUALISATION OF AN IDENTITY PAIR (THE CONTACT BETWEEN THE DECK AND THE PILLARS) Alexander ABANOBI M2 SIM Default Young’s Modulus 25GPa : Reinforced Concrete Material
- 6. 0 0.1 0.2 0.3 0.4 0.5 0.6 0.7 0.8 0.9 1 1 2 3 4 5 6 7 8 9 10 Fréquencespropres Numérotation des fréquences propres Variation des composants horizontals de la raideur pour les paires d'identités pour les 10 premières fréquences propres. Module d'Young du béton 15GPa [1e5,1e5,1e13]N/m [5e5,5e5,1e13]N/m [1e6,1e6,1e13]N/m [5e6,5e6,1e13]N/m [1e7,1e7,1e13]N/m [5e7,5e7,1e13]N/m [1e8,1e8,1e13]N/m [5e8,5e8,1e13]N/m [1e9,1e9,1e13]N/m [5e9,5e9,1e13]N/m [1e10,1e10,1e13]N/m [5e10,5e10,1e13]N/m [1e11,1e11,1e13]N/m [5e11,5e11,1e13]N/m [1e12,1e12,1e13]N/m [5e12,5e12,1e13]N/m [1e13,1e13,1e13]N/m 6 Fig.1: Evolution of the first 10 natural frequencies as a function of the different elastomer stiffness for a cement Young’s Modulus of 15GPa. This is used as the base case for the interpolation for the other Young Moduli Base Case; Young Modulus of concrete, E = 15 GPa
- 7. 0 0.2 0.4 0.6 0.8 1 1.2 1 2 3 4 5 6 7 8 9 10 Fréquencespropres Numérotation des fréquences propres Variation des composants horizontals de la raideur pour les paires d'identités pour les 10 premières fréquences propres. Module d'Young du béton 20GPa [1e5,1e5,1e13]N/m [5e5,5e5,1e13]N/m [1e6,1e6,1e13]N/m [5e6,5e6,1e13]N/m [1e7,1e7,1e13]N/m [5e7,5e7,1e13]N/m [1e8,1e8,1e13]N/m [5e8,5e8,1e13]N/m [1e9,1e9,1e13]N/m [5e9,5e9,1e13]N/m [1e10,1e10,1e13]N/m [5e10,5e10,1e13]N/m [1e11,1e11,1e13]N/m [5e11,5e11,1e13]N/m [1e12,1e12,1e13]N/m [5e12,5e12,1e13]N/m [1e13,1e13,1e13]N/m 0 0.2 0.4 0.6 0.8 1 1.2 1 2 3 4 5 6 7 8 9 10 Fréquencespropres Numérotation des fréquences propres Variation des composants horizontals de la raideur pour les paires d'identités pour les 10 premières fréquences propres. Module d'Young du béton 20GPa - Interpolée [1e5,1e5,1e13]N/m [5e5,5e5,1e13]N/m [1e6,1e6,1e13]N/m [5e6,5e6,1e13]N/m [1e7,1e7,1e13]N/m [5e7,5e7,1e13]N/m [1e8,1e8,1e13]N/m [5e8,5e8,1e13]N/m [1e9,1e9,1e13]N/m [5e9,5e9,1e13]N/m [1e10,1e10,1e13]N/m [5e10,5e10,1e13]N/m [1e11,1e11,1e13]N/m [5e11,5e11,1e13]N/m [1e12,1e12,1e13]N/m [5e12,5e12,1e13]N/m [1e13,1e13,1e13]N/m 7 COEFFICIENTS DE CORRELATION DES 17 SERIES ENTRE LES DEUX PLOTS (NUMERIQUE ET NUMERIQUE INTERPOLE) 0.9998 0.9985 0.9839 0.9959 0.9971 0.9967 0.9983 0.9999 1.0000 1.0000 1.0000 1.0000 1.0000 1.0000 1.0000 1.0000 1.0000Fig.2: Evolution of the first 10 natural frequencies as a function of the different elastomer stiffness for a cement Young’s Modulus of 20GPa : Numerical values. Fig.3: Evolution of the first 10 natural frequencies as a function of the different elastomer stiffness for a cement Young’s Modulus of 20GPa : Interpolated Numerical values. Values for the table are gotten from the diagonal of the matrix of the pairwise linear correlation coefficients from matlab Interpolation : Freqs x √((20/15)); E = 20GPa Alexander ABANOBI M2 SIM Relation tested : 𝐸 ∝ 𝑓2
- 8. 0 0.2 0.4 0.6 0.8 1 1.2 1 2 3 4 5 6 7 8 9 10 Fréquencespropres Numérotation des fréquences propres Variation des composants horizontals de la raideur pour les paires d'identités pour les 10 premières fréquences propres. Module d'Young du béton 23GPa [1e5,1e5,1e13]N/m [5e5,5e5,1e13]N/m [1e6,1e6,1e13]N/m [5e6,5e6,1e13]N/m [1e7,1e7,1e13]N/m [5e7,5e7,1e13]N/m [1e8,1e8,1e13]N/m [5e8,5e8,1e13]N/m [1e9,1e9,1e13]N/m [5e9,5e9,1e13]N/m [1e10,1e10,1e13]N/m [5e10,5e10,1e13]N/m [1e11,1e11,1e13]N/m [5e11,5e11,1e13]N/m [1e12,1e12,1e13]N/m [5e12,5e12,1e13]N/m [1e13,1e13,1e13]N/m 0 0.2 0.4 0.6 0.8 1 1.2 1 2 3 4 5 6 7 8 9 10 Fréquencespropres Numérotation des fréquences propres Variation des composants horizontals de la raideur pour les paires d'identités pour les 10 premières fréquences propres. Module d'Young du béton 23GPa - Interpolée [1e5,1e5,1e13]N/m [5e5,5e5,1e13]N/m [1e6,1e6,1e13]N/m [5e6,5e6,1e13]N/m [1e7,1e7,1e13]N/m [5e7,5e7,1e13]N/m [1e8,1e8,1e13]N/m [5e8,5e8,1e13]N/m [1e9,1e9,1e13]N/m [5e9,5e9,1e13]N/m [1e10,1e10,1e13]N/m [5e10,5e10,1e13]N/m [1e11,1e11,1e13]N/m [5e11,5e11,1e13]N/m [1e12,1e12,1e13]N/m [5e12,5e12,1e13]N/m [1e13,1e13,1e13]N/m 8 COEFFICIENTS DE CORRELATION DES 17 SERIES ENTRE LES DEUX PLOTS (NUMERIQUE ET NUMERIQUE INTERPOLE) 0.9998 0.9985 0.9839 0.9959 0.9971 0.9967 0.9983 0.9999 1.0000 1.0000 1.0000 1.0000 1.0000 1.0000 1.0000 1.0000 1.0000 Fig.4: Evolution of the first 10 natural frequencies as a function of the different elastomer stiffness for a cement Young’s Modulus of 23GPa : Numerical values. Fig.5: Evolution of the first 10 natural frequencies as a function of the different elastomer stiffness for a cement Young’s Modulus of 23GPa : Interpolated Numerical values. Interpolation : Freqs x √((23/15)); E = 23GPa Alexander ABANOBI M2 SIM
- 9. 9 0 0.2 0.4 0.6 0.8 1 1.2 1 2 3 4 5 6 7 8 9 10 NaturalFrequency(Hz) Numebering of the Natural Frequencies Comparison of the Natural Frequencies from the Numerical Model and those from the Experimental Model Experimental Model Numerical Model WORK ON NUMERICAL MODEL Alexander ABANOBI M2 SIM Correlation between experimental and numerical modal frequencies
- 10. NUMERICAL 3D MODE SHAPES 10 Alexander ABANOBI M2 SIM 3D Numerical Mode shapes of the first 10 modes Mode 1 Mode 10Mode 9Mode 8Mode 7Mode 6 Mode 5Mode 4Mode 3Mode 2
- 11. 11 NUMERICAL 2D MODE SHAPES Alexander ABANOBI M2 SIM 2D Numerical Mode shapes of the first 10 modes Mode 1 Mode 10Mode 9Mode 8Mode 7Mode 6 Mode 5Mode 4Mode 3Mode 2
- 12. 12 Field Notes Alexander ABANOBI M2 SIM Field Note showing the position of the sensors and pillars for each series of measurement
- 13. 13 Presentation of results Processing Numerical data to get rid of complications related to the numerical model Normalisation of readings so that every reading is a relative to the last sensor (synchronization) Fishing out of bad sensors Windowing : Moving window of 60seconds (60*200 samples) half a minute of overlap (6000 samples) in order to make spectrogrammes that are clean and clear with less amount of noise : (29 windows in total) and Averaging of each frequency line over the 29 windows. FFT was taken window by window. Choose the window and then take the FFT of that window Absolute value of the FFT (Fast Fourier Transfromation)–Transition to the frequency domain Rotation (about the z-axis) of the axis des données selon les pentes determinées par les coordonnées des pillers prises en comsol Reorganization of the sequence of the axis from (Z, X, Y) to a more familiar (X, Y, Z) Loading up of the raw data into Matlab ORGANOGRAM FOR EXPERIMENTAL DATA PROCESSING Alexander ABANOBI M2 SIM
- 14. 14 Average over these 29 windows reduces samples per sensor to 12,000 and removes noise. Alexander ABANOBI M2 SIM Fig. : Graphic showing how the windowing was carried out Windowing and Averaging
- 15. 15 Alexander ABANOBI M2 SIM • The rotation had to be done carefully and the manner in which the angles were taken from the COMSOL model had to be a factor in the manner of the rotation. • The angles were taken in COMSOL with clockwise angle as positive. Cosθ -Sinθ 0 Sinθ Cosθ 0 0 0 1 Rotation Matrix about the Z-axis Rotation schema Rotation Method
- 16. 16 Alexander ABANOBI M2 SIM Numerical Model of the bridge showing the only data points Nature of the numerical model
- 17. 17 Alexander ABANOBI M2 SIM 3D Experimental bridge model showing the position of sensors and pillars Position of Sensors And Pillars
- 18. 18 Alexander ABANOBI M2 SIM Numerical Model of the bridge showing the only data points Spectrograms
- 19. 19 Alexander ABANOBI M2 SIM Numerical Model of the bridge showing the only data points Spectrograms
- 20. 20 Alexander ABANOBI M2 SIM First mode shape in the X, Y and Z directions Mode 1 : X direction Mode 1 : Y direction Mode 1 : Z direction Numerical vs Experimental Mode Shapes (peak-picking)
- 21. 21 Alexander ABANOBI M2 SIM 8th mode shape in the Y-dircetion 2nd mode shape in the Y-dircetion Some higher modes
- 22. 22 21 22 23 24 25 26 27 28 pillars Position of pillar 21 to pillar 28. Mode shape 1. Position of pillars 21 – pillar 28
- 23. 23 Alexander ABANOBI M2 SIM Comparison of the frequency spectrum of the numerical and experimental models with stiffness (9 9 and 5% damping) Experimental Frequency Spectrum vs Numerical FRF with damping ratio 5% and stiffness of elastomer layer [1e9, 1e9, 1e13]N/m
- 24. Experimental Frequency Spectrum vs Numerical FRF with damping ratio 10% and stiffness of elastomer layer [1e9, 1e9, 1e13]N/m 24 Comparison of the frequency spectrum of the numerical and experimental models with stiffness ([1e9, 1e9, 1e13]N/m and 10% damping)
- 25. 25 Alexander ABANOBI M2 SIM Effect of stiffness on the first mode shape EFFECT OF STIFFNESS
- 26. 26 Alexander ABANOBI M2 SIM A dataset consists of the entire readings taken at once. There was a total of 19 datasets. Singular Value Decomposition First dataset Second dataset Average of all datasets
- 27. • Correlation parameter used to separate physical modes from non-physical ones. It assures consistency of a mode shape among the many measures and it not necessarily a criteria for validity of the mode shape. • MAC value of less than 80-85% shows the lower limits of the contribution of a certain frequency to the global shape of the mode. 27 Alexander ABANOBI M2 SIM Modal Assurance Criterion (MAC)
- 28. • The experimental mode shapes modeled the numerical ones to a good extent but the lesser precision (number of computation points and sensor accuracy) of the experimental model meant the modes were not as smooth as the numerical modes. • Futher work is being done to produce the mode shapes using the SVD method. • SVD is a more accurate method of deterimining the mode shapes followed by the correlation given by the Mac value. 28 Alexander ABANOBI M2 SIM Perspectives & Conclusion
- 29. THANKS FOR LISTENING 29 Alexander ABANOBI M2 SIM