Weekly Projects Update - w/e 20th January 2017
•
0 likes•404 views

AcuComm's weekly projects update - w/e 20th January 2017. For more information on our latest projects, visit our website: acucomm.net

Recommended
More Related Content
Viewers also liked
Viewers also liked (12)
More from AcuComm
More from AcuComm (20)
Recently uploaded
Recently uploaded (20)
Weekly Projects Update - w/e 20th January 2017
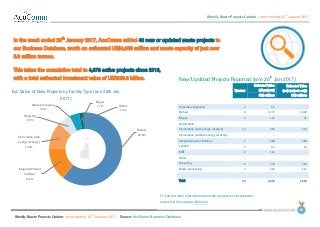
- 1. Weekly Waste Projects Update – week ending 20 th January 2017 Weekly Waste Projects Update: week ending 20 th January 2017 Source: AcuComm Business Database 01 2nd September 2016 New/Updated Projects Reported (w/e 20th Jan 2017) Number Estimated Value (all projects) Estimated Value (new projects only) US$ millionsUS$ millions Anaerobic Digestion 2 53 - Biofuel 8 1,777 1,600 Biogas 6 122 45 Gasification - - - Incineration (with energy recovery) 10 954 322 Incineration (without energy recovery) - - - Integrated/mixed facilities 1 380 380 Landfill 2 32 32 MBT 2 115 - Other - - - Recycling 6 170 150 Waste processing 3 432 112 Total 40 4,035 2,642 In the week ended 20th January 2017, AcuComm added 40 new or updated waste projects to our Business Database, worth an estimated US$4,035 million and waste capacity of just over 5.3 million tonnes. This takes the cumulative total to 4,678 active projects since 2013, with a total estimated investment value of US$359.6 billion. To find out more information about the projects and investments covered in this update, click here Biofuel 60.6% Integrated/mixed facilities 14.4% Incineration (with energy recovery) 12.2% Recycling 5.7% Waste processing 4.3% Biogas 1.7% Others 1.2% Est. Value of New Projects by Facility Type (w/e 20th Jan 2017)
- 2. Weekly Waste Projects Update – week ending 20 th January 2017 Weekly Waste Projects Update: week ending 20 th January 2017 Source: AcuComm Business Database 02 New/Updated Projects Reported (w/e 20th Jan 2017) Number Capacity (tonnes) MW Anaerobic Digestion 2 81,921 3 Biofuel 8 896,487 100 Biogas 6 318,707 13 Gasification - - - Incineration (with energy recovery) 10 2,317,794 285 Incineration (without energy recovery) - - - Integrated/mixed facilities 1 82,490 18 Landfill 2 411,553 7 MBT 2 139,500 31 Other - - - Recycling 6 609,816 - Waste processing 3 461,318 - Total 40 5,319,585 456 The total estimated waste capacity of projects reported on in the past week is just over 5.3 million tonnes. WtE incineration was the largest category, accounting for just over 2.3 million tonnes. The total estimated power generation from these projects was 456 MW. WtE incineration was the largest category, accounting for 285 MW. Incineration (with energy recovery) 43.6% Biofuel 16.9% Recycling 11.5% Others 28.1% Reported Capacity of Projects by Facility Type (w/e 20th Jan 2017) To find out more information about the projects and investments covered in this update, click here
- 3. Weekly Waste Projects Update – week ending 20 th January 2017 Weekly Waste Projects Update: week ending 20 th January 2017 Source: AcuComm Business Database 03 New Projects Reported by Waste Types (w/e 20th Jan 2017) Number Capacity (tonnes) MW Animal 2 237,237 1 Clinical - - - Construction/Demolition - - - e-Waste 2 101,026 - Food 1 57,427 2 Gas 2 58,400 7 Glass - - - Hazardous - - - Heat 2 265,176 - Industrial - - - Metals 1 212,673 - MSW 10 2,229,756 164 Oil - - - Organic (general/unspecified) 2 26,319 4 Other - - - Paper - - - Plant biomass (non-waste) - - - Plant biomass (waste) 3 409,158 113 Plastics 1 30,942 - Radioactive - - - Rubber - - - Sewage/wastewater 3 61,756 8 Wood 11 1,629,716 159 Total 40 5,319,585 456 MSW was the leading feedstock type reported on in the past week, accounting for an estimated 2.2 million tonnes, or 41.9% of the total. This was followed by wood with 1.6 million tonnes. MSW 41.9% Wood 30.6% Plant biomass (waste) 7.7% Others 19.8% Reported Capacity of Projects by Waste Type (w/e 20th Jan 2017) To find out more information about the projects and investments covered in this update, click here
- 4. Weekly Waste Projects Update – week ending 20 th January 2017 Weekly Waste Projects Update: week ending 20 th January 2017 Source: AcuComm Business Database 04 New/Updated Projects, Country Coverage, (w/e 20th Jan 2017) Projects USA 8 Australia 3 Canada 3 India 3 UK 3 United Arab Emirates 2 Turkey 2 Taiwan 2 Finland 2 Japan 2 Others 10 Total 40 The leading countries in the past week was the USA with eight projects. This was followed by the Australia, Canada, India and the UK with three each. 8 3 3 3 3 2 2 2 2 2 0 10 0 2 4 6 8 10 12 USA Australia Canada India UK UnitedArabEmirates Turkey Taiwan,ProvinceofChina Finland Japan Others Reported Projects by Country (w/e 20th Jan 2017) To find out more information about the projects and investments covered in this update, click here
- 5. Weekly Waste Projects Update – week ending 20 th January 2017 Weekly Waste Projects Update: week ending 20 th January 2017 Source: AcuComm Business Database 05 Average Project Values by Facility Type US$ millions Anaerobic Digestion 25 Biofuel 120 Biogas 27 Gasification 144 Incineration (with energy recovery) 107 Incineration (without energy recovery) 52 Integrated/mixed facilities 196 Landfill 22 MBT 67 Other 83 Recycling 35 Waste processing 86 All Projects 77 Average Project Values by Feedstock Type US$ millions Animal 18 Clinical 30 Construction/Demolition 7 e-Waste 22 Food 20 Gas 76 Glass 14 Hazardous 68 Heat 39 Industrial 120 Metals 48 MSW 90 Oil 43 Organic (general/unspecified) 83 Other 55 Paper 74 Plant biomass (non-waste) 117 Plant biomass (waste) 79 Plastics 23 Radioactive 605 Rubber 40 Sewage/wastewater 44 Wood 89 All Projects 77 The average active waste project is worth US$776 million. There are naturally wide variations in average project value, due to the size, duration and complexity of different types of project. The figures on this page represent our latest estimates, based on data from 2013 to the current week. To find out more information about the projects and investments covered in this update, click here
- 6. Weekly Waste Projects Update – week ending 20 th January 2017 Weekly Waste Projects Update: week ending 20 th January 2017 Source: AcuComm Business Database 06 Top Five Projects, week ending 20th January 2017, by Estimated Value (US$ millions) Click the flag for more information on each project 1 Estonia 1,248 Development of a €1 billion biorefinery. 2 Japan 380 Construction of a biogas and WtE plant. 3 Mexico 320 Development of a waste optimisation plant. 4 Canada 208 Construction of a 40 MW biomass facility. 5 Finland 154 Construction of a 54 MW WtE plant. Top Five Projects, week ending 20th January 2017, by Reported Waste Capacity (tonnes) 1 India 474,500 Construction of a 24 MW WtE facility. 2 UAE 300,000 Construction of a 300,000 tpa waste-to-energy plant. 3 Canada 278,506 Construction of a >30 MW net biomass facility. 4 India 237,250 Development of a 7 MW WtE plant. 5 Canada 200,000 Construction of a 40 MW biomass facility. Top Five Projects, week ending 20th January 2017, by Reported Power Generation (MW) 1 Finland 54 Construction of a 54 MW WtE plant. 2 UK 50 Construction of a 49.9 MW biomass plant. 3 Canada 40 Construction of a 40 MW biomass facility. 4 Canada 40 Construction of a >30 MW net biomass facility. 5 Turkey 35 Supply of a wood-fuelled biomass combined heat and power unit.
- 7. Weekly Waste Projects Update – week ending 20 th January 2017 Weekly Waste Projects Update: week ending 20 th January 2017 Source: AcuComm Business Database 07