2. 2
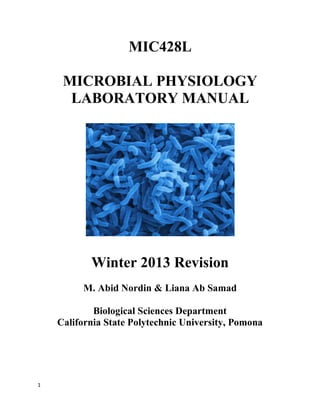
Cover Photo: Scanning Electron Micrograph of Vibrio cholerae, the causative agent of
Cholera. Photo credit: Johnathan Allen, Laurence Livermore National Laboratory
TABLE OF CONTENTS
LAB 1: BACTERIAL ENUMERATION, DILUTION & PLATING TECHNIQUES 3
LAB 2: BACTERIAL GROWTH CURVE 7
LAB 3: BIOFILMS 11
LAB 4: ENVIRONMENTAL STRESS SHOCK IN BACTERIA 13
LAB 5: REGULATION OF GENE EXPRESSION - THE LAC OPERON 16
LAB 6: MICROBIAL GENETICS - RESTRICTION MODIFICATION SYSTEM 20
LAB 7 PART I: GENETIC ENGINEERING 25
LAB 8: DETECTION OF QUORUM-SENSING COMPOUNDS 28
3. 3
LAB 1: REVIEW OF BACTERIAL ENUMERATION, DILUTION, AND
PLATING TECHNIQUES
INTRODUCTION
After having completed a basic microbiology course, you should be familiar with the following
skills:
• Aseptic technique
• Streak isolation
• Serial dilutions
• Determining viable numbers by plate counts
Aseptic technique is used to prevent contamination. This technique involves avoiding any
contact of the pure culture, sterile medium and sterile surfaces with other microorganisms.
This is accomplished by cleaning the work area with germicide, sterilizing the inoculating loop
by heat before and after transferring and working quickly and efficiently to minimize the time of
exposure during which contamination of the culture can occur. The standard steps for
transferring a culture from one tube or flask to another are:
1) Flame the loop and allow to air cool.
2) Open and flame the mouth of tubes/flasks
3) Pick up some of the culture growth and transfer to fresh medium
4) Flame the mouth of the tubes/flasks and reseal them
5) Re-flame the inoculation loop
A similar technique is used to transfer culture from a Petri dish (the only difference is that
you don't flame the Petri dish!) and to transfer cultures using sterile pipettes. The pipette canister
is flamed after removing top and then flamed again after removal of pipette before replacing top.
Caps, plugs or pipette canister tops should held sterile side down before replacing. Do not place
them on bench surface.
If using micropipettes, neither micropipettes nor tip boxes should be flamed but the test
tube or flask should always be flamed. Pipette tips are sterile and the micropipette never is in
contact with the broth culture. When removing a tip from a box, treat the container as you would
treat a Petri dish. Open the lid enough to remove a tip and replace the lid immediately.
Never leave the lid off the box. Discard the tips in a waste tip jar.
OBJECTIVE
The objective of this experiment is to review some basic microbiology techniques. Many of the
experiments that will be performed in MIC 428 require accurate bacteria titration and good
plating technique. We will enumerate cells using a common technique: viable counts.
4. 4
EXPERIMENTAL PROCEDURE
Aseptic technique and streak isolation.
Each group will work with
• 1 log phase Escherichia coli culture grown overnight in LB medium.
• 1 LB agar plate per group of 3-4 students.
• 1 tube of LB broth per person
• A liquid culture of Escherichia coli
Aseptic technique
Day 1:
Check to make sure you are sterilizing your loop properly. Take a loop full of culture, flame the
loop until sterile and put the loop into the tube of sterile LB broth. Repeat this 3 more times in
the same tube. Incubate at room temperature overnight.
Day 2:
Observe your tube of LB broth from the previous day. If your sterile technique was right, you
should see no growth in the tube.
Streak for isolation
Day 1:
Streak the culture for isolation on one plate of LB agar. Incubate the plates at room temperature
overnight.
Day 2:
Observe your LB plates streaked on the previous day. If your streak isolation technique was done
correctly, you should expect to see isolated colonies on the plates.
5. 5
Dilution Plating (Using the Spread Plate Technique)
Each group will dilute their E. coli culture to get 30-300 colonies when it is plated on LB plate.
You will use a culture of E. coli that contains approximately 108
CFU/ml (Colony Forming
Units/milliliter).
Materials needed per group
• Micropipettes and sterile tips
• Flask of sterile dilution buffer (150 ml saline)
• 10 Sterile empty microtubes
• 6 LB agar plates per group
• Spreader and ethanol for flaming
Day 1
Develop a dilution scheme in order to:
1. Have one set of duplicate plates containing 30-300 colonies.
2. Plate a volume of 0.1 ml per plate.
To help you figure this out, you can use this equation to calculate the total Colony Forming Units
(CFU) per milliliter of culture:
(Colonies Counted)
______________________________________________ = CFU/ml
(Volume of culture plated in ml) X (Dilution factor of your plated sample)
The easiest and most accurate dilution blanks to prepare contain 9 ml of dilution buffer, so all
your dilutions should be 1:10 dilutions.
To perform this exercise:
1. Prepare dilution tubes
2. Label plates
3. Dilute culture
4. Inoculate and spread plates
5. Incubate plates at room temperature overnight
Day 2
1. Record results. Count the plates containing 30-300 colonies per plate. Determine the
CFU/ml of the original culture.
6. 6
MIC 428
LAB 1: REVIEW OF BACTERIAL ENUMERATION, DILUTION AND PLATING
TECHNIQUE DATA SHEET
Date:
Group:
Plate Counts
E.coli plate count (CFU) Average Dilution CFU/ml
Plate 1 Plate 2
LAB REPORT
Data presentation and analysis.
Complete the E. coli plate count table.
Report the results of the aseptic technique and streak for isolation.
7. 7
LAB 2: BACTERIAL GROWTH CURVE
INTRODUCTION
Bacterial growth is defined as the increase in the number of cells and can be measured using any
property that increases linearly with cell number. There are several methods that can be used, but
here we will be using the turbidimetric and plate count methods.
OBJECTIVE
To measure the different stages of growth of a bacterial culture using turbidity and viable
count measurements,
To determine the number of viable cells/ml corresponding to one spectroscopic
absorbance unit using growth rate constant and generation time.
EXPERIMENTAL PROCEDURE
Growth of each culture will be determined by two different techniques:
• Increase in optical density.
• Increase in viable cell number.
Growing E. coli:
1. Each group will be provided with a 500 ml flask containing 250 ml of TGY medium warmed
to 37°C.
2. Using sterile technique, inoculate the medium with 15 ml of a fresh starter culture of E. coli
grown overnight in TGY medium.
3. Mix the culture well and using a fresh sterile pipette, aliquot a 5 ml sample to a sterile test
tube. Record the time and return flask to the shaker. This is Sample 1.
4. Return this flask to the shaking incubator for 15 minutes and collect another 5 ml aliquot.
Record the time and return flask to the shaker. This is Sample 2.
5. Repeat step 4 until you have 10 samples for every 15 minutes up to 135 minutes.
Note: ALWAYS STOP the shaker before removing or replacing flasks. ALWAYS return the
shaker to 200 rpm after removing or replacing flasks.
8. 8
Bacterial enumeration
To your 5-mL sample, perform the following 2 determinations: OD measurement and viable
count
A. Optical density measurements at 600 nm.
1. Using aseptic technique, transfer 4 ml from the sample into a cuvette and measure its OD
at 600 nm (OD600) in the Spec 20.
2. Repeat sampling and OD600 readings every 15 minutes.
3. Record the OD readings and the times at which you sampled.
Note: If the OD600 is greater than 1.0, dilute the sample appropriately with growth medium and
re-measure the OD600. Remember to RECORD DILUTION FACTOR, if any.
B. Viable Cell Number via Plating
1. Using aseptic technique, remove 0.1 ml of culture from the sample and make a series of
1:10 dilutions in sterile saline. (Pick for 4 time points)
2. Plate 0.1 ml of the 10-6
dilutions in duplicate onto TGY plates.
3. Incubate the plates at room temperature overnight.
4. Next lab, count colonies, calculates CFU/ml, and record data in table 2.
9. 9
LAB 2: BACTERIAL GROWTH CURVE DATA SHEET
Date:
Group number:
Group names:
Table 1. OD 600 measurements of E. coli during growth in TGY medium.
Sample # Minutes elapsed
since first reading
OD @ 600 nm Dilution
factor
1 0
2 1
3 30
4 45
5 60
6 75
7 90
8 105
9 120
10 135
Table 2. Plated viable counts of E. coli during growth in TGY medium.
Sample # Dilution factor Colonies in 0.1 ml Average CFU / ml of
culture
Plate 1 Plate 2
10. 10
LAB REPORT
Data presentation and analysis.
1. Plot OD 600 of the culture vs. time in minutes.
2. Plot CFU/ml vs. time in minutes
3. From the exponential part of the growth curve, calculate the generation time (G) of the two
cultures from the graph, in minutes. Do the same using the increase in viable counts. Are the
results comparable?
4. Using the appropriate equations, calculate the specific growth rate constant (k) in hr -1
for
both growth curves. Are the results comparable?
Equations:
The average time it takes for all the components in a culture to double is known as doubling
time/generation time where:
G (generation time) = (time (t), in minutes or hours)/n (number of generations)
G=t/n where, (logNt – logN0)
n = ------------------------
(log 2)
If N0 is the initial population, and the growth rate is k, then the population N at time t is:
Nt = N0ekt
(2.303)(logNt – logN0)
k = _________________
t
11. 11
LAB 3: BIOFILMS
INTRODUCTION
Biofilms are microbial communities attached to surfaces and embedded in a matrix mostly
composed of extracellular polysaccharides together with some proteins and nucleic acids. It is
now widely accepted that the most common way of living for bacteria, is not as isolated colonies
or free-floating (planktonic) cells, but as part of biofilm communities. Medically, biofilms are
implicated in many bacterial infections, including some urinary tract infections, and dental
plaque. This lab will demonstrate the ability of bacteria to form biofilms and ways to prevent
biofilm formation based on current scientific research.
OBJECTIVE
• To visually assess biofilm formation.
• To assess the ability of D-amino acids in preventing biofilm production.
• To compare the results of D-amino acid exposure across different bacterial species.
EXPERIMENTAL PROCEDURE
Six different microorganisms will be used
• S. aureus
• E. coli
• P. aeruginosa
• B. subtillis
• C. violaceum
• S. meliloti
1. Each group of students will receive a culture of one of the bacterial strains listed above.
2. Aseptically transfer a loop of bacteria to each of the four tubes filled with sterile medium.
3. Add enough D-tyrosine to two of the tubes so that the final concentration of D-tyrosine is
3μM. Label these tubes “D.”
4. Add enough L-tyrosine to two of the tubes so that the final concentration of L-tyrosine is
3μM. Label these tubes “L.”
5. Incubate the tubes overnight at 37°C.
6. Check to see if the duplicates of each tube show the same result.
7. Compare the results of the D and L tubes with that of the rest of the class.
12. 12
LAB 3: BIOFILMS DATA SHEET AND LAB REPORT
Date:
Group number:
Group names:
Table 1. Results of Biofilm Assay
Bacterial Strain Formation of Biofilm with
D-tyrosine
(YES/NO)
Formation of Biofilm with
L-tyrosine
(YES/NO)
S. aureus
E. coli
P. aeruginosa
B. subtilis
C. violaceum
S. melioti
13. 13
LAB 4: ENVIRONMENTAL STRESS SHOCK IN BACTERIA
INTRODUCTION
Microbes live in a variety of physical and chemical environments. In order to survive, they must
adjust to many environmental factors such as temperature, pH, oxygen concentration, physical
pressure, radiation, and nutrient limitation. The study of the effect of environmental factors on
microbes and the ways in which they adapt, allows us to understand the reasons why a particular
microbe may persist in a particular environment and also the limits of its physiological ability.
In Escherichia coli at least four stress regulons (many genes or operons under regulation by the
same protein) are involved in the protection against environmental stress, nutrient limitation and
damage caused by toxic or physical agents. The four major stress regulons are the heat shock,
oxidative stress, SOS, and stringent regulons. Each regulon produces enzymes or proteins that
protect the bacteria against stress damage. E. coli may induce any combination of regulons in an
attempt to survive.
OBJECTIVE
The objective of this experiment is to evaluate some of the methods by which bacterial cells are
capable of surviving in hostile environments.
EXPERIMENTAL PROCEDURE
Note: Cultures should remain shaking in the incubator whenever possible.
1. Take one 5 ml E. coli culture and clearly label it with your group number and your name.
2. Pre-treat your culture accordingly for 30 minutes.
Pretreatment: Each group should add prescribed pretreatment from stock solution to tube of
E. coli culture, unless you are a control group. Calculate the correct concentration to add
(hint: remember your old friend C1V1=C2V2?). All cultures except 42˚C pretreatment
should be incubated in a 30°C shaking waterbath.
3. After 30 minutes add the shock treatment
Shock Treatment: After pretreatment, add the prescribed shock treatment chemical to cell
suspension or if your treatment is high temperature, move your cultures to the 50°C
waterbath. Again add the correct volume for the required concentration from the stock
solution.
4. At 0, 20 and 40 min after the addition of shock treatment, prepare 10-fold serial dilutions (10-2
to 10-5
) in saline (total volume of 1 ml) for each time point.
5. Spread plate 0.1 ml of dilutions 10-2
to 10-5
on agar plates.
6. Incubate plates at 37°C overnight.
7. Next lab record plate count data. Complete data sheet, calculate the percentage of survivor
cells and record class data (see lab report instructions).
14. 14
Group number Pretreatment Shock treatment
1 Control 10 mM H2O2
2 60 mM H2O2 10 mM H2O2
3 Control 50 °C
4 42 °C 50 °C
5 Control 10 % ethanol
6 4 % ethanol 10 % ethanol
H2O2 supplied at 3% stock.
EtOH supplied at 95% stock solution.
Note: All “normal” conditions are at 30˚C unless otherwise stated.
15. 15
LAB 4: ENVIRONMENTAL STRESS SHOCK IN BACTERIA
DATA SHEET AND LAB REPORT
Date:
Group number:
Group names:
E. coli pretreatment:
E. coli shock treatment:
0.1 ml of each dilution.
TNTC = too numerous to count
Data presentation and analysis.
Group data:
Complete the E. coli plate count table.
Calculate the percentage of survivors for each time point.
Percentage of survivors = CFU/ml at time interval x 100%
CFU/ml at time 0
Dilution/ CFU E. coli plate count data at time intervals (CFU/ml)
0 min 20 min 40 min
10-2
10-3
10-4
10-5
16. 16
LAB 5: REGULATION OF GENE EXPRESSION THE LAC OPERON
PART I: ENZYME ACTIVITY ASSAY
INTRODUCTION
Bacteria are extremely adaptable organisms, and as such, they may temporarily activate gene
systems on or off to cope with their environment. The lac operon in E. coli is one of the most
heavily studied and best examples of such gene regulation. In this operon, lactose induces the
synthesis of the enzymes involved in its breakdown. In the absence of lactose, these enzymes are
not required and have no other major physiological function, so they are not synthesized.
OBJECTIVES
To understand the function and regulation of the lac operon.
To understand enzyme induction.
To understand catabolite repression.
Principle of the β-Galactosidase Assay.
β -Galactosidase is an enzyme that hydrolyzes β -D-Galactosides. By using the chemical
onitrophenyl-β-D-Galactoside (ONPG) we can measure the amount of enzyme present. This
compound is colorless, but in the presence of β -Galactosidase it is converted to galactose and o-
nitrophenol. The latter compound is yellow and can be measured by its absorption by
spectroscopy at 420 nm. The amount of o-nitrophenol produced is proportional both to the
amount of enzyme present and to the time the enzyme reacts with the ONPG.
EXPERIMENTAL PROCEDURE
Part I:
Growth of cells and induction of lac Operon
A culture of an E.coli strain grown in tryptone broth medium will be provided. Dilute 2 ml of
this culture into 22 ml of fresh tryptone broth medium.
Set up 6 different cultures and make the following additions:
1. No addition (control).
2. Lactose (final concentration 0.4%) add 1 ml of 10%.
3. IPTG (final concentration 1.0 mM) add 1 ml of 25 mM.
4. Glucose (final concentration 0.4%) add 1 ml of 10%
5. IPTG plus glucose. (1 ml each)
6. Lactose plus glucose (1 ml each)
Each group of students will be assigned two different cultures to process. Grow these cultures for
90 minutes (cultures must double at least twice before assay). Measure the OD at 600 nm and
record it. Carry out duplicate β-galactosidase assays for each culture.
17. 17
Assay of β - Galactosidase
Into each assay tube put:
1. 1.0 ml of medium E.
2. 0.2 ml of E. coli culture.
3. 1 drop of 0.1% SDS.
4. 1 drop of chloroform (DO THIS IN THE FUME HOOD).
5. Vortex for 10 seconds.
6. To each tube add 0.5 ml of ONPG (4 mg/ml solution).
7. Incubate tubes at 37°C until sufficient yellow. Keep track of each tube’s time. It usually
takes 5-10 minutes.
8. Stop the reaction by adding 1 ml of 1 M Na2CO3 solution.
9. Spin the tubes at low speed in a desktop centrifuge for 5 min.
10. Make a blank containing 0.2 ml of medium E and set the Spec20 to 0 abs.
11. Read the absorbance at 420nm in the Spec20.
Calculate Enzyme Activity
Convert the absorbance at 420 to micromoles of o-nitrophenol by multiplying the absorbance by
0.38.
Divide by the time of incubation in minutes to get micromoles per minute.
Divide by volume of culture used in ml, to get micromoles per minute per ml.
Compare the β -galactosidase activity of your group with the rest of the class.
18. 18
LAB 5: REGULATION OF GENE EXPRESSION THE LAC OPERON
PART 2: GENE EXPRESSION SCREENING
INTRODUCTION
In the first part of this lab you have quantified β - galactosidase activity using ONPG. β-
galactosidase activity can also be evaluated by using the lactose analog, X-gal (5-bromo-4-
chloro-3-indolyl-beta-galactoside). β - galactosidase hydrolyzes X-gal forming a blue precipitate.
So, bacteria which produce β-galactosidase produces blue colonies when grown in the presence
of X-gal. This assay is most often used to assay bacterial transformations in what is known as a
“Blue/White” screen. In this second part of the lab, you will also use IPTG as an inducer of the
lac operon. IPTG (isopropyl-β -D-thiogalactopyranoside) is a chemical analog of lactose that
cannot be cleaved by the enzyme β -galactosidase. IPTG is used together with X-gal to determine
lac gene expression in recombinant methods. It can serve as an inducer for activity of the E. coli
lac operon by binding and inactivating the lac repressor.
EXPERIMENTAL PROCEDURE
1. Label 4 X-gal plates per group:
a. gluc plate (for cells growing in glucose)
b. lac plate (for cells growing in lactose)
c. gluc + lac (for cells previously grown in glucose to which lactose will be added)
d. gluc + IPTG (for cells previously grown in glucose to which IPTG will be added.)
2. You will have two tubes with 5 mL of E.coli grown overnight in:
a. tryptone broth + 0.4% glucose
b. tryptone broth + 0.4% lactose
3. Streak your gluc plate with a loop of E coli grown in glucose in order to obtain isolated
colonies.
4. Streak your lac plate with a loop of E coli grown in lactose, in order to obtain isolated
colonies.
5. Divide the 5 ml of Tube 1 into two tubes (use sterile tubes) and add the following to each
tube (don’t forget your old friend C1V1=C2V2):
c. 10 % lactose to a final concentration of 0.4%
d. 25 mM IPTG to a final concentration of 1.0 mM
6. Incubate these two tubes at 37°C with shaking. After 75 minutes, remove the cultures
from the waterbath and streak each tube into the appropriate plate (gluc+ lac or gluc +
IPTG).
7. Incubate all the plates at 37°C overnight.
8. Interpret your results.
19. 19
LAB 5: REGULATION OF GENE EXPRESSION THE LAC OPERON
DATA SHEET AND LAB REPORT
Date:
Group number:
Group names:
β-Galactosidase activity
Treatment Optical density
@420nm
Time
(min)
Culture volume
(ml)
Enzyme activity
(µmole/min/ml)
Control
Glucose
Lactose
IPTG
IPTG + Glucose
Glucose + Lactose
White/Blue Screen
Treatment White/Blue colonies?
Glucose
Lactose
Glucose + Lactose
Glucose + IPTG
Data presentation and analysis.
1. Complete the table
2. What are inducers and repressors?
3. Base on the results, what do you understand about the role of glucose, lactose and IPTG
in lac operon gene expression?
20. 20
LAB 6: MICROBIAL GENETICS
THE RESTRICTION MODIFICATION SYSTEM
OBJECTIVES
• To learn how the bacteria protect themselves from foreign DNA intrusion.
• To be familiar with restriction enzyme digestion and gel electrophoresis of DNA
• To learn how to analyze the restriction map of a plasmid DNA
INTRODUCTION
DNA exchanges among bacterial species occur frequently through various gene exchange
mechanisms, such as the DNA transformation, cell-cell conjugation, and bacteriophage
transduction. While gene exchanges may facilitate evolution and adaptation, they may often
result in deadly or undesirable mutations in the bacteria. As a self defense, bacteria have evolved
a mechanism to prevent free genetic exchange between unrelated species.
Such system is call restriction-modification. In this system, two enzymes (proteins)
have to pair together to make the system work. The first molecule is called the restriction
enzyme or restriction endonuclease that cleaves DNA at a specific sequence. For example, the
restriction enzyme MboI recognizes and cleaves at any GATC sequence in a DNA as indicated in
the table below. You may notice that the recognition sequence are palindromic, which is true for
type II restriction enzymes. This group of restriction enzymes is very useful in the recombinant
DNA technique. Examples of restriction enzymes and their cutting sites are listed in Table 1.
Table 1. Examples of restriction enzymes and their recognition/cleavage sites.
* Please note how the name is written. The abbreviation of the bacterial species should be
italicized and the Roman number is not italicized.
** Isoscizomers are restriction enzymes that recognize the same recognition sequence
Restriction
enzyme*
Recognition/cleavage
site
Produced in this
bacterium
Eco RI G↓AATTC E. coli RY13
Bam HI G↓GATCC Bacillus amyloliquefaciens II
Hind III A↓AGCTT Haemophillus influenza Rd
Mbo I** ↓GATC Moraxella bovis
Sau3A 1** ↓GATC Staphylococcus aureus 3A
Sma I CCC↓GGG Serratia marcescens Sb
21. 21
The restriction enzymes are specific to each bacterium and allow the bacterium to cleave
foreign DNA. To protect the bacterium from cleaving self DNA, the second molecule, the
modification enzyme, has to be present to alter its own DNA to make themselves immune to its
own restriction enzymes. An example of the modification enzyme is the DNA adenine methylase
(Dam) in Moraxella bovis which methylates the adenine bases in the sequence.
After methylation, the Mbo I recognition site is masked and will not be recognized by
Mbo I produced from its own cell. Therefore, the methylated self DNA will escape its own
restriction digestion. Interestingly, an isoscizomer, Sau3A I, produced by Staphylococcus aureus,
is found to be insensitive to Dam mehylation. Therefore, it can cleave both nonmethylated and
methylated DNA. Table 2 shows the outcomes of the restriction modification system in two
different bacteria.
Table 2. Protection of self DNA by Dam methylation in Moraxella bovis, but not in
Staphylococcus aureus.
In this exercise, we will practice the restriction digestion of methylated and nonmethylated
DNAs by the restriction enzymes, Mbo I and Sau3A I.
EXPERIMENTAL PROCEDURE:
I. Restriction digestion
1. Each group will receive two tubes each of MboI and Sau3AI reaction mix containing 8 μl
of the master reaction mix. You will also be given 6 μl each of the methylated (DH5α)
and non-methylated (JM110) pUC19 plasmid DNA.
2. Label one MboI tube with ‘m+’ (for methylated DNA) and the other with ‘m-‘(for non-
methylated DNA). Label the Sau3AI tubes similarly.
3. Add 2 μl of plasmid DNA (DH5α /methylated DNA) to the tubes labeled ‘m+’
4. Add 2 μl of plasmid DNA (JM110 /non-methylated DNA) to the tubes labeled ‘m-’
5. Incubate the samples at 37°C water bath for ~40min.
6. While waiting for the digestion, prepare the un-digested plasmid DNA controls using the
remaining 2 µl of the DNA in the tube. To each DNA tube, add 8 µl of 1x TAE running
buffer to make the final volume at 10 µl.
7. After the digestion is completed, add 2 μl loading dye into each tube including the four
digested samples and the two un-digested controls.
8. The samples are ready for gel electrophoresis
Cut by Mbo I?
(In Moraxella
bovis)
Cut by Sau3A I?
(In S. aureus 3A)
Non-methylated
DNA
(non-self)
5’….↓GATC.…3’
3’…. CTAG↑...5’
Yes Yes
Methylated DNA
(self)
5’….↓G Am
TC.…3’
3’…. C T Am
G↑...5’
No Yes
22. 22
II. Casting a 1% agarose gel
1. Place the gel casting stand flat on the bench. Put the small gel tray into the gel casting
stand and place the 8-well comb in the proper position.
2. Weigh 0.15 g agarose on a weighing paper. Pour the agarose into a 200 ml flask
containing 15 ml of 1x TAE gel running buffer. Mix well.
3. Microwave at high heat at a 20-second interval until completely dissolved. Mix and
observe in between each heating to avoid boiling over. It usually takes within 1 minute
and 30 second to completely dissolve the agarose.
4. Allow the molten agarose to cool for 3 minutes on the bench (to below 70°C).
5. Pour the agarose into the gel tray. Wait at least 10 minutes until it solidifies.
6. Once the gel is solidified, slowly lift the comb and the gel tray is ready for
electrophoresis.
III. Gel electrophoresis
1. Place the gel/tray in the center of the gel box, with the wells at the negative electrode
side.
2. Pour the gel running buffer (1x TAE) in the gel box until the gel is completely
submerged under the buffer.
3. Aspirate 10 μl of the molecular weight marker. Make sure there is no excessive liquid
stick to the exterior of the tip or you could lean the tip against the inside of the tube to
remove it.
4. Submerge the loaded tip inside the first well of the gel (the first on the left). Do not
touch or poke into the bottom of the well. After positioning your tip steadily in the well,
slowly press the Pipetman to release the sample into the well. The sample should sink
down to the bottom immediately.
5. Continue loading the samples in the order listed below. For the best result, do not shake
the gel and gel box to disturb the loaded samples.
Lane 1 2 3 4 5 6 7
DNA marker m+ m- m+/MboI m-/MboI m+/Sau3AI m-/Sau3AI
10 μl 10 μl 10 μl 10 μl 10 μl 10 μl 10 μl
6. Close the lid and connect to the power supply.
7. Press <On/Off> to turn on the power supply. Watch out the electrode <+/-> for correct
orientation.
8. Press <Voltage> until the light next to “125V” is on.
9. Press <Set> to start the run. Watch for the migration of sample/dye toward the center
(positive electrode). If not, stop immediately.
10. Run the gel for ~15 minutes until the dye front reaches ~2/3 of the gel.
11. Stop the run by pressing <On/Off> again.
12. Disassemble the gel apparatus. Take the gel with the gel tray to be imaged under UV
illumination.
23. 23
IV Data analysis
1. How to read the bands on an agarose gel? Use the DNA molecular
weight markers as a guide. Molecular weight markers are DNAs of
known sizes and are available commercially. HyperLadder I used in
this exercise should generate a banding pattern as shown here.
Smaller DNA will run faster and appear toward the bottom of the
gel.
2. Undigested plasmid DNA will show a cluster of 1-3
bands around the size of the plasmid (e.g. 2.6 kb for
pUC19). A good quality plasmid preparation should
have the majority in the supercoiled form which will
run smaller than the linear DNA. Damages in DNA
in single or both strands will yield the relaxed
circular and linear form, respectively. The linear
form of pUC19 should be around 2.6 kb.
3. How to calculate the digested fragments/bands? You will need to analyze the restriction
map of the plasmid, pUC19. The map shown here does not include the Mbo I or Sau3A I
sites which are too many to be included. There are a total of 15 GATC sites (Mbo I and
Sau3A I) in pUC19 and the nucleotide number of each GATC site is listed below.
Location of each GATC site in the plasmid
(nucleotide number listed):
276 417 1372 1447 1458
1466 1544 1556 1661 2002
2020 2066 2324 2341 2377
24. 24
LAB 6: MICROBIAL GENETICS - THE RESTRICTION MODIFICATION SYSTEM
DATA SHEET AND LAB REPORT
Date:
Group number:
Group names:
Include a picture of your gel and label the lanes and the size of each molecular weight marker.
Estimate the fragment (band) sizes and record the digestion result here.
Lane 2 3 4 5 6 7
Sample m+ m- m+/MboI m-/MboI m+/Sau3AI m-/Sau3AI
Estimated
fragment
size
(bp)*
Plasmid
digested or
not?
Sensitive to
methylation?
Is the result
expected?
* List the largest 4 bands if more bands are observed. Estimate the band size based on the
molecular markers. The distance of migration is inversely proportional to the molecular
size.
Draw conclusions about what your data specifically means. (Hint: which enzyme digests which
plasmid and which enzyme does not digest which plasmid)
25. 25
LAB 7 GENETIC ENGINEERING
PART I: DESIGNING TRANSFORMATION PLASMIDS
INTRODUCTION
Scientists from many different disciplines have used the technique of genetic engineering to
genetically alter bacteria and eukaryotic organisms. In genetic engineering, genes are isolated
from one organism and incorporated into other bacterial or eukaryotic cells. To genetically
engineer a bacterium by using transformation, the desired gene is first inserted into a plasmid
vector. Next, the recombinant plasmid is acquired by the bacterium. If the gene is expressed in
the cell, the cell will produce a new protein product. In this exercise, we will use a piece of DNA
containing the coding sequence of green fluorescent protein (GFP) and plasmid containing an
ampicillin-resistance gene (bla), the transcription factor araC (this will drive transcription of GFP
in the presence of the sugar arabinose) and a Multiple Cloning Site (MCS) to transform an
antibiotic-sensitive strain of E. coli. The DNA and plasmid will be ligated together using DNA
ligase, and the ligated DNA will be used to transform the E. coli. A successful transformation
will result in the E. coli producing GFP, glowing green under UV light. The plasmid and GFP
DNA have already been cut and isolated for you (EcoRI and XbaI were used). We will be using
the free bioinformatics software “A Plasmid Editor” (aPe) to design this plasmid vector. Below
is the plasmid map for pJR before and after adding the GFP sequence.
EXPERIMENTAL PROCEDURE
Note: This procedure should come immediately after learning how to use aPe to design plasmids
per your instructor’s lesson.
1. Add 10μL of Ligation Buffer to a sterile microcentrifuge tube.
2. Add 1μL of DNA Ligase.
3. Add 4μL of GFP DNA.
4. Add 5μL of plasmid DNA.
5. Incubate at room temperature overnight. This is what you will use to transform your
bacteria next class period.
26. 26
LAB 7 GENETIC ENGINEERING
PART II: TRANSFORMING BACTERIA
INTRODUCTION
Now that you have made a plasmid vector, you will transform E. coli bacteria. Generally,
bacteria are able to acquire small pieces of DNA from their environment, but this process is not
efficient enough for large-scale transformation. Transformations use calcium chloride (CaCl2 )
and heat shocking to make the bacterial cell more likely to uptake the plasmid vector. Upon
completion of this lab, you should see some bacterial colonies glowing green under UV light.
Also, you will use the free bioinformatics software “A Plasmid Editor” (aPe) to design a plasmid
to carry a gene of your choice.
EXPERIMENTAL PROCEDURE
1. Obtain two microcentrifuge tubes and label them “+ plasmid” and “- plasmid.”
2. Add 250 μl of CaCl2 to each tube.
3. Place these tubes on ice.
4. Aseptically scoop up a colony of E. coli bacteria from the provided plate and spin the loop
in the “+ plasmid” tube for 5 seconds, then place the tube back on ice.
5. Repeat this process for the “- plasmid” tube.
6. Add 10 μl of the plasmid from last week to the “+ plasmid” tube and mix by inversion.
7. Put both tubes back on ice for 10 minutes.
8. While the tubes are on ice, label your plates as follows:
a. + PLASMID LB/AMP
b. + PLASMID LB/AMP/ARA
c. – PLASMID LB/AMP
d. – PLASMID LB
9. Remove both tubes from the ice and incubate them at 42ºC for EXACTLY 50 seconds.
10. Immediately put the tubes on ice for 2 minutes.
11. Add 250 μl of LB broth to each tube, and let them sit at room temperature for 10 minutes.
12. Pipette 100 μl of the contents in the “+ plasmid” tube on to the “+ PLASMID LB/AMP”
plate.
13. Pipette 100 μl of the contents in the “+ plasmid” tube on to the “+ PLASMID
LB/AMP/ARA” plate.
14. Pipette 100 μl of the contents in the “- plasmid” tube on to the “- PLASMID LB/AMP”
plate.
15. Pipette 100 μl of the contents in the “- plasmid” tube on to the “- PLASMID LB” plate.
16. Incubate all of the plates at 37ºC overnight.
17. Observe the colonies on each plate under both normal and UV light next class section.
27. 27
LAB 7: GENETIC ENGINEERING
DATA SHEET AND LAB REPORT
Date:
Group number:
Group names:
Table 1. Plate counts of bacteria on various growth media.
Plate # of CFU Color under normal
light
Color under UV
light
+ PLASMID
LB/AMP
+ PLASMID
LB/AMP/ARA
- PLASMID
LB/AMP
- PLASMID LB
Calculate the efficiency of transformation for your experiment
(Number of glowing bacteria / number of non-glowing bacteria X 100%) for the LB/AMA/ARA
plate only.
Extra credit assignment (5 points)
Once all of the transformations have been completed, work design a plasmid that carries a gene
of your choosing. Indicate which restriction enzymes that you are using, which gene you are
cloning in, and what the final plasmid map will look like. Your gene of interest does not have to
be an “indicator” gene (GFP, BFP, YFP, etc), but rather can be any gene that you would like to
include. List it out on an email with aPe file that have your designed plasmid attached.
28. 28
LAB 8: QUORUM SENSING:
THE DETECTION OF QUORUM-SENSING COMPOUNDS
INTRODUCTION
Quorum sensing in Gram-negative bacteria
The regulatory mechanism known as quorum sensing is an environmental sensing system
that allows bacteria to monitor their own population density and to couple cell population density
with gene expression. Bacteria produce a small diffusible signal molecule called an autoinducer.
These signal molecules diffuse from the bacterial cell and accumulate in the environment as a
function of cell growth. Once cells grow to high density, the population is "quorate"; the
autoinducer concentration reaches a threshold and interacts with a transcriptional activator
protein to couple the expression of certain genes (or set of genes) with cell population density.
Genes transcribed in response to quorum-sensing mechanisms are diverse and are related
to bioluminescence production, antibiotic biosynthesis, plant nodulation, biofilm formation,
plasmid conjugal transfer, exopolysaccaride biosynthesis, production of virulence factors,
bacterial swarming as well as transition into the stationary phase, among others.
In Gram-negative bacteria, most but not all of the autoinducers belong to the family of
Nacylhomoserine lactones (AHLs). Autoinducers are produced in very low quantities, but their
detection has been greatly facilitated by the development of sensitive bioassays that allow fast
screening of microorganisms for diffusible signal molecules. These methods involve the use of
bacteria that cannot synthesize AHLs and harboring a reporter gene, or mutants that cannot
synthesize AHLs, thus requiring the expression of the reporter gene or the complementation of
the mutant phenotype by the addition of the exogenous AHL. A very useful detection system is
based on the induction or inhibition of violacein production in a mutant strain of
Chromobacterium violaceum, a Gram-negative bacterium commonly found in soil and water.
Chromobacterium violaceum CV026 as a biosensor:
Chromobacterium violaceum is a Gram-negative bacterium that produces a purple
pigment, violacein, under quorum sensing control. The strain used as a biosensor,
Chromobacterium violaceum CV026, is a mini-Tn5 mutant strain unable to produce AHL and
thus unable to produce the purple pigment. Upon the addition of external AHL, the mutation is
complemented and violacein is produced. This is the basis of the direct assay with
Chromobacterium violaceum CV026, which detects AHLs with acyl-side chains with 4 to 8
carbon atoms. A positive result is the production of a purple halo on a white background.
The presence of antagonistic AHLs can inhibit the complementation of the mutation. So,
if the biosensor strain is put in the presence of the natural inducer and an antagonistic AHL is
present as well, the mutation will not be complemented. This is the basis of the reverse assay
with Chromobacterium violaceum CV026, which detects AHLs with acyl side chains longer than
8 carbon atoms. A positive result is the production of a while halo on a purple background.
29. 29
Bioluminescence in Vibrio (Photobacterium) fischeri.
Bioluminescence is the production of light by living organisms. It is a feature of many
deep-sea fishes, crustaceans, and other marine animals. On land, bioluminescence is seen in
some nocturnal insects such as glow-worms and fireflies, and in certain bacteria and fungi.
Light is usually produced by the oxidation of luciferin, a reaction catalyzed by the enzyme
luciferase, or by the protein GFP (Glowing Fluorescent Protein).
Cultures of Vibrio fischeri only begin to emit light once the cell density has reached a certain
level and AHLs are produced. Bioluminescence is under quorum-sensing control.
Observation of bioluminescence: (DEMO ONLY)
OBJECTIVE
To understand the use of a biosensor for the detection of quorum-sensing compounds.
To detect quorum-sensing compounds using Chromobacterium violaceum CV026 as a
biosensor.
To observe bioluminescence.
EXPERIMENTAL PROCEDURE
Preparation of quorum-sensing compounds:
1. Melt the semi-solid medium and put it in a 55°C water bath.
2. Pipette 1 ml of each bacterial suspension into a microtube
3. Centrifuge the tubes at 10000 rpm for 3 minutes.
4. Remove each supernatant and place it into another labeled sterile microtube.
5. Prepare a moderately turbid suspension of C. violaceum in sterile distilled water (if
unsure, ask your instructor if the turbidity is adequate).
Preparation of the direct assay plates:
1. Label 2 petri dishes to get a duplicate of your test. Divide the plate in 4. Each area will be
used to test one bacterial supernatant.
2. Using a sterile Q-tip, carefully spread the C. violaceum suspension. Note: The amount of
suspension has to be enough to completely cover the surface with a very thin liquid layer.
3. Let the plate dry.
4. Gently pipette 5 μl of the supernatant to be tested. Note: Don't break the agar, just place
the drop without touching the surface.
5. In the center of the plate, pour a 5 μl of the commercial AHL as a positive control.
6. Let the plate dry.
7. Incubate the plates at 28°C.
8. The instructor will remove the plates from the incubator after 24hs and place them in a
refrigerator to read them the next laboratory period.
30. 30
Preparation of the reverse assay plates:
1. Label 2 petri dishes to get a duplicate of your test. Divide the plate in 4. Each area will be
used to test one bacterial supernatant.
2. Place 5 μl of each bacterial supernatant in each area of the Petri dish. The Pseudomonas
aeruginosa supernatant is supposed to be your positive control.
3. Let the plate dry.
4. While the plate is drying out, prepare the tubes as follows:
5. Pour 5 ml of the semi-solid molten medium. If you are not going to process the tubes
immediately, place them into the water bath. Add 100 μl of the moderately turbid
bacterial suspension previously prepared. Vortex the mixture. Add 2 μl of the commercial
AHL and vortex the mixture. Note: the AHL is dissolved in dimethylformamide which is
a very volatile solvent. Add the commercial AHL into the mixture being sure that the tip
touches the mixture.
6. Pour this mixture onto the surface of the agar plate prepared as indicated above.
7. Even out the overlay and let it dry.
8. Incubate the plates at 28°C.
9. The instructor will remove the plates from the incubator after 24hs and place them in a
refrigerator to read them the next laboratory period.
31. 31
LAB 8: QUORUM SENSING
DATA SHEET AND LAB REPORT
Date:
Group number:
Group names:
Record the results and make conclusions as a group.
Microorganism Direct assay Reverse assay
Chromobacterium violaceum
Pseudomonas aeruginosa
Serratia marcescens
Aeromonas hydrophila
For your discussion, try referring to the literature and researching online and find out
1. What does each positive and negative result represents in this assay?
2. Why some species of bacteria produces quorum sensing compound and others do not?
3. What is the importance of manipulating quorum sensing mechanism of bacteria to us?