1. CAD Report 104AAE Group Members: Adam Rush, Steven Kendell, Abhishek Dabas Page 1 of 9
CAD Report for Module 104AAE
The group that thisreportconcernswas:
AdamRush,StevenKendell,AbhishekDabas.(There were twoothermemberswhodropped
out of the group duringthe course theywere TanuChaturbedi andKarolinaKuk.)
Introduction
Honeycomb structures are commonly found in aerospaceapplicationsand haveexceptional strength
to weightratiowhichisnecessaryformanystructural componentsespeciallyinaircrafts.High
strengthmaterial suchas steel andtitaniumhave significantly largerweightthanweakermaterials
(copper).Thisresultsinacompromise tobe made;where amaterial hassufficientstrengthandis
relativelylightsuchasaluminium.Thismakesaluminiumaperfectmaterial tocreate a honeycomb
structure from.Whendesigningsuchstructuresitisadvantageoustopredictthe capabilitiesof the
designedstructure before itismanufactured.“Finite elementanalysis(FEA) isacomputerized
methodforpredictinghowaproduct reactsto real-worldforces,vibration,heat,fluidflow,and
otherphysical effects.”(http://www.autodesk.com 10/12/15) FEA can alsogive visualisationsof
deformation,displacementandthe Stressdistributionswithinthe structure. The objectiveof this
workis to create a honeycombstructure fromAluminium3003 and use FEA to testitsphysical
propertiesinthe Wand L direction.
Honeycomb Core Structure.
The Beginning:
Once the group had beenestablished,we all decidedto tackle the honeycombcore asour
CAD project.Thiswe all feltwasthe one bestsuitedtoour skillsandconfidence inourCAD
capabilities.
From there we all startedgoingthroughthe tutorialsorplayingaroundwithcreatinga
(honeycomb) cellinCatia.Afterawhile membersof the grouphadmade differentlevelsof progress.
StevenandDean(Abhishek) hadgone throughthe tutorialswhereasAdamhadworkedtowards
creatinga honeycombcell.Butthere wasa problemwithone of ourfoundinggroupmembers, Tanu
had decidedtogopart time inher learningandtherefore droppedthe CADmodule.Howeveranew
memberwasfoundinKarolina.Fromhere all membersof the groupworkedoncreatingthe full
honeycombstructure asdefinedinthe courseworkhandout.
The Middle:
All membersmade significantprogresswithcreatingthe fullstructure,we all learnedvarious
methodsof creatinga cell andthenwe learnedvariouswaysof multiplyingthatcell togive usa full
20 by 22 structure of cells. One of the more challengingpartsof the modellingwascreatingthe
thicknessof the cell walls,one methodusedwastocreate a polygonaroundthe initial polygonand
setthe distance betweenthe innerandouterpolygonstothe requiredamount.
The End:
By the time the secondsubmissionwasapproachingwe nearlyhadafull working
honeycombcreatedbySteven,thisishow he didit.Itwas created,firstbyproducinga hexagonal
shape ina plane,producingaconstraintwhere the sidesare of length4.1mm.Fourmore were then
createdparallel toeachotherto create 5 columns,eachhexagonisseparatedby0.1mm.Using the
axistool I placeda vertical line thatwasparallel tothe vertical cell wallsof the hexagon,separated
2. CAD Report 104AAE Group Members: Adam Rush, Steven Kendell, Abhishek Dabas Page 2 of 9
by 0.5mm fromthe hexagoninthe lastcolumn.Iusedthe mirror tool,whichallowedforme to
selectthe 5 hexagonsandmirrorthemalongthe axis,I repeatedthisselectingthe 10hexagonsand
mirroringthemina newaxis,resultingin20 columns.We thenexitedthe planeandusedthe pad
tool,tickingthe box labelled‘thick’,thensetthickness1& 2 to 0.5mm. I thencreatedanotherimage
inthe same plane beneaththe firstrow,creating20 columnsof hexagonsonce again.A constraint
betweenthe firstrowsinnercell wallandthe secondrowscell wall of 0.5mmwas created.This
ensuredthatwhenthe padtool was usedon the secondpart,and the correct thicknesseswasset,
that the vertical wallswouldbe 0.2mmthick,comparedtothe otherswallsthicknessof 0.1mm.
I mirroredeachpart separately,mirroringthe firstrow 11 times,thenrepeatingforthe secondrow,
thuscreatinga total of 22 rows.By creatinga distance of 2.021mm betweenthe axisline andthe
bottomof the rowof hexagonsIwasable to mirror the row of hexagonssothat theyconnected with
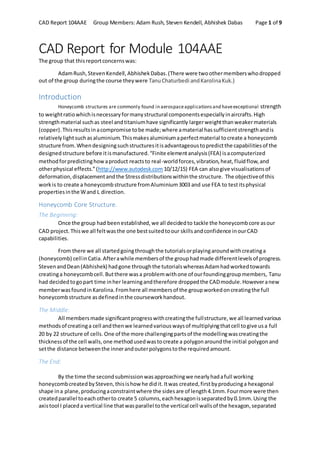
the correct measurementstothe rowsof hexagonsadjacent.A picture of the CATIA model isshown
inFigure 1.
The group was organisedandkeptontrack by the use of the WhatsAppappand outlook
e-mail’snew groupsetting,sothatfilescouldbe shared.
FEA Testing and analysis.
Adam Rush’s Tests:
“For the testingandanalysisIdecidedtobase my investigationsonthe VonMisesstress
levelsthatare showninthe CatiaFEA component.Havingneverheardof VonMisesstressIdecided
to lookitup on the internet.Ifoundthis:
“Accordingto the von Mises’stheory,aductile solidwill yieldwhenthe distortionenergy
densityreachesacritical value forthat material …At the instance of yieldinginauniaxial tensile
test,the state of stressintermsof principal stressisgivenby:σ1= σY (yieldstress) andσ2= σ3 = 0.”
(http://web.mae.ufl.edu)
Essentiallythisissayingthat,if 𝜎1, 𝜎2 and 𝜎3 are the stresslevelsinthe planes 𝑥, 𝑦and 𝑧,thenwhen
the stresslevel inthe 𝑥 plane isequal tothe yieldstressof the material then the stressesinthe
othertwo planesare zero.Fromthiswe can saythat the VonMisesstressesare a measure of the
level of stressina3D plane inrelationtothe yieldstressof the material.
Figure 1: HoneycombModel.
3. CAD Report 104AAE Group Members: Adam Rush, Steven Kendell, Abhishek Dabas Page 3 of 9
To testthe honeycombstructure Isetthe meshsize to5mm. From here I startedwith
compressioninthe L plane.Isetclampson the bottomrow of the structure at the lowestpoint
available,therewere 20clampsusedto ensure thatthe whole structure wascovered.Thenthe load
was appliedtothe toprow onthe highestpointsavailable,there were also20load points.However
due to the staggerednature of the honeycombthe loadswere notdirectlyabove the clampsso
there wouldbe anoffsetinthe motionincompressing the honeycomb.One possibleway roundthis
wouldbe to adda plate tothe topand bottomof the honeycombandplace loadsandclampson
that instead,butthenthisstructure wouldalsohave tobe accountedfor.
Once the loadsand clampswere inplace I startedwitha loadof 100N and recordedthe Von
Misesstress,here Ichose to go for an average stresslevelswhenlookingatthe model,Ialsodecided
to findthe cell withthe maximumstressandrecordthatvalue.The max stressturnedout to be in
the lowerleftcorner,thiswasexpecteddue tothe offsetinpositionof the clampsandloads.
Table of loadsin the L direction.
Load Weight Average VonMisesStress Higheststressedcell
100N 1.37𝑒6 𝑁𝑚2 2.54𝑒6 𝑁𝑚2
200N 2.74𝑒6 𝑁𝑚2 5.08𝑒6 𝑁𝑚2
300N 4.11𝑒6 𝑁𝑚2 7.62𝑒6 𝑁𝑚2
400N 5.48𝑒6 𝑁𝑚2 1.02𝑒7 𝑁𝑚2
500N 6.85𝑒6 𝑁𝑚2 1.27𝑒7 𝑁𝑚2
600N 8.22𝑒6 𝑁𝑚2 1.52𝑒7 𝑁𝑚2
700N 9.59𝑒6 𝑁𝑚2 1.78𝑒7 𝑁𝑚2
800N 1.10𝑒7 𝑁𝑚2 2.03𝑒7 𝑁𝑚2
900N 1.23𝑒7 𝑁𝑚2 2.29𝑒7 𝑁𝑚2
1000N 1.37𝑒7 𝑁𝑚2 2.54𝑒7 𝑁𝑚2
1100N 1.51𝑒7 𝑁𝑚2 2.79𝑒7 𝑁𝑚2
1200N 1.64𝑒7 𝑁𝑚2 3.05𝑒7 𝑁𝑚2
1300N 1.78𝑒7 𝑁𝑚2 3.30𝑒7 𝑁𝑚2
1400N 1.92𝑒7 𝑁𝑚2 3.56𝑒7 𝑁𝑚2
1500N 2.06𝑒7 𝑁𝑚2 3.81𝑒7 𝑁𝑚2
1600N 2.19𝑒7 𝑁𝑚2 4.07𝑒7 𝑁𝑚2
1700N 2.33𝑒7 𝑁𝑚2 4.32𝑒7 𝑁𝑚2
1800N 2.47𝑒7 𝑁𝑚2 4.57𝑒7 𝑁𝑚2
1900N 2.60𝑒7 𝑁𝑚2 4.83𝑒7 𝑁𝑚2
2000N 2.74𝑒7 𝑁𝑚2 5.08𝑒7 𝑁𝑚2
The structure hadnot failedat2000N, but itwas severelycompressedatthispoint.The compression
wouldhave ledtothe part beingunusable atthisload.
For testingthe W directionIdecidedtohave the leftside of the honeycombasmyloadpointand
the right side asthe clamp point,Iusedthe same methodas withthe loadinginthe L direction.
Average VonMisesStresstable forloadsinthe W direction.
4. CAD Report 104AAE Group Members: Adam Rush, Steven Kendell, Abhishek Dabas Page 4 of 9
Load Weight Average VonMisesStress Higheststressedcell
100N 1.68𝑒6 𝑁𝑚2 3.34𝑒6 𝑁𝑚2
200N 3.36𝑒6 𝑁𝑚2 6.68𝑒6 𝑁𝑚2
300N 5.04𝑒6 𝑁𝑚2 1.00𝑒7 𝑁𝑚2
400N 6.72𝑒6 𝑁𝑚2 1.34𝑒7 𝑁𝑚2
500N 8.40𝑒6 𝑁𝑚2 1.67𝑒7 𝑁𝑚2
600N 1.01𝑒7 𝑁𝑚2 2.00𝑒7 𝑁𝑚2
700N 1.18𝑒7 𝑁𝑚2 2.34𝑒7 𝑁𝑚2
800N 1.34𝑒7 𝑁𝑚2 2.67𝑒7 𝑁𝑚2
900N 1.51𝑒7 𝑁𝑚2 3.01𝑒7 𝑁𝑚2
1000N 1.68𝑒7 𝑁𝑚2 3.34𝑒7 𝑁𝑚2
1100N 1.85𝑒7 𝑁𝑚2 3.67𝑒7 𝑁𝑚2
1200N 2.02𝑒7 𝑁𝑚2 4.01𝑒7 𝑁𝑚2
1300N 2.18𝑒7 𝑁𝑚2 4.34𝑒7 𝑁𝑚2
1400N 2.35𝑒7 𝑁𝑚2 4.68𝑒7 𝑁𝑚2
1500N 2.52𝑒7 𝑁𝑚2 5.01𝑒7 𝑁𝑚2
1600N (*) 2.69𝑒7 𝑁𝑚2 5.34𝑒7 𝑁𝑚2
1700N 2.86𝑒7 𝑁𝑚2 5.68𝑒7 𝑁𝑚2
1800N 3.02𝑒7 𝑁𝑚2 6.08𝑒7 𝑁𝑚2
1900N 3.19𝑒7 𝑁𝑚2 6.35𝑒7 𝑁𝑚2
2000N 3.36𝑒7 𝑁𝑚2 6.68𝑒7 𝑁𝑚2
(*) Atthispointthe structure collapsed,forcomparisonhoweverIcontinuedtoincrease the loadsso
that I couldcompare the stresslevels inbothdirections.
Since a table witha listof numberscan sometimesbe hardto analyse Ihave decidedtoplotthe
informationintoagraph.
As we can see fromthe chart, the stresslevelsare higherinthe Wplane than inthe L plane,alsothe
maximumstressesare alsorespectivelyhigher.Asstatedinthe table forthe W plane the structure
0
10
20
30
40
50
60
70
100
200
300
400
500
600
700
800
900
1000
1100
1200
1300
1400
1500
1600
1700
1800
1900
2000
VonMisesStress(×e6Nm2)
Load (N)
Von Mises Stress in both L and W planes
Avg. Stress L Plane
Max Stress L Plane
Avg. Stress W Plane
Max Stress W Plane
5. CAD Report 104AAE Group Members: Adam Rush, Steven Kendell, Abhishek Dabas Page 5 of 9
failedat1600N but I continuedwiththe analysistocompare the twoplansaccurately.Itcan be seen
that the stresslevelsare proportionaltothe loads. “
StevenKendell’sTests:
“Finite ElementAnalysis
To analyse the Honeycombmodel,IusedCATIA generativestructural analysisfeature.Before
submittingmymodel intoFEA,Idefinedthe material propertiesfollowingthe specificationthatwas
given.Totestthe honeycombstructure Isetthe meshsize to5mm. Firstof all I testedthe model in
the L plane,placingloadsoneachof the 20 verticesonthe toprow of the honeycomb,Ithenset
clampson the bottomrow. There wasa slightoffsetdue tothe staggerednature of the Model.I
foundthe average andmaximumdisplacementof the honeycombatdifferentloads.The loadedand
restrainedmodel isshowninFigure 2.
Anothermaterial wasalsotested,“Aluminiumhoneycombis available infourdifferentalloys,
aerospace grades5052 and5056, and commercial grades3104 and 3003.” (http://www.hexcel.com
10/12/15)
The material Ichose to compare withAluminium3003 was Aluminium5056. The Physical properties
of thisalloywasfoundusingthe MatWeb:Online MaterialsInformationResource.Figure3
highlightsthe physical propertiesthatwere necessarytocompute the analysis.
Figure 2: Loadedand RestrainedModel.
6. CAD Report 104AAE Group Members: Adam Rush, Steven Kendell, Abhishek Dabas Page 6 of 9
The difference inYieldstrengthwill allow forananalysisof the Honeycombswhere thereisa
difference inthe plasticity.
(http://www.matweb.com 10/12/15)
The resultsof the finite
elementanalysisof
Aluminium3003
showedthatthe
average andmaximum
Vonmisesstresswas
constantfor a given
load,and wasnot
dependantonthe
aluminiumalloy.We
founda linear
relationshipbetweenVonmisesstressandthe force
appliedtothe structure,the steepnessof the curve
showsthe amountof stressexperiencedbythe model perLoadapplied.Figure4showsthat the
curve withthe steepestgradientwasforthe max stressexperiencedbythe model whenthe load
was appliedinthe Wdirection.Therefore,the model will experience plasticdeformationundera
smallerloadthanif the loadwas appliedinthe L plane.
The resultsthatoccurredfor Aluminium5052 were identical tothatof Aluminium3003, however
the yieldstrengthof
Aluminium5052 is
90MPa. Therefore a
much greaterloadcan
be appliedtothe
honeycombbefore
plasticdeformation
takesplace.
Youngs Modulus Yield Strength
Aluminium 3003 69GPa 40MPa
Aluminium 5056 71.0GPa 150MPa
Figure 3: Physical Propertiesof AluminiumAlloys
usedinAnalysis.
FIGURE 4
FIGURE 5
7. CAD Report 104AAE Group Members: Adam Rush, Steven Kendell, Abhishek Dabas Page 7 of 9
AbhishekDabas’s Results:
Here are the resultsthatDean hasgathered.
LAVG LMAX WAVG WMAX
100 1.08 2.15 3.21 6.42
200 2.15 4.3 6.43 12.9
300 3.23 6.45 9.64 19.3
400 4.3 8.6 12.9 25.7
500 5.38 10.8 16.1 32.1
600 6.46 12.9 19.3 38.5
700 7.53 15.1 22.5 44.9
800 8.61 17.2 25.7 51.4
900 9.68 19.4 28.9 57.8
1000 10.8 21.5 32.1 64.2
1100 11.8 23.7 35.3 70.6
1200 12.9 25.8 38.5 77
1300 14 28 41.8 83.5
1400 15.1 30.1 45 89.9
1500 16.1 32.3 48.2 96.3
1600 17.2 34.4 51.4 103
1700 18.3 36.6 54.6 109
1800 19.4 38.7 57.8 116
1900 20.4 40.9 61 122
2000 21.5 43 64.2 128
0
20
40
60
80
100
120
140
100
200
300
400
500
600
700
800
900
1000
1100
1200
1300
1400
1500
1600
1700
1800
1900
2000
VonMises(MPa)
Loads (N)
Von Mises Stress (Dean)
Avg Von Mises L Direction
Max Von Mises L Direction
Avg Von Mises W Direction
Max Von Mises W Direction
8. CAD Report 104AAE Group Members: Adam Rush, Steven Kendell, Abhishek Dabas Page 8 of 9
As youcan see the graph showsthat there isa linearrelationbetweenloadandVonMisesstress
levels.
Comparisonof the FEA’s
The four differentsetsof dataallow usto make a strongcomparisonbetweenthe loadand
the VonMisesstressvalues.Althoughthe testswere carriedoutbydifferentpeopleindifferent
waysand had the unitsgivenindifferentways,we cansaythat there isdefinitelyalinearrelation
betweenthe Loadandthe comparative VonMisesstress.Each of the graphs show a roughlystraight
line increasingfromlefttoright,since eachof the graphsshow the same linearpatternwe can
conclude thatthe data gatheredare consistentatleastwitheachother.
Startingwiththe L plane,we canconclude thatfor everyXnewtonloadamountthere will
be a correspondingYvalue forthe VonMisesstress,thisvalue will be inthe formof Y=mX+c where
bothm and c are constantsfor the equation butwhenthe loadisa 0N the stresslevel will be a0 as
well therefore we canconclude thatc has a value of 0. Infact thisequation 𝑦 = 𝑚𝑥+ 𝑐 holdstrue
for eachsetof data gathered,the onlydifference isinthe valuesof m,since c will alwaysbe 0when
the loadis at 0N. It can be seenfromthe graphsthat the value form increasesaslookat different
parts of the data,hence the graph. The bottomline inthe graph showsthe valuesforthe L plane at
an average value forVonMisesstress,the secondline showsvaluesforthe L plane butthistime at
the max value forVonMisesstress.The thirdline shows,however,the valuesforthe Wplane at the
average value forVonMisesstressandthe fourthshowsthe valuesforthe W plane at the max value
for VonMisesstress.Here we mustnote that there isa difference inthe gradientof the line forthe
W plane comparedto the L plane inboth the average valuesandthe max valuesof VonMisesstress.
In notingthiswe can begin tosay that there islessstructural stabilityinthe Wplane thaninthe L
plane,thiscanbe saidbecause itcan clearlybe seenthatthere are higherstressvaluesinthe W
plane comparedtothe L plane.The reasonforthe lowerstructural stabilitycouldbe inthe factthat
inthe L plane the vertical wallshave athicknessof 0.2mmwhereasinthe W plane the
corresponding“vertical”wallsonlyhave athicknessof 0.1mm.
There are waysthat we couldoptimise thisdesignbothinthe testingof the designandinits
complete state.Firstlyfortestingwe couldaffix platestothe topand bottom, or to the leftandright
handsides,of the structure and use those to fullydistribute the weightacrossthe whole structure,
but the downside tothispotentialmethodwouldbe thatthiswouldcause anincrease inthe weight
of the structure and itsstability,the ideabehindthe honeycombstructure isthatitislightweight
and flexibleinthe Land W planesbutrigidinthe T plane. Inthe designof the honeycombwe could
make all vertical wallsineitherdirection0.2mmratherthanjust inthe L plane.Idon’tthinkthis
wouldseriouslyincreasethe weightof the objectandit wouldgive comparable strengthinin
compressioninboththe L plane andin the W plane.
In Conclusion:
Althougheachmemberof the groupcame at the task withdifferentideasandskillsetswe
have all foundthat we have learnedsomethingnew whilstdoingthisproject.We managedtocreate
a workinghoneycombstructure andwe all managedtotestit inFEA. Althoughourmethodsof
creatingand testingwere differentwe foundthatthe resultsthatwe eachobtainedwere
comparable whichwouldsuggestthatthe resultswere eitherthe same orsimilarenough. Onthe
downside thoughwe were hopingtohave enoughtime tooptimisethe designandcreate abetter
honeycombthanwhenwe started,butwithillnessesandpeopledroppingoutwe foundourselves
9. CAD Report 104AAE Group Members: Adam Rush, Steven Kendell, Abhishek Dabas Page 9 of 9
out of time to do the optimisation,butwe canlearnfromthisfor the nextprojectthat we come to
as a group.
References:
http://web.mae.ufl.edu: http://web.mae.ufl.edu/nkim/eas4200c/VonMisesCriterion.pdf (04/12/15)
http://www.autodesk.com:http://www.autodesk.com/solutions/finite-element-analysis(10/12/15)
http://www.hexcel.com:http://www.hexcel.com/Resources/DataSheets/Brochure-Data-
Sheets/Honeycomb_Attributes_and_Properties.pdf (10/12/15)
http://www.matweb.com:http://www.matweb.com/search/datasheet.aspx?matguid=aaaabe41a20
a4ed2b48270f7f2ef1b2d (10/12/15)