SlideShare a Scribd company logo
1 of 7
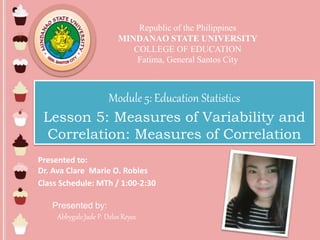
Republic of the Philippines
MINDANAO STATE UNIVERSITY
COLLEGE OF EDUCATION
Fatima, General Santos City
Module 5: Education Statistics
Lesson 5: Measures of Variability and
Correlation: Measures of Correlation
Presented to:
Dr. Ava Clare Marie O. Robles
Class Schedule: MTh / 1:00-2:30
Presented by:
Abbygale Jade P. Delos Reyes
To compute the
Pearson’s Product
Moment
Correlation
accurately.
Pearson’s Product-
Moment Correlation
• This measure of relation is used
when factors to be correlated are
both metric data. By metric data
are meant measurements, which
can be subjected to the four
fundamental operations.
Conception, Benjamin.et.al. (2016). LET Reviewer: MET Review Center, Manila.
1. Compute the sum of each set of scores
(SX, SY).
2. Square each score and sum the square
(SX2, SY2).
3. Count the number of paired
observations (N).
4. Multiply each X score by its
corresponding Y score.
5. Sum the score products X and Y (SXY).
6. Calculate the correlation.
Conception, Benjamin.et.al. (2016). LET Reviewer: MET Review Center, Manila.
r =
𝑁 ∑𝑋𝑌 − ∑𝑋 ∑𝑌
𝑁 ∑𝑋2−(∑𝑋)2 𝑁 ∑𝑌2− (∑𝑌)2
Where,
N = number of paired observations
SXY = sum of the cross products of
X and Y
SX = sum of the scores under
Variable X
SY = sum of the scores under
Variable Y
(SX)2 = sum of X scores squared
(SY)2 = sum of Y scores squared
SX2 = sum of squared X scores
SY2 = sum of squared Y scores
Conception, Benjamin.et.al. (2016). LET Reviewer: MET Review Center, Manila.
Example: Scores of 10 students in
1st (X) and 2nd (Y) Test
X Y 𝑿 𝟐 𝒀 𝟐 XY
86 87 7396 7569 7482
88 87 7744 7569 7656
90 92 8100 8464 8280
95 97 9025 9409 9215
93 92 8649 8464 8556
89 88 7921 7744 7832
94 95 8836 9025 8930
96 97 9216 9409 9312
81 82 6561 6724 6642
87 86 7569 7396 7482
∑𝑋 = 899 ∑Y = 903 ∑𝑋2= 81017 ∑𝑌2= 81773 ∑XY= 81387
r =
𝑁 ∑𝑋𝑌 − ∑𝑋 ∑𝑌
𝑁 ∑𝑋2−(∑𝑋)2 𝑁 ∑𝑌2− (∑𝑌)2
Given Formula:
r =
[10 81387 − 899 903 ]
10 81017 − 8992 [10 81773 − 9032 ]
r =
2073
√(1969)(2321)
This indicates a very high degree of
relationship exists between the test
scores in 1st and 2nd test.

More Related Content

Similar to Measures of Variability and Correlation

Anova Presentation
Anova PresentationAnova Presentation
Anova PresentationWyena Cheah
 
A note on estimation of population mean in sample survey using auxiliary info...
A note on estimation of population mean in sample survey using auxiliary info...A note on estimation of population mean in sample survey using auxiliary info...
A note on estimation of population mean in sample survey using auxiliary info...Alexander Decker
 
Measures of Central Tendency.pptx
Measures of Central Tendency.pptxMeasures of Central Tendency.pptx
Measures of Central Tendency.pptxMelba Shaya Sweety
 
one way anova.pptx
one way anova.pptxone way anova.pptx
one way anova.pptxSoujanyaLk1
 
Statistics - ONE WAY ANOVA
Statistics - ONE WAY ANOVAStatistics - ONE WAY ANOVA
Statistics - ONE WAY ANOVASimranSayed1
 
Measures of central tendency - STATISTICS
Measures of central tendency - STATISTICSMeasures of central tendency - STATISTICS
Measures of central tendency - STATISTICSindianeducation
 
Analysis of variance (ANOVA)
Analysis of variance (ANOVA)Analysis of variance (ANOVA)
Analysis of variance (ANOVA)Sneh Kumari
 
Module
ModuleModule
Moduleasha
 
Module stats
Module statsModule stats
Module statsNidhi
 
Educational statistics
Educational statisticsEducational statistics
Educational statisticsNishat Anjum
 
analytical representation of data
 analytical representation of data analytical representation of data
analytical representation of dataUnsa Shakir
 
Business Research Methods PPT -IV
Business Research Methods PPT -IVBusiness Research Methods PPT -IV
Business Research Methods PPT -IVRavinder Singh
 
An alternative approach to estimation of population
An alternative approach to estimation of populationAn alternative approach to estimation of population
An alternative approach to estimation of populationAlexander Decker
 
Unit 1 - Measures of Dispersion - 18MAB303T - PPT - Part 2.pdf
Unit 1 - Measures of Dispersion - 18MAB303T - PPT - Part 2.pdfUnit 1 - Measures of Dispersion - 18MAB303T - PPT - Part 2.pdf
Unit 1 - Measures of Dispersion - 18MAB303T - PPT - Part 2.pdfAravindS199
 
Advanced statistics Lesson 1
Advanced statistics Lesson 1Advanced statistics Lesson 1
Advanced statistics Lesson 1Cliffed Echavez
 

Similar to Measures of Variability and Correlation (20)

Correlating test scores
Correlating test scoresCorrelating test scores
Correlating test scores
 
Anova Presentation
Anova PresentationAnova Presentation
Anova Presentation
 
A note on estimation of population mean in sample survey using auxiliary info...
A note on estimation of population mean in sample survey using auxiliary info...A note on estimation of population mean in sample survey using auxiliary info...
A note on estimation of population mean in sample survey using auxiliary info...
 
Measures of Central Tendency.pptx
Measures of Central Tendency.pptxMeasures of Central Tendency.pptx
Measures of Central Tendency.pptx
 
Central Tendency & Dispersion
Central Tendency & DispersionCentral Tendency & Dispersion
Central Tendency & Dispersion
 
Central Tendancy.pdf
Central Tendancy.pdfCentral Tendancy.pdf
Central Tendancy.pdf
 
one way anova.pptx
one way anova.pptxone way anova.pptx
one way anova.pptx
 
Statistics - ONE WAY ANOVA
Statistics - ONE WAY ANOVAStatistics - ONE WAY ANOVA
Statistics - ONE WAY ANOVA
 
Measures of central tendency - STATISTICS
Measures of central tendency - STATISTICSMeasures of central tendency - STATISTICS
Measures of central tendency - STATISTICS
 
Analysis of variance (ANOVA)
Analysis of variance (ANOVA)Analysis of variance (ANOVA)
Analysis of variance (ANOVA)
 
Module
ModuleModule
Module
 
Module stats
Module statsModule stats
Module stats
 
Educational statistics
Educational statisticsEducational statistics
Educational statistics
 
analytical representation of data
 analytical representation of data analytical representation of data
analytical representation of data
 
Business Research Methods PPT -IV
Business Research Methods PPT -IVBusiness Research Methods PPT -IV
Business Research Methods PPT -IV
 
An alternative approach to estimation of population
An alternative approach to estimation of populationAn alternative approach to estimation of population
An alternative approach to estimation of population
 
measures-of-central-tendency.pdf
measures-of-central-tendency.pdfmeasures-of-central-tendency.pdf
measures-of-central-tendency.pdf
 
Unit 1 - Measures of Dispersion - 18MAB303T - PPT - Part 2.pdf
Unit 1 - Measures of Dispersion - 18MAB303T - PPT - Part 2.pdfUnit 1 - Measures of Dispersion - 18MAB303T - PPT - Part 2.pdf
Unit 1 - Measures of Dispersion - 18MAB303T - PPT - Part 2.pdf
 
Advanced statistics Lesson 1
Advanced statistics Lesson 1Advanced statistics Lesson 1
Advanced statistics Lesson 1
 
Anova.ppt
Anova.pptAnova.ppt
Anova.ppt
 

More from Abbygale Jade

DepEd Order no. 42 s. 2016
DepEd Order no. 42 s. 2016DepEd Order no. 42 s. 2016
DepEd Order no. 42 s. 2016Abbygale Jade
 
Handout for Linear Programming
Handout for Linear ProgrammingHandout for Linear Programming
Handout for Linear ProgrammingAbbygale Jade
 
Freedom Writers Reflection
Freedom Writers ReflectionFreedom Writers Reflection
Freedom Writers ReflectionAbbygale Jade
 
Detailed Lesson Plan in Mathematics
Detailed Lesson Plan in MathematicsDetailed Lesson Plan in Mathematics
Detailed Lesson Plan in MathematicsAbbygale Jade
 
Common Photography Compositions
Common Photography CompositionsCommon Photography Compositions
Common Photography CompositionsAbbygale Jade
 
Excerpt from The Family Code of The Philippines
Excerpt from The Family Code of The PhilippinesExcerpt from The Family Code of The Philippines
Excerpt from The Family Code of The PhilippinesAbbygale Jade
 

More from Abbygale Jade (12)

DepEd Order no. 42 s. 2016
DepEd Order no. 42 s. 2016DepEd Order no. 42 s. 2016
DepEd Order no. 42 s. 2016
 
Microsoft Excel
Microsoft ExcelMicrosoft Excel
Microsoft Excel
 
Jadee's certificate
Jadee's certificateJadee's certificate
Jadee's certificate
 
My 10 commandments
My 10 commandmentsMy 10 commandments
My 10 commandments
 
Handout for Linear Programming
Handout for Linear ProgrammingHandout for Linear Programming
Handout for Linear Programming
 
Linear programming
Linear programmingLinear programming
Linear programming
 
Freedom Writers Reflection
Freedom Writers ReflectionFreedom Writers Reflection
Freedom Writers Reflection
 
Detailed Lesson Plan in Mathematics
Detailed Lesson Plan in MathematicsDetailed Lesson Plan in Mathematics
Detailed Lesson Plan in Mathematics
 
Common Photography Compositions
Common Photography CompositionsCommon Photography Compositions
Common Photography Compositions
 
ED 107
ED 107ED 107
ED 107
 
Excerpt from The Family Code of The Philippines
Excerpt from The Family Code of The PhilippinesExcerpt from The Family Code of The Philippines
Excerpt from The Family Code of The Philippines
 
EdTech
EdTechEdTech
EdTech
 

Recently uploaded

Russian Escort Service in Delhi 11k Hotel Foreigner Russian Call Girls in Delhi
Russian Escort Service in Delhi 11k Hotel Foreigner Russian Call Girls in DelhiRussian Escort Service in Delhi 11k Hotel Foreigner Russian Call Girls in Delhi
Russian Escort Service in Delhi 11k Hotel Foreigner Russian Call Girls in Delhikauryashika82
 
SOCIAL AND HISTORICAL CONTEXT - LFTVD.pptx
SOCIAL AND HISTORICAL CONTEXT - LFTVD.pptxSOCIAL AND HISTORICAL CONTEXT - LFTVD.pptx
SOCIAL AND HISTORICAL CONTEXT - LFTVD.pptxiammrhaywood
 
Seal of Good Local Governance (SGLG) 2024Final.pptx
Seal of Good Local Governance (SGLG) 2024Final.pptxSeal of Good Local Governance (SGLG) 2024Final.pptx
Seal of Good Local Governance (SGLG) 2024Final.pptxnegromaestrong
 
Grant Readiness 101 TechSoup and Remy Consulting
Grant Readiness 101 TechSoup and Remy ConsultingGrant Readiness 101 TechSoup and Remy Consulting
Grant Readiness 101 TechSoup and Remy ConsultingTechSoup
 
Gardella_PRCampaignConclusion Pitch Letter
Gardella_PRCampaignConclusion Pitch LetterGardella_PRCampaignConclusion Pitch Letter
Gardella_PRCampaignConclusion Pitch LetterMateoGardella
 
Sports & Fitness Value Added Course FY..
Sports & Fitness Value Added Course FY..Sports & Fitness Value Added Course FY..
Sports & Fitness Value Added Course FY..Disha Kariya
 
psychiatric nursing HISTORY COLLECTION .docx
psychiatric  nursing HISTORY  COLLECTION  .docxpsychiatric  nursing HISTORY  COLLECTION  .docx
psychiatric nursing HISTORY COLLECTION .docxPoojaSen20
 
Presentation by Andreas Schleicher Tackling the School Absenteeism Crisis 30 ...
Presentation by Andreas Schleicher Tackling the School Absenteeism Crisis 30 ...Presentation by Andreas Schleicher Tackling the School Absenteeism Crisis 30 ...
Presentation by Andreas Schleicher Tackling the School Absenteeism Crisis 30 ...EduSkills OECD
 
Unit-IV- Pharma. Marketing Channels.pptx
Unit-IV- Pharma. Marketing Channels.pptxUnit-IV- Pharma. Marketing Channels.pptx
Unit-IV- Pharma. Marketing Channels.pptxVishalSingh1417
 
Web & Social Media Analytics Previous Year Question Paper.pdf
Web & Social Media Analytics Previous Year Question Paper.pdfWeb & Social Media Analytics Previous Year Question Paper.pdf
Web & Social Media Analytics Previous Year Question Paper.pdfJayanti Pande
 
Mixin Classes in Odoo 17 How to Extend Models Using Mixin Classes
Mixin Classes in Odoo 17  How to Extend Models Using Mixin ClassesMixin Classes in Odoo 17  How to Extend Models Using Mixin Classes
Mixin Classes in Odoo 17 How to Extend Models Using Mixin ClassesCeline George
 
Gardella_Mateo_IntellectualProperty.pdf.
Gardella_Mateo_IntellectualProperty.pdf.Gardella_Mateo_IntellectualProperty.pdf.
Gardella_Mateo_IntellectualProperty.pdf.MateoGardella
 
Nutritional Needs Presentation - HLTH 104
Nutritional Needs Presentation - HLTH 104Nutritional Needs Presentation - HLTH 104
Nutritional Needs Presentation - HLTH 104misteraugie
 
Accessible design: Minimum effort, maximum impact
Accessible design: Minimum effort, maximum impactAccessible design: Minimum effort, maximum impact
Accessible design: Minimum effort, maximum impactdawncurless
 
Z Score,T Score, Percential Rank and Box Plot Graph
Z Score,T Score, Percential Rank and Box Plot GraphZ Score,T Score, Percential Rank and Box Plot Graph
Z Score,T Score, Percential Rank and Box Plot GraphThiyagu K
 
Measures of Dispersion and Variability: Range, QD, AD and SD
Measures of Dispersion and Variability: Range, QD, AD and SDMeasures of Dispersion and Variability: Range, QD, AD and SD
Measures of Dispersion and Variability: Range, QD, AD and SDThiyagu K
 
Explore beautiful and ugly buildings. Mathematics helps us create beautiful d...
Explore beautiful and ugly buildings. Mathematics helps us create beautiful d...Explore beautiful and ugly buildings. Mathematics helps us create beautiful d...
Explore beautiful and ugly buildings. Mathematics helps us create beautiful d...christianmathematics
 
1029-Danh muc Sach Giao Khoa khoi 6.pdf
1029-Danh muc Sach Giao Khoa khoi  6.pdf1029-Danh muc Sach Giao Khoa khoi  6.pdf
1029-Danh muc Sach Giao Khoa khoi 6.pdfQucHHunhnh
 

Recently uploaded (20)

Mattingly "AI & Prompt Design: Structured Data, Assistants, & RAG"
Mattingly "AI & Prompt Design: Structured Data, Assistants, & RAG"Mattingly "AI & Prompt Design: Structured Data, Assistants, & RAG"
Mattingly "AI & Prompt Design: Structured Data, Assistants, & RAG"
 
Russian Escort Service in Delhi 11k Hotel Foreigner Russian Call Girls in Delhi
Russian Escort Service in Delhi 11k Hotel Foreigner Russian Call Girls in DelhiRussian Escort Service in Delhi 11k Hotel Foreigner Russian Call Girls in Delhi
Russian Escort Service in Delhi 11k Hotel Foreigner Russian Call Girls in Delhi
 
SOCIAL AND HISTORICAL CONTEXT - LFTVD.pptx
SOCIAL AND HISTORICAL CONTEXT - LFTVD.pptxSOCIAL AND HISTORICAL CONTEXT - LFTVD.pptx
SOCIAL AND HISTORICAL CONTEXT - LFTVD.pptx
 
Seal of Good Local Governance (SGLG) 2024Final.pptx
Seal of Good Local Governance (SGLG) 2024Final.pptxSeal of Good Local Governance (SGLG) 2024Final.pptx
Seal of Good Local Governance (SGLG) 2024Final.pptx
 
Grant Readiness 101 TechSoup and Remy Consulting
Grant Readiness 101 TechSoup and Remy ConsultingGrant Readiness 101 TechSoup and Remy Consulting
Grant Readiness 101 TechSoup and Remy Consulting
 
Gardella_PRCampaignConclusion Pitch Letter
Gardella_PRCampaignConclusion Pitch LetterGardella_PRCampaignConclusion Pitch Letter
Gardella_PRCampaignConclusion Pitch Letter
 
Sports & Fitness Value Added Course FY..
Sports & Fitness Value Added Course FY..Sports & Fitness Value Added Course FY..
Sports & Fitness Value Added Course FY..
 
psychiatric nursing HISTORY COLLECTION .docx
psychiatric  nursing HISTORY  COLLECTION  .docxpsychiatric  nursing HISTORY  COLLECTION  .docx
psychiatric nursing HISTORY COLLECTION .docx
 
Presentation by Andreas Schleicher Tackling the School Absenteeism Crisis 30 ...
Presentation by Andreas Schleicher Tackling the School Absenteeism Crisis 30 ...Presentation by Andreas Schleicher Tackling the School Absenteeism Crisis 30 ...
Presentation by Andreas Schleicher Tackling the School Absenteeism Crisis 30 ...
 
Unit-IV- Pharma. Marketing Channels.pptx
Unit-IV- Pharma. Marketing Channels.pptxUnit-IV- Pharma. Marketing Channels.pptx
Unit-IV- Pharma. Marketing Channels.pptx
 
Web & Social Media Analytics Previous Year Question Paper.pdf
Web & Social Media Analytics Previous Year Question Paper.pdfWeb & Social Media Analytics Previous Year Question Paper.pdf
Web & Social Media Analytics Previous Year Question Paper.pdf
 
Mixin Classes in Odoo 17 How to Extend Models Using Mixin Classes
Mixin Classes in Odoo 17  How to Extend Models Using Mixin ClassesMixin Classes in Odoo 17  How to Extend Models Using Mixin Classes
Mixin Classes in Odoo 17 How to Extend Models Using Mixin Classes
 
Gardella_Mateo_IntellectualProperty.pdf.
Gardella_Mateo_IntellectualProperty.pdf.Gardella_Mateo_IntellectualProperty.pdf.
Gardella_Mateo_IntellectualProperty.pdf.
 
Nutritional Needs Presentation - HLTH 104
Nutritional Needs Presentation - HLTH 104Nutritional Needs Presentation - HLTH 104
Nutritional Needs Presentation - HLTH 104
 
Accessible design: Minimum effort, maximum impact
Accessible design: Minimum effort, maximum impactAccessible design: Minimum effort, maximum impact
Accessible design: Minimum effort, maximum impact
 
Mattingly "AI & Prompt Design: The Basics of Prompt Design"
Mattingly "AI & Prompt Design: The Basics of Prompt Design"Mattingly "AI & Prompt Design: The Basics of Prompt Design"
Mattingly "AI & Prompt Design: The Basics of Prompt Design"
 
Z Score,T Score, Percential Rank and Box Plot Graph
Z Score,T Score, Percential Rank and Box Plot GraphZ Score,T Score, Percential Rank and Box Plot Graph
Z Score,T Score, Percential Rank and Box Plot Graph
 
Measures of Dispersion and Variability: Range, QD, AD and SD
Measures of Dispersion and Variability: Range, QD, AD and SDMeasures of Dispersion and Variability: Range, QD, AD and SD
Measures of Dispersion and Variability: Range, QD, AD and SD
 
Explore beautiful and ugly buildings. Mathematics helps us create beautiful d...
Explore beautiful and ugly buildings. Mathematics helps us create beautiful d...Explore beautiful and ugly buildings. Mathematics helps us create beautiful d...
Explore beautiful and ugly buildings. Mathematics helps us create beautiful d...
 
1029-Danh muc Sach Giao Khoa khoi 6.pdf
1029-Danh muc Sach Giao Khoa khoi  6.pdf1029-Danh muc Sach Giao Khoa khoi  6.pdf
1029-Danh muc Sach Giao Khoa khoi 6.pdf
 

Measures of Variability and Correlation

  • 1. Republic of the Philippines MINDANAO STATE UNIVERSITY COLLEGE OF EDUCATION Fatima, General Santos City Module 5: Education Statistics Lesson 5: Measures of Variability and Correlation: Measures of Correlation Presented to: Dr. Ava Clare Marie O. Robles Class Schedule: MTh / 1:00-2:30 Presented by: Abbygale Jade P. Delos Reyes
  • 2. To compute the Pearson’s Product Moment Correlation accurately.
  • 3. Pearson’s Product- Moment Correlation • This measure of relation is used when factors to be correlated are both metric data. By metric data are meant measurements, which can be subjected to the four fundamental operations. Conception, Benjamin.et.al. (2016). LET Reviewer: MET Review Center, Manila.
  • 4. 1. Compute the sum of each set of scores (SX, SY). 2. Square each score and sum the square (SX2, SY2). 3. Count the number of paired observations (N). 4. Multiply each X score by its corresponding Y score. 5. Sum the score products X and Y (SXY). 6. Calculate the correlation. Conception, Benjamin.et.al. (2016). LET Reviewer: MET Review Center, Manila.
  • 5. r = 𝑁 ∑𝑋𝑌 − ∑𝑋 ∑𝑌 𝑁 ∑𝑋2−(∑𝑋)2 𝑁 ∑𝑌2− (∑𝑌)2 Where, N = number of paired observations SXY = sum of the cross products of X and Y SX = sum of the scores under Variable X SY = sum of the scores under Variable Y (SX)2 = sum of X scores squared (SY)2 = sum of Y scores squared SX2 = sum of squared X scores SY2 = sum of squared Y scores Conception, Benjamin.et.al. (2016). LET Reviewer: MET Review Center, Manila.
  • 6. Example: Scores of 10 students in 1st (X) and 2nd (Y) Test X Y 𝑿 𝟐 𝒀 𝟐 XY 86 87 7396 7569 7482 88 87 7744 7569 7656 90 92 8100 8464 8280 95 97 9025 9409 9215 93 92 8649 8464 8556 89 88 7921 7744 7832 94 95 8836 9025 8930 96 97 9216 9409 9312 81 82 6561 6724 6642 87 86 7569 7396 7482 ∑𝑋 = 899 ∑Y = 903 ∑𝑋2= 81017 ∑𝑌2= 81773 ∑XY= 81387
  • 7. r = 𝑁 ∑𝑋𝑌 − ∑𝑋 ∑𝑌 𝑁 ∑𝑋2−(∑𝑋)2 𝑁 ∑𝑌2− (∑𝑌)2 Given Formula: r = [10 81387 − 899 903 ] 10 81017 − 8992 [10 81773 − 9032 ] r = 2073 √(1969)(2321) This indicates a very high degree of relationship exists between the test scores in 1st and 2nd test.