1. Analysis of College Characteristics That Influence Tuition Rates
Presented by Aaron Dow, B.S. in Economics, University of New Hampshire
Advisor: Aziz Saglam
Research Question
• Can tuition be influenced and predicted by enrollment,
admissions characteristics and also by a school’s denotation as
private or public?
Literature Review
Student Response to Tuition Increase by Academic Majors
– Shin and Milton, JHE 2008
• Students elastic to initial tuition levels, not changes in tuition
• Should tuition be different depending on your major?
• Highest rate of return for Engineering degree
• Tuition changes did not affect enrollment
• Suggestion: Make tuition based on majors rate of return and cost towards
the college
Takeaways
• Insight on student behavior with enrollment and retention rates
• More success after school, less caring towards high tuition
Tuition Elasticity of the Demand for Higher Education among Current
Students – Bryan and Whipple, JHE 1995
• Study at Mount Vernon Nazarene College (MVNC) on tuition and retention
rates.
• TENEP Model (Tuition Earnings and Net Earnings Projections) to determine
effects of different tuition rates on enrollment.
• Found students would transfer to comparable school at high enough
tuition increase.
• MVNC would lose enrollment with tuition increase but maximize profit
with tuition increase.
Takeaways
• Insight into tuition pricing, and students reaction to price changes
• Higher enrollment leads to lower pricing.
The Politics of Public College Tuition and State Financial Aid – Doyle, JHE
2012
• Analyzes political influence on tuition and financial aid level.
• Public tuition is a mix of policy maker’s preferences and institutional
influences.
• High liberalism and low private institution influence = Low public tuition
Takeaways
• Explain regional differences in tuition. Northeast has high level of
liberalism and high number of private schools. Higher state school tuition?
Data
• US News & World Report
• Data from 260 Top Colleges and Universities around the US from 2013
Regression Results
• After running several regressions, most US regions proved
to be insignificant to all models
• Northeast region (57 schools) was only significant region
from the five
• Average freshman retention rate showed insignificanceMotivation
• 21 million people enrolled in colleges around US.
• Enrollment is on the increase
• Many students base their college choice off of affordability
• What are the general characteristics the influence tuition rates around the
US?
• What is the gap between private and public tuition rates?
All Data Mean
Standard
Deviation
In State Tuition $20,437.17 $15,225.36
Out-of-State Tuition $29,554.18 $10,251.15
State School 63% 48%
Enrollment 20118.38 12388.54
Acceptance Rate Fall 2013 59% 22%
Avg Freshman Retention Rate 84% 10%
6 Year Grad Rate 65% 18%
Methodology
• This analysis looks to create an accurate regression using the above
variables
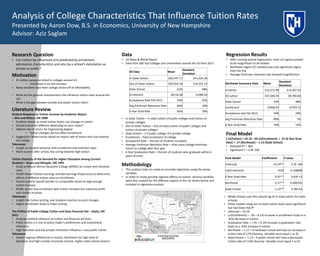
• In order to study possible regional affects on tuition, dummy variables
were also created for the different regions in the US shown below and
included in regression analysis
• In State Tuition – In state tuition of public colleges and tuition of
private colleges
• Out-of-State Tuition – Out-of-state tuition of public colleges and
tuition of private colleges
• State School – 1 if public college, 0 if private college
• Enrollment – Total enrollment of college
• Acceptance Rate – Percent of students accepted
• Average Freshman Retention Rate – How many college freshman
return to college after first year
• 6 Year Graduation Rate – Percent of students who graduate within 6
years of entry
Northeast Summary Stats Mean
Standard
Deviation
IS tuition $32,272.89 $15,407.43
OS tuition $37,046.93 $9,700.84
State School 35% 48%
Enrollment 15966.07 10759.72
Acceptance rate Fall 2013 50% 24%
Avg Freshman Retention Rate 89% 7%
6 Year Grad Rate 76% 14%
• Model chosen uses the natural log of in-state tuition for state
schools.
• Other models using out-of-state tuition levels were significant
but had lower Adj-R2
• Intercept = 10.19
• Ln(Enrollment) = -.05 = A 1% increase in enrollment leads to a
.05% decrease in tuition
• Graduation Rate = +.91 = A 1% increase in graduation rate
leads to a .91% increase in tuition
• Northeast = +.17 = A northeast school will have an increase in
tuition rate of 17% (Dummy Variable must equal 1 or 0)
• State School = -1.13 = A public school will have a decreased
tuition rate of 113% (Dummy Variable must equal 1 or 0)
Final Model
E ln(Tuition) = 10.19 –.05 ln(Enrollment) + .91 (6 Year Grad
Rate) + .17 (Northeast) – 1.13 (State School)
• Adjusted R2 = .862
• Significant F = 3.4E-109
Final Model Coefficients P-value
Intercept 10.19** 2.3E-109
Ln(Enrollment) -0.05 0.148898
6 Year Grad Rate 0.91** 9.63E-13
Northeast 0.17** 0.000195
State School -1.13** 2.39E-62