1. Labor Economics and Roster Allocations of the Boston Bruins
Presented by Aaron Dow, B.S. in Economics, University of New Hampshire
Economic Theory
Monopoly in the NHL
Bilateral Monopoly
Monopsony in the NHL
• Franchises are the only viable buyer of hockey talent.
• Teams use this market position to attempt to drive wages down beneath a competitive
level.
• Monopsony wage is found by tracing vertically to the Supply curve from the
intersection between Marginal Expense and Marginal Revenue Product (MRP).
• Players act as the only sellers of hockey talent. Form players unions.
• Players use this market position to drive salaries up and above a competitive level.
• Monopoly wage is found by tracing vertically to the Demand curve from the
intersection between Marginal Revenue and Marginal Cost (supply).
• Sports franchises operate differently than a normal business.
• A successful franchise looks to maximize wins, rather than maximize profits.
• A team that sacrifices profits spends more money for better players. This will create
more production from its roster and the team will produce more wins.
• Occurs when both a Monopsony and a Monopoly exist in a market.
• Undetermined salary range exists between the Union Wage and
and Monopsony Wage.
$0
$10
$20
$30
$40
$50
$60
$70
$80
0% 20% 40% 60% 80% 100%
SalaryCapPaid(Millions)
Percentage of Players
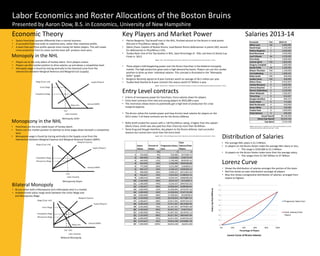
Lorenz Curve of Bruins Salaries
Progressive Salary Sum
Total Salaries/Total
Players
Distribution of Salaries
Key Players and Market Power
Salary
Values
Percent of
Roster
Progressive Salary
Sum
Total
Salaries/Total
Players
0% 0 0
1 550,000 4% 550,000 2673366.72
2 600,000 8% 1,150,000 5346733.44
3 640,000 12% 1,790,000 8020100.16
4 650,000 16% 2,440,000 10693466.88
5 775,000 20% 3,215,000 13366833.6
6 894,167 24% 4,109,167 16040200.32
7 900,000 28% 5,009,167 18713567.04
8 916,667 32% 5,925,834 21386933.76
9 1,008,333 36% 6,934,167 24060300.48
10 1,100,000 40% 8,034,167 26733667.2
11 1,300,000 44% 9,334,167 29407033.92
12 1,566,667 48% 10,900,834 32080400.64
13 1,600,000 52% 12,500,834 34753767.36
14 1,800,000 56% 14,300,834 37427134.08
15 3,000,000 60% 17,300,834 40100500.8
16 3,250,000 64% 20,550,834 42773867.52
17 3,366,667 68% 23,917,501 45447234.24
18 4,000,000 72% 27,917,501 48120600.96
19 4,250,000 76% 32,167,501 50793967.68
20 4,500,000 80% 36,667,501 53467334.4
21 5,000,000 84% 41,667,501 56140701.12
22 5,250,000 88% 46,917,501 58814067.84
23 6,000,000 92% 52,917,501 61487434.56
24 6,916,667 96% 59,834,168 64160801.28
25 7,000,000 100% 66,834,168 66,834,168
Entry Level contracts
Forwards Pos 2013-14
Milan Lucic LW 6,000,000
David Krejci C 5,250,000
Patrice Bergeron C 5,000,000
Brad Marchand C 4,500,000
Loui Eriksson LW 4,250,000
Chris Kelly C 3,000,000
Jarome Iginla RW 1,800,000
Gregory Campbell C 1,600,000
Daniel Paille LW 1,300,000
Shawn Thornton RW 1,100,000
Carl Soderberg C 1,008,333
Reilly Smith RW 900,000
Jordan Caron RW 640,000
Zdeno Chara D 6,916,667
Andrej Meszaros D 4,000,000
Johnny Boychuk D 3,366,667
Dennis Seidenberg D 3,250,000
Adam McQuaid D 1,566,667
Torey Krug D 916,667
Dougie Hamilton D 894,167
Corey Potter D 775,000
Matt Bartkowski D 650,000
Kevan Miller D 550,000
Tuukka Rask G 7,000,000
Chad Johnson G 600,000
Actual Payroll 68,190,000
Salary Cap Payroll 66,834,168
Cap Space -2,534,168
• Patrice Bergeron: Top faceoff man in the NHL, finished second on the Bruins in total points
(62) and in Plus/Minus rating (+38).
• Zdeno Chara: Captain of Boston Bruins, Lead Boston Bruins defenseman in points (40), second
for defensemen in Plus/Minus (+25).
• Tuukka Rask: One of the Top Goalies in NHL, Save Percentage of .930, Led team to Stanly Cup
Finals in 2013.
Source: "Stats." 2013-2014 Regular Season Stats. http://bruins.nhl.com/club/stats.htm (accessed April 7, 2014).
• These players hold bargaining power over the Bruins franchise in the bilateral monopoly
market. The high production gives each a high demand by teams. Players can use this market
position to drive up their individual salaries. This concept is illustrated in the “Monopoly
Seller” graph.
• Bergeron Recently signed an 8 year Contract worth an average of $6.5 million per year.
• Tuukka Rask Started an 8 year contract this season worth $7 Million a year.
Source: "Boston Bruins." HockeyBuzz.com. http://www.hockeybuzz.com/cap-central/team.php?team=BOS (accessed April 7, 2014).
• A form of monopsony power for franchises. Force salaries down for players.
• Entry level contracts limit new and young players to $925,000 a year.
• This restriction allows teams to potentially get a high level of production for a low
marginal expense.
• The Bruins utilize this market power and have 8 entry level salaries for players on the
2013 roster. 5 of these contracts are for the Bruins Defense.
• Reilly Smith ended the season with a +28 Plus/Minus rating, 3 higher than the captain
Zdeno Chara. Smith was also paid less than Chara by more than $6 Million.
• Torey Krug and Dougie Hamilton, key players to the Bruins defense, had successful
seasons but cannot earn more than the entry level.
Source: "Stats." 2013-2014 Regular Season Stats. http://bruins.nhl.com/club/stats.htm (accessed April 7, 2014).
Salaries 2013-14
• The average NHL salary is $1.3 Million.
• 11 players on the Bruins Roster make the average NHL salary or less,.
• This range is $550,000 to $1.3 Million
• 14 players on the Bruins Roster make more than the average salary.
• This ranges from $1.567 Million to $7 Million
Lorenz Curve
• Shows the distribution of salaries amongst the portion of the team.
• Red line shows an even distribution amongst all players.
• Blue line shows a progressive distribution of salaries, arranged from
lowest to highest.
Source: "Boston Bruins." HockeyBuzz.com. http://www.hockeybuzz.com/cap-
central/team.php?team=BOS (accessed April 7, 2014).