Employment trend
•
1 like•813 views

Philippine employment trend and its economic impact (a discussion on Labor and the Economy).

Recommended
Recommended
More Related Content
What's hot
What's hot (20)
Viewers also liked
Similar to Employment trend
Similar to Employment trend (20)
More from University of the Philippines- NCPAG
More from University of the Philippines- NCPAG (20)
Recently uploaded
Recently uploaded (20)
Employment trend
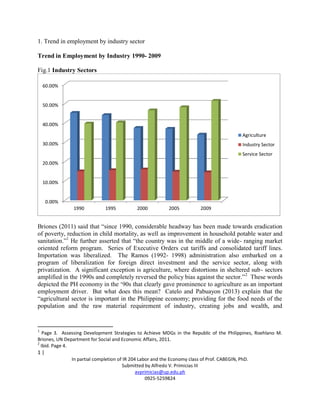
- 1. 1 | In partial completion of IR 204 Labor and the Economy class of Prof. CABEGIN, PhD. Submitted by Alfredo V. Primicias III avprimicias@up.edu.ph 0925-5259824 1. Trend in employment by industry sector Trend in Employment by Industry 1990- 2009 Fig.1 Industry Sectors Briones (2011) said that “since 1990, considerable headway has been made towards eradication of poverty, reduction in child mortality, as well as improvement in household potable water and sanitation.”1 He further asserted that “the country was in the middle of a wide- ranging market oriented reform program. Series of Executive Orders cut tariffs and consolidated tariff lines. Importation was liberalized. The Ramos (1992- 1998) administration also embarked on a program of liberalization for foreign direct investment and the service sector, along with privatization. A significant exception is agriculture, where distortions in sheltered sub- sectors amplified in the 1990s and completely reversed the policy bias against the sector.”2 These words depicted the PH economy in the ‘90s that clearly gave prominence to agriculture as an important employment driver. But what does this mean? Catelo and Pabuayon (2013) explain that the “agricultural sector is important in the Philippine economy; providing for the food needs of the population and the raw material requirement of industry, creating jobs and wealth, and 1 Page 3. Assessing Development Strategies to Achieve MDGs in the Republic of the Philippines, Roehlano M. Briones, UN Department for Social and Economic Affairs, 2011. 2 Ibid. Page 4. 0.00% 10.00% 20.00% 30.00% 40.00% 50.00% 60.00% 1990 1995 2000 2005 2009 Agriculture Industry Sector Service Sector
- 2. 2 | In partial completion of IR 204 Labor and the Economy class of Prof. CABEGIN, PhD. Submitted by Alfredo V. Primicias III avprimicias@up.edu.ph 0925-5259824 generating foreign exchange.”3 Yet they have described that agriculture as a sector showed “lackluster performance both in terms of growth and share to total output and employment, as well as its ability to secure food for the Filipinos and alleviate poverty in rural areas.”4 In fact the reason why the economy is having difficult in creating more and better jobs is because the “country’s long history of policy distortions slowed the growth of agriculture and manufacturing in the last six decades. Instead of rising agricultural productivity paving the way for the development of a vibrant labor- intensive manufacturing sector and subsequently of a high-skill services sector, the converse has taken place. Agricultural productivity has remained depressed, manufacturing has failed to grow sustainably and a low-productivity, low- skill services sector has emerged as the dominant sector of the economy. This anomalous growth pattern has failed to provide good jobs to majority of the Filipinos and has led to a substantial outmigration of many of the country’s best and brightest people.”5 Since the focus is on agriculture as a sector of dominance between 1990 and 1995, it is therefore fitting to determine whether workers like farmers are considered to belong to vulnerable employment? International Labor Organization (ILO) chief of employment Lawrence Johnson (2010) defines vulnerable employment as, “sum of own- account workers and contributing family workers. They are less likely to have formal work arrangements and are therefore more likely to lack decent working conditions, adequate social security and ‘voice’ through effective representation by trade unions. This is often characterized by inadequate earnings, low productivity and difficult conditions of work that undermine workers’ fundamental rights.”6 Cabegin, Dacuycuy and Alba in the DLSU Policy Brief- Stubborn Unemployment and Employment Vulnerability in the Midst of Economic Growth: The Philippine Case explain that “the workers in the agriculture sector were twice as likely to be disadvantaged (underemployed or fully employed in vulnerable employment) than that in the manufacturing or services sector7 . It is therefore pretty clear that workers in the agriculture sector would migrate to other opportunities (as OFWs or transfer to the service sector) causing the huge decline in employment rate. But what about the service sector? According to Park and Shin (2012) “since the early 1980s, the GDP share of services has been increasing rapidly. Overall, the patterns are consistent with the general perception of the Philippines as a country that failed to develop a strong manufacturing base.”8 They added that the service sector created a huge impact in Asian economy in the 1980s where contribution in “the Philippines at 81.7%, Singapore at 71.2%, 3 Page 1, Overview of PH Agriculture, 1990- 2009, Salvador Catelo and Isabelita Pabuayon, UPLB- College of Economics and Management, 2013. 4 Ibid. 5 Page 2, Philippine Development Report- Creating More and Better Jobs, World Bank PH Office, Sept. 2013. 6 http://www.ilo.org/global/about-the-ilo/newsroom/features/WCMS_120470/lang--de/index.htm 7 Page 3. Stubborn Unemployment and Employment Vulnerability in the Midst of Economic Growth: The Philippine Case, Cabegin, Dacuycuy and Alba; Policy Brief- DLSU. 8 Page 8, The Service Sector in Asia: Is it an Engine of Growth, Donghyun Park and Kwanho Shin, ADB, 2012.
- 3. 3 | In partial completion of IR 204 Labor and the Economy class of Prof. CABEGIN, PhD. Submitted by Alfredo V. Primicias III avprimicias@up.edu.ph 0925-5259824 Taipei at 67.9%, Korea at 55.3% and Thailand at 51%.”9 In the 1990s, the same impact continued where “Taipei at 77.8%, India at 61.1% and the Philippines at 58.3%.”10 Then in 2000s, service made contribution in “the Philippines at 62.8%, Indonesia at 56.4% and Pakistan at 55.3”11 They both concluded that as the economy grows, the service sector becomes larger and therefore overall growth depends more on the performance of the service sector. Mitra (2013) provided three key factors for this, “The Philippines is a prime example of a country that successfully developed a sizeable BPO export industry in 2000s. As of 2012, IT services and BPO combined generated $13B in export revenue and directly employed 777,000 people.”12 The second factor is “tourism (which has) traditionally been the largest sources of service revenues. Tourism did rather well in the 1970s and early 1980s. Then growth has been more substantial from the mid- 2000s and onwards as international tourists arrivals grew from 1.9 million on 2003 to 4.2 million in 2012.”13 Finally, the third factor our unsung heroes—the Overseas Filipino Workers. “Remittances recorded and routed through banks rose from about $2B in 1990 to $6B in 2000 and to $21B in 2001. As of 2012 they stood at $23B compared to $2B in FDI.”14 In conclusion therefore, the graph has significantly projected the image of how the Philippines has transitioned from an agricultural economy to a service economy. The GDP share of agriculture compared to service has declined over a period of more than two decades. There are reasons for the decline, as it is also present in other Asian countries, however, there are also multiple opportunities that the country can leverage to develop and sustain economic growth. On page 33 of In Pursuit of Inclusive Growth The Philippine Development Plan 2011- 2016 has captured the very sentiment of change that each patriotic Filipino lives to fight for, “This Plan is built on the conviction that such obstacles can be cleared and the above historic task accomplished in this lifetime through the prudent marshaling of available resources, the participation and support of all sectors, and through government and citizens living out and practicing the country’s best civic ideals. Nor should it be forgotten that today’s chances were purchased by past sacrifices: by overseas workers who endured separation from their families; by laborers and farmers who experienced wrenching structural changes; by the middle class and other taxpayers who shouldered the debt burdens of the past; by government personnel who soldiered on professionally despite the rot surrounding them; and by the brave and vigilant citizenry who never lost faith in constitutional values, democratic processes and the possibility of an honest government.” 9 Ibid. Page 19. 10 Ibid. Page 19. 11 Ibid. Page 19. 12 Page 5, Leveraging Service Sector Growth in the Philippines, Raja Mitra, ADB, 2013. 13 Ibid. Page 13. 14 Ibid. Page 17.
- 4. 4 | In partial completion of IR 204 Labor and the Economy class of Prof. CABEGIN, PhD. Submitted by Alfredo V. Primicias III avprimicias@up.edu.ph 0925-5259824 Trend in Employment by Industry 1990- 2009 Fig.2 Percent Distribution by Gender 2. Trend in employment by gender by industry sector Trend in Employment by Industry by Gender Fig.2A Male Trend in Employment by Industry by Gender Fig.2B Female 0.00% 20.00% 40.00% 60.00% 80.00% 1990 1995 2000 2005 2009 Male Female 0.00% 10.00% 20.00% 30.00% 40.00% 50.00% 60.00% 1990 1995 2000 2005 2009 Agriculture Industry Sector Service Sector 0.00% 20.00% 40.00% 60.00% 80.00% 1990 1995 2000 2005 2009 Agriculture Industry Sector Service Sector
- 5. 5 | In partial completion of IR 204 Labor and the Economy class of Prof. CABEGIN, PhD. Submitted by Alfredo V. Primicias III avprimicias@up.edu.ph 0925-5259824 Growth Rate by Industry Fig.3A Growth Rate by Industry on Both Sexes Fig.3B Growth Rate by Industry (Male) -3 -2 -1 0 1 2 3 4 5 6 1986-1990 1990-1995 1995-2000 2000-2005 2005-2009 Agriculture Industry Sector Service Sector -2 -1 0 1 2 3 4 5 6 7 8 1986-1990 1990-1995 1995-2000 2000-2005 2005-2009 Agriculture Industry Sector Service Sector
- 6. 6 | In partial completion of IR 204 Labor and the Economy class of Prof. CABEGIN, PhD. Submitted by Alfredo V. Primicias III avprimicias@up.edu.ph 0925-5259824 Fig.3C Growth Rate by Industry (Female) Table1 Percent Distribution by Industry for Both Sexes Years Industry 1986 1990 1995 2000 2005 2009 Agriculture 49.94% 45.23% 44.10% 37.45% 37.03% 34.03% Industry sector 13.33% 15.04% 15.61% 16.01% 14.85% 14.53% Service Sector 36.71% 39.73% 40.29% 46.54% 48.12% 51.44% Fig.4 Growth Rate By industry in Both Sexes -4 -3 -2 -1 0 1 2 3 4 5 1986-1990 1990-1995 1995-2000 2000-2005 2005-2009 Agriculture Industry Sector Service Sector -3 -2 -1 0 1 2 3 4 5 6 1986-1990 1990-1995 1995-2000 2000-2005 2005-2009 Agriculture Industry Sector Service Sector
- 7. 7 | In partial completion of IR 204 Labor and the Economy class of Prof. CABEGIN, PhD. Submitted by Alfredo V. Primicias III avprimicias@up.edu.ph 0925-5259824 Fig.4.1 Growth Rate By industry (Service Sector) Fig.4.2 Growth Rate By industry (Industry Sector) These several graphs can best be explained by this statement, “In the past two decades, the services sector remained to be the major engine of economic growth, particularly in the modern marketing and financial services sector. This is in contrast to the paltry performance of the manufacturing and agriculture sectors. The services sector is a dominant source of employment and has increasingly absorbed labor for the period 1991- 1997. This pattern was reversed between 200 and 2006, particularly in the community and personal services which account for the primary share of services employment. By contrast, the agriculture sector, which took up a -5 0 5 10 15 20 25 Wholesale and retail trade Transportation, storage and communication Financing, insurance, real state, and business services Community, social and personal services -8 -6 -4 -2 0 2 4 6 8 10 12 14 Mining and quarrying Manufacturing Electricity, gas and water Construction
- 8. 8 | In partial completion of IR 204 Labor and the Economy class of Prof. CABEGIN, PhD. Submitted by Alfredo V. Primicias III avprimicias@up.edu.ph 0925-5259824 declining share of the employed labor force between 1991 and 1996, has filled in the slack in the services sector for the period 2000- 2006.”15 Adding another picture to these graphs would be explained by examining the projections for the employment rate by type of worker using education as a primary category classification. This means the ability of one person (regardless whether male or female) to have a job (whether as self-employed or working for another) is measured by one’s educational attainment, this as attested by Briones, et al (2011). “Unemployment holds steady for primary school attainers at 5% but rises dramatically for both secondary school attainers and tertiary school completers, lifting up unemployment for all workers from 7.7% in 2006 to 9% in 2015. In turn, the influx of better educated workers is driven by the combination of rapid population growth and in rising population of secondary and tertiary graduates. Overseas migration may be a significant outlet for educated workers.”16 This is an important measure to underscore primarily on the relevance of the government’s policy and implementation programs to address literacy and productivity by advancing education in the community as a way to pursue development of the country’s human capital. “The major priority reforms in education have been spelled out in the Basic Education Sector Reform Agenda (BESRA). Implementation of the agenda involves: school- based management; enhanced learning efficiency such as through the K+12 system; quality assurance and accountability; and complementary learning interventions.”17 Another aspect, which is not entirely new, to stress but is deeply connected to gender in reference to employment, is the outmigration of our talented Filipino workers. OFWs leave because of the high “demand from other countries that can offer employment and comparatively high pay combined with high population growth and with a lack of attractive opportunities in the Philippines due to modest growth of both the industry and service sectors.”18 The Philippine government totally supports this by institutionalizing outmigration as protected by the Labor Code in 1974 and formation of agencies like POEA and OWWA to facilitate bilateral agreements with other host countries. As a positive economic consequence that made the Philippines as the world’s third largest recorded remittance recipient. However, it must be underscored that these remittances are used more on consumption rather than direct investment which can yield more prospects of job- generation. 15 Page 3. Stubborn Unemployment and Employment Vulnerability in the Midst of Economic Growth: The Philippine Case, Cabegin, Dacuycuy and Alba; Policy Brief- DLSU. 16 Pages 30 and 31, Assessing Development Strategies to Achieve MDGs in the Republic of the Philippines, Roehlano M. Briones, UN Department for Social and Economic Affairs, 2011. 17 Page 28, In Pursuit of Inclusive Growth- Philippine Development Plan 2011- 2016. 18 Page 16, Leveraging Service Sector Growth in the Philippines, Raja Mitra, ADB, 2013.
- 9. 9 | In partial completion of IR 204 Labor and the Economy class of Prof. CABEGIN, PhD. Submitted by Alfredo V. Primicias III avprimicias@up.edu.ph 0925-5259824 Basing on graph Fig. 2, males are ahead to females in the acquiring jobs. However, the disparity has become narrow as more women have become employable. In fact in my own personal experience during the time (2000s) when this writer was working for a semiconductor company in a PEZA- accredited techno-park, the demographic distribution between male and female assembly line operators would 1: 25, while male and female engineers would be 25: 1. The graph showed results where males were employed at 63.67% in 1990s but went down at 62.14% in 2000s and at 61.16% in 2009. On the otherhand, there is an inverse effect for females where they were employed at 36.33 in 1990s, 37.86 in 2000s and 38.84 in 2009. Farmers, miners, fishermen and other skilled or unskilled workers in the agriculture sector are predominantly men who are either migrating overseas or have decided that the service sector is a better income alternative since their population is decreasing: 53.15% (1990), 51.73% (1995), 45.34% (2000), 44.46% (2005) and 41.63% (2009). While in the service sector population is increasing: 30.53% (1990), 31.25% (1995), 36.96% (2000), 38.47% (2005) and 41.05% (2009). The graph clearly showed that in 1986 (post Marcos regime) agriculture has the highest number of employment among industries with a value of 49.94%. However since then agriculture faced a consistent decline in employment despite of Pres. Corazon Aquino’s determination to enact the Comprehensive Agrarian Reform (where in contrast it was in Pres. Noynoy Aquino’s presidency where the distribution of Hacienda Luisita occurred). Moreover, the loss in agriculture sector is gain in the services sector- being the main employment driver of the economy: 36.71% in 1986, 39.73% in 1990, 40.54% in 2005 and 51.44% in 2009. To mirror this is an illustration coming from the NSCB (2012) and BSP (2013) that showed GDP contribution of three sectors between 2004 and 2009: 2004 2005 2006 2007 2008 2009 Agriculture 13.3 12.7 12.4 12.5 13.2 13.1 Industry (manufacturing) 24.0 24.1 23.6 22.7 22.8 21.3 Services (transp.) 7.7 7.8 7.6 7.5 7.1 7.0 Services (trade) 16.0 16.4 16.8 17.1 17.1 16.9 Services (financial) 5.5 5.9 6.3 6.5 6.5 6.8 Services (real estate) 9.6 9.9 10.1 10.6 11.02 10.9
- 10. 10 | In partial completion of IR 204 Labor and the Economy class of Prof. CABEGIN, PhD. Submitted by Alfredo V. Primicias III avprimicias@up.edu.ph 0925-5259824 CONCLUSION This writer started this paper by quoting Briones, and in the same tradition would end his own discussion on Social Policy: “The restoration of democracy in 1986 led to the ratification of the 1987 Constitution, which is loaded with provisions pertaining to social justice and economic development. According to Section 9, “The State shall pursue a just and dynamic social order that will ensure prosperity and independence of the nation and free the people from poverty through policies that provide adequate social services, promote full employment, a rising standard of living, and an improved quality of life for all.””19 As a Filipino, this writer is fully aware of the progression of the Philippine politics over the years. Having witnessed to the so-called peaceful revolution to the several coup de tats and unseating of an actor who became president. Unfortunately these political upheavals also demonstrated the performance of the country’s economy vis-à-vis external forces like the Asian crises and the recessions in the US and Europe. And the graphs clearly represented the resilience of the Filipino spirit to survive, to overcome and to win the challenges of times. Yet, this writer believes that the graph should not end as a representation of the past- be it in the context of politics or economics, but be an instrument to awaken concerned citizens to mobilize the inert capabilities of the Filipino people. Regrettably, the bloodless revolution that vanquished a dictator has lost its redeeming essence of pivotal change. True that the democratic institutions we all clamored for were formed yet the achievements were strained by incompetence and corruption of the few-- sadly by our own elected leaders. This paper does not venture into proposing solutions, but is tasked to interpret the graphs. Yet, somehow, the task of Prof. Cabgin awakened a challenge for this writer to be more for a country that has been his since the beginning. 19 Page 3. Assessing Development Strategies to Achieve MDGs in the Republic of the Philippines, Roehlano M. Briones, UN Department for Social and Economic Affairs, 2011.
- 11. 11 | In partial completion of IR 204 Labor and the Economy class of Prof. CABEGIN, PhD. Submitted by Alfredo V. Primicias III avprimicias@up.edu.ph 0925-5259824 References: 1) Emily Cristi Cabegin, Lawrence Dacuycuy and Michael Alba. Stubborn Unemployment and Employment Vulenrability in the Midst of Economic Growth: The Philippine Case, DLSU. 2) Roehlano Briones. Assessing Development Strategies to Achieve MDGs, UN Department for Social and Economic Affairs, 2011. 3) Raja Mikael Mitra. Leveraging Service Sector Growth in the Philippines, ADB, 2013. 4) Donghyun Park and Kwanho Shin. The Service Sector in Asia: Is it an Engine of Growth, ADB, 2012. 5) Home Guaranty Corporation. Macro Economic Report 2009 First Quarter. 6) In Pursuit of Inclusive Growth- Philippine Development Plan 2011 to 2016 7) http://www.dole.gov.ph/fndr/bong/files/PLEP-26%20April%20version.pdf 8) http://www.census.gov.ph/content/2010-annual-survey-philippine-business-and-industry- aspbi-other-service-activities 9) http://siteresources.worldbank.org/INTPHILIPPINES/Resources/Habito-word.pdf 10) http://www.ilo.org/global/about-the-ilo/newsroom/features/WCMS_120470/lang-- de/index.htm