Take 10 - Ian Keith
•Download as PPTX, PDF•
0 likes•121 views

6EA Learning Workshop October 2019

Recommended
Recommended
More Related Content
What's hot
What's hot (20)
Similar to Take 10 - Ian Keith
Similar to Take 10 - Ian Keith (20)
More from 6EAScot
More from 6EAScot (20)
Recently uploaded
Recently uploaded (20)
Take 10 - Ian Keith
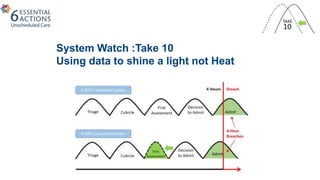
- 1. System Watch :Take 10 Using data to shine a light not Heat
- 3. You need data for improvement
- 4. 4
- 5. Probing why
- 6. Why take ten matters
- 7. Supply and Demand in the Emergency Department Dr Chris Moultrie Clinical Research Fellow, ScotSTAR MD by Research Student, University of Glasgow ST5 Emergency Medicine, QEUH
- 8. How long do doctors spend on one patient? ProbabilityDensity
- 9. Why take 10 matters Waiting Time Add together random samples (x 10,000) Map Total Time as cumulative percentiles How long to see a patient
- 10. Why take 10 matters Total ED Work
- 11. Reducing time for first assessment left shifts curve 10 mins 2-3% Improvement in compliance with 4hr target Why take 10 matters Total ED Work
- 16. Heat maps of attendances
- 24. Use your own data sets to help guide you too 0.0% 20.0% 40.0% 60.0% 80.0% 100.0% 0 200 400 600 800 1000 1200 1400 CumulativePercentage NumberofBreachers RAH Emergency Department Apr 19 - Aug 19
- 25. So what !
- 26. Changes made • Staffing profiles targeted and changed to help with the pinch areas • Opening up the MAU for extended hours when under most pressure • Plans to measure the effects automatically
- 27. What the teams say • “ helps understanding the data and making it look better so we can use it to improve things” • “helps plan quick wins and look at the system in a different way” • “means I don’t have to do it anymore”
- 28. Benefits • Only spend precious time on “big wins” so can test and change using improvement science • easy for all to see and allow the analysists focus on other work • Further developments of journey point times to come for deeper dive
Editor's Notes
- In the example below you will see that time to first assessment has been targeted and this enables us to improve total performance as the reduced time to first assessment pulls everything that goes after time to first assessment over to the left, ultimately reducing the number of patients that breach.
- Here’s a summary of what we need to do and whose responsibility that might be. You’ll see that most opportunities are about process change on stable states and that requires management action (that involves the workers) but doesn’t just rely on them to fix special causes.
- Focus on the time in the department too
- Flow 3 average times