SlideShare a Scribd company logo
1 of 10
Download to read offline
NATURE HUMAN BEHAVIOUR 1, 0005 (2016) | DOI: 10.1038/s41562-016-0005 | www.nature.com/nathumbehav	 1
ARTICLES
PUBLISHED: 12 DECEMBER 2016 | VOLUME: 1 | ARTICLE NUMBER: 0005
Childhood forecasting of a small segment of the
population with large economic burden
Avshalom Caspi1,
​2,
​3,
​4
*, Renate M. Houts1
, Daniel W. Belsky5,
​6
, Honalee Harrington1
, Sean Hogan7
,
Sandhya Ramrakha7
, Richie Poulton7
and Terrie E. Moffitt1,
​2,
​3,
​4
Policymakersareinterestedinearly-yearsinterventionstoamelioratechildhoodrisks.Theyhopeforimprovedadultoutcomesin
the long run that bring a return on investment. The size of the return that can be expected partly depends on how strongly child-
hood risks forecast adult outcomes, but there is disagreement about whether childhood determines adulthood. We integrated
multiple nationwide administrative databases and electronic medical records with the four-decade-long Dunedin birth cohort
study to test child-to-adult prediction in a different way, using a population-segmentation approach. A segment comprising
22% of the cohort accounted for 36% of the cohort’s injury insurance claims; 40% of excess obese kilograms; 54% of cigarettes
smoked; 57% of hospital nights; 66% of welfare benefits; 77% of fatherless child-rearing; 78% of prescription fills; and 81% of
criminal convictions. Childhood risks, including poor brain health at three years of age, predicted this segment with large effect
sizes. Early-years interventions that are effective for this population segment could yield very large returns on investment.
A
round the world, the population is ageing and total fertil-
ity rates are declining. As a result, nations increasingly
view children and young people as valuable resources for
the economic and social well-being of whole societies. This view
is accompanied by public-policy interest in early interventions
to help as many children as possible achieve their full potential.
Akeyquestionconcernsthepotentialsizeoftheimpactthatmightbe
brought about by interventions in the early years of children’s lives1,2
.
Research teams that have followed up on small samples of children
who were enrolled in intervention experiments carried out decades
ago point to reductions in school leaving, unemployment, crime,
obesity and even blood pressure3–6
. Some argue that today’s better-
designed interventions might achieve greater reductions in adult
problems than previous efforts7
(see also www.nuffieldfoundation.
org, www.blueprintsprograms.com, http://ies.ed.gov/ncee/wwc and
http://incredibleyears.com). Others assert that interventions for the
youngest children will bring an even greater return on investment
compared with interventions that begin when children are older8
.
However, a skeptic could point out that return on investment for
society will depend not only on an intervention’s capacity to ame-
liorate childhood risks, but also on how relevant those risks are for
downstream adult functioning in the general population. Thus, to a
large extent, the question of how much early-years intervention can
lift health and social well-being and reduce costs depends on how
strongly early-years risk factors are tied to adult outcomes in the
population. Our own research and that of others suggests that while
childhood risk factors do predict adult outcomes with statistical
significance, the effect sizes are typically modest9–11
. The interpreta-
tion of these modest child-to-adult effect sizes is polarizing, and has
sown confusion among scientists, policy makers and the public12–14
.
On the one hand, claims are made that the ‘child is father of the
man’, because continuity from childhood risks to adult outcomes
is stronger than expected, given the long duration of follow-up.
On the other hand, on the basis of the same data, warnings are
issued about the myth of early-childhood determinism and about
unwarranted overemphasis on childhood.
Here, we tackled the prediction question anew in the context
of the Dunedin Longitudinal Study, a population-representative
1972–1973 birth cohort of 1,037 New Zealanders assessed at ages 3,
5, 7, 9, 11, 13, 15, 18, 21, 26, 32 and 38 years and followed from birth
to midlife with 95% retention (Supplementary Information). We
first integrated our longitudinal survey data and clinical data with
multiple nationwide government administrative databases and elec-
tronic medical records. Then, using a novel segmentation approach,
we tested the hypothesis that a small segment of the adult popula-
tion accounts for a large cumulative economic burden and that this
segment can be predicted with good accuracy from early childhood.
Results
Throughout the cohort’s childhood, during the first decade of life,
we measured risk factors that are thought to augur poor adult out-
comes: growing up in a socioeconomically deprived family, expo-
sure to maltreatment, low IQ and poor self-control. We report these
four risk factors here because they are proven predictors of adult
health and social outcomes and are high-priority targets in many
early-years intervention programmes15–17
. A strength of this analysis
is that all childhood risk predictors were measured prospectively,
unbiased by participants’ knowledge of their adult outcomes.
At the most recent follow-up assessment when the cohort reached
38 years of age, roughly the midpoint in the human lifespan, we drew
on personal interviews and on New Zealand’s multiple nationwide
administrative databases and electronic medical records to ascertain
the cumulative distributions of economically burdensome outcomes
in eight social and health sectors. These outcomes are referred to
here as economically burdensome because, in each instance, these
are events, behaviours and conditions that saddle society and
1
Department of Psychology & Neuroscience, Duke University, Durham, North Carolina 27708, USA. 2
Department of Psychiatry & Behavioural Sciences,
Duke University School of Medicine, Durham, North Carolina 27708, USA. 3
Center for Genomic and Computational Biology, Duke University, Durham,
North Carolina 27708, USA. 4
Social, Genetic, & Developmental Psychiatry Research Centre, Institute of Psychiatry, Psychology, & Neuroscience, King’s
College London, London SE5 8AF, UK. 5
Department of Medicine, Duke University School of Medicine, Durham, North Carolina 27708, USA. 6
Social Science
Research Institute, Duke University, Durham, North Carolina 27708, USA. 7
Department of Psychology, University of Otago, Dunedin 9016, New Zealand.
*e-mail: ac115@duke.edu
2	 NATURE HUMAN BEHAVIOUR 1, 0005 (2016) | DOI: 10.1038/s41562-016-0005 | www.nature.com/nathumbehav
ARTICLES NATURE HUMAN BEHAVIOUR
d
% of total excess
obese kilograms
(n = 2,924 kg)
20% of cohort members = 98% of total excess obese kilograms
Percentage
100
90
80
70
60
50
40
30
20
10
0
% of cohort members
c
% of total smoking
pack years
(n = 5,760 pack-years)
20% of cohort members = 68% of total tobacco smoking pack-years
Percentage
100
90
80
70
60
50
40
30
20
10
0
% of cohort members
b
% of cohort members
20% of cohort members = 82% of total fatherless child-years
Percentage
Max. 0
100
90
80
70
60
50
40
30
20
10
0
% of total fatherless
child-years
(n = 2,755 child-years)
a
% of cohort members
100
90
80
70
60
50
40
30
20
10
0
1
2
3
Percentage
20% of cohort members = 80% of total social welfare benefit months
Max. 0
Max. 0 Max. 0
Max. 0Max. 0
Max. 0 Max. 0
% of total social welfare
benefit months
(n = 24,997 months)
f
% of total prescription drug fills
(n = 66,811 fills)
20% of cohort members = 89% of total prescription drug fills
% of cohort members
Percentage
100
90
80
70
60
50
40
30
20
10
0
e
% of cohort members
20% of cohort members = 77% of total hospital-bed nights
Percentage
100
90
80
70
60
50
40
30
20
10
0
% of total hospital-bed nights
(n = 8,958 nights)
h
% of cohort members
% of total criminal court convictions
(n = 2,141 covictions)
20% of cohort members = 97% of total criminal court convictions
Percentage
100
90
80
70
60
50
40
30
20
10
0
g
% of total injury insurance claims
(n = 6,919 claims)
% of cohort members
20% of cohort members = 52% of total injury insurance claims
Percentage
100
90
80
70
60
50
40
30
20
10
0
Figure 1 | Measuring the concentration of economic-burden outcomes in a birth cohort. The data represent information about 940 people who were born
in one hospital in the period 1972–1973 and are lifelong participants in the Dunedin Longitudinal Study. a–h, A minority of individuals is shown to account for
a majority of outcomes in a birth cohort for each of eight different social and health sectors: social welfare (a), fatherless children (b), smoking (c), excess
obese kilograms (d), hospital stays (e), prescription fills (f), injury claims (g) and crime (h). Each panel displays the cumulative distribution of an outcome
in the cohort. To find the proportion of each outcome that 20% of the population accounts for, start at 20% on the vertical axis and follow dashed arrow 1 to
the right (to the purple line), then follow arrow 2 up to the blue line, then follow arrow 3 to the left (back to the vertical axis) to read off the corresponding
proportion of the total. Each x-axis denotes the count of each respective outcome in its own units (e.g. benefit months, pack-years and so on).
NATURE HUMAN BEHAVIOUR 1, 0005 (2016) | DOI: 10.1038/s41562-016-0005 | www.nature.com/nathumbehav	 3
ARTICLESNATURE HUMAN BEHAVIOUR
government with both direct and indirect costs. These are also the
same outcomes that early-years interventions hope to reduce18
.
We predicted social welfare dependency, fatherless child-rearing
(defined by the absence of the biological father from the households
in which a cohort member’s offspring live), tobacco smoking, excess
body weight, admissions to taxpayer-funded national-health-service
hospitals, taxpayer-funded prescription drug fills, taxpayer-funded
insurance claims paid out for accidents and injuries, and convictions
for crime (Fig. 1). Analyses tested how strongly childhood risks pre-
dicted these economically burdensome outcomes in this cohort.
Prospective longitudinal cohort studies have tackled the predic-
tion question before19
. Here, we draw attention to two infrequently
tried approaches to prediction. Our first fresh approach was to pre-
dict the concentration of each economically burdensome behaviour
by focusing on its cumulative distribution across the cohort. Typically,
prediction has focused on dimensional outcomes, such as the num-
ber of crime convictions accrued by a person, or nominal outcomes,
such as whether the person is a convicted offender or not. Instead, we
noted that most economically burdensome outcomes have a markedly
skewed distribution, and accordingly defined our prediction target as
the small group of cohort members who could be considered high-
cost because they accounted for an excessive amount of an outcome
(for example, a few individuals account for the majority of criminal
convictions and are thus high-cost users of the criminal justice sec-
tor). To define this concentration, we followed the lead of Vilfredo
Pareto who, over 100 years ago, observed that 80% of ‘effects’ emanate
from 20% of ‘sources’20
. In Pareto’s day, the problem definition was
that 20% of families owned 80% of land in Italy. The so-called Pareto
Table 1 | Childhood predictors of economic-burden outcomes in a birth cohort.
High cost in each sector Univariate models Multivariate models
RR RR 95% CI AUC AUC 95% CI RR RR 95% CI AUC AUC 95% CI
Social welfare* 0.78 (0.74, 0.82)
 Childhood low SES 1.47 (1.28, 1.69) 0.73 (0.69, 0.77) 1.18 (1.02, 1.36)
 Child maltreatment 1.47 (1.33, 1.62) 0.74 (0.70, 0.78) 1.31 (1.18, 1.46)
 Childhood low IQ 1.50 (1.37, 1.65) 0.73 (0.69, 0.77) 1.19 (1.05, 1.34)
 Childhood low self-control 1.51 (1.37, 1.65) 0.75 (0.71, 0.79) 1.24 (1.10, 1.39)
Fatherless children 0.67 (0.62, 0.72)
 Childhood low SES 1.39 (1.17, 1.65) 0.63 (0.58, 0.68) 1.24 (1.03, 1.49)
 Child maltreatment 1.36 (1.19, 1.56) 0.63 (0.58, 0.68) 1.26 (1.09, 1.46)
 Childhood low IQ 1.26 (1.09, 1.47) 0.62 (0.56, 0.67) 1.04 (0.86, 1.26)
 Childhood low self-control 1.33 (1.18, 1.50) 0.64 (0.59, 0.69) 1.15 (0.99, 1.34)
Smoking 0.69 (0.65, 0.74)
 Childhood low SES 1.50 (1.30, 1.73) 0.64 (0.60, 0.69) 1.29 (1.11, 1.50)
 Child maltreatment 1.34 (1.21, 1.49) 0.61 (0.56, 0.66) 1.20 (1.06, 1.35)
 Childhood low IQ 1.36 (1.21, 1.53) 0.64 (0.59, 0.68) 1.08 (0.93, 1.25)
 Childhood low self-control 1.43 (1.30, 1.57) 0.65 (0.60, 0.70) 1.21 (1.07, 1.37)
Excess weight 0.61 (0.56, 0.65)
 Childhood low SES 1.26 (1.11, 1.43) 0.59 (0.55, 0.64) 1.16 (1.00, 1.35)
 Child maltreatment 1.13 (1.01, 1.28) 0.56 (0.52, 0.61) 1.09 (0.96, 1.24)
 Childhood low IQ 1.24 (1.10, 1.40) 0.58 (0.53, 0.63) 1.14 (0.97, 1.34)
 Childhood low self-control 1.18 (1.06, 1.32) 0.57 (0.52, 0.62) 1.04 (0.89, 1.20)
Hospital stays* 0.75 (0.71, 0.79)
 Childhood low SES 1.35 (1.18, 1.54) 0.74 (0.70, 0.78) 1.23 (1.07, 1.43)
 Child maltreatment 1.14 (1.02, 1.29) 0.72 (0.68, 0.76) 1.06 (0.93, 1.20)
 Childhood low IQ 1.26 (1.12, 1.43) 0.73 (0.69, 0.77) 1.09 (0.95, 1.26)
 Childhood low self-control 1.27 (1.14, 1.42) 0.74 (0.70, 0.77) 1.15 (1.01, 1.32)
Prescription fills* 0.75 (0.71, 0.78)
 Childhood low SES 1.27 (1.11, 1.44) 0.73 (0.70, 0.77) 1.18 (1.03, 1.37)
 Child maltreatment 1.10 (0.98, 1.25) 0.71 (0.67, 0.74) 1.02 (0.89, 1.17)
 Childhood low IQ 1.30 (1.16, 1.45) 0.73 (0.70, 0.77) 1.14 (0.99, 1.32)
 Childhood low self-control 1.25 (1.12, 1.39) 0.73 (0.70, 0.77) 1.11 (0.98, 1.27)
Injury claims* 0.74 (0.71, 0.78)
 Childhood low SES 1.18 (1.03, 1.34) 0.74 (0.70, 0.78) 1.19 (1.02, 1.38)
 Child maltreatment 1.03 (0.92, 1.16) 0.73 (0.69, 0.77) 0.98 (0.86, 1.12)
 Childhood low IQ 1.07 (0.95, 1.20) 0.73 (0.69, 0.77) 0.95 (0.82, 1.10)
 Childhood low self-control 1.12 (1.01, 1.24) 0.74 (0.70, 0.78) 1.09 (0.95, 1.24)
Crime* 0.77 (0.74, 0.80)
 Childhood low SES 1.36 (1.22, 1.52) 0.74 (0.70, 0.77) 1.24 (1.11, 1.39)
 Child maltreatment 1.31 (1.20, 1.43) 0.73 (0.70, 0.77) 1.18 (1.07, 1.30)
 Childhood low IQ 1.19 (1.08, 1.31) 0.72 (0.68, 0.76) 0.93 (0.83, 1.04)
 Childhood low self-control 1.35 (1.25, 1.46) 0.75 (0.71, 0.79) 1.26 (1.15, 1.38)
The Table shows that children who grew up in socioeconomically deprived environments, who experienced child maltreatment, who scored more poorly on childhood IQ tests, and who exhibited
less self-control were more likely to belong to a high-cost economic burden group as adults, in each of eight different sectors. Childhood socioeconomic status (SES), IQ and self-control are standardized
z-scores (mean (M) =​ 0, s.d. =​ 1); childhood maltreatment is coded as 0 =​ none, 1 =​ probable, 2 =​ definite maltreatment. All models control for sex. The prediction was the same when men and women
were analysed separately (see Supplementary Information for details). *Time spent outside New Zealand is added as a covariate in analyses that use New Zealand administrative data. AUC,​ area under
the curve; CI,​ confidence interval; RR,​ risk ratio. RRs in bold are statistically significant at P < 0.05.
4	 NATURE HUMAN BEHAVIOUR 1, 0005 (2016) | DOI: 10.1038/s41562-016-0005 | www.nature.com/nathumbehav
ARTICLES NATURE HUMAN BEHAVIOUR
principle is alive and useful today: for example, in software engineer-
ing, 20% of the code is said to contain 80% of the errors21
. Here, we
measured each outcome variable in units that could be meaning-
fully counted (for example, tobacco pack-years, hospital-bed nights,
prescription fills, criminal convictions and so on). Such measures
allowed us to identify the minority of individuals who accounted for
the majority of each economically burdensome outcome.
Our second fresh approach was to predict the aggregation of dif-
ferent types of economically burdensome behavioural outcomes.
Economic analyses of early-years interventions illustrate the advan-
tages of estimating the costs associated with multiple outcomes22
.
However, typical approaches to prediction in population studies
continue to predict only one outcome at a time. We noted that some
cohort members appeared to be engaged in economically burden-
some behaviour across multiple health and social sectors. This
observation suggests that a relatively small population segment
may generate a large share of societal costs. If this is true, this group
would be a high-value target for prevention. We hypothesized that
predicting such aggregated concentrations would yield stronger
estimates of prediction from childhood to adulthood than reported
in previous research. We analysed aggregation as the second step,
after analysing concentration.
Adult outcomes were concentrated as anticipated from the
Pareto principle (that is, the 80–20 rule). Cumulative distribution
functions showed that in each of the eight social and health sec-
tors where we collected data, 20% of the individuals consistently
accounted for a disproportionate share (close to 80%) of the out-
come (Fig. 1). These distributions led us to operationally define a
high-cost group in each sector as the 20% of the cohort members
who accounted for a disproportionate share in that sector.
We observed that members of the high-cost group in every sector
could be differentiated from their peers by the same four childhood
disadvantages: they tended to have grown up in more socioeco-
nomically deprived environments; to have experienced child mal-
treatment; to have scored poorly on childhood IQ tests; and to have
exhibited low childhood self-control (Table  1). The predictions
were fairly uniform across each of the eight different social and
health sectors with the exception of injury claims. In addition to
being less concentrated within a high-cost group, injury claims were
less strongly associated with childhood risk factors.
Figure 1 and Table 1 both focus on one sector at a time. However,
a heat map (Fig. 2a) showed that high-cost group members in one
sector were often significantly more likely to reappear as high-cost
in other sectors too, and that the observed distribution of high-cost
a
Social welfare Fatherless children Smoking Excess weight Hospital stays Prescription fills Injury claims
Fatherless children 0.6
Smoking 0.5 0.6
Excess weight 0.1 0.0 0.0
Hospital stays 0.4 0.2 0.2 0.2
Prescription fills 0.5 0.3 0.3 0.2 0.5
Injury claims 0.1 0.3 0.2 0.1 0.1 0.2
Crime 0.5 0.5 0.5 –0.1 0.1 0.2 0.4
0% 10% 20% 30% 40% 50% 60% 70% 80% 90% 100%
Expected distribution
b
Observed distribution
None
n = 155
1 high-cost group
n = 314
2 high-cost groups
n = 278
None
n = 284
1 high-cost group
n = 252
2 high-cost
groups
n = 197
4 high-cost groups
n = 44
5 high-cost groups
n = 44
3 high-cost groups
n = 72
3 high-cost groups
n = 139
4 high-cost groups
n = 63
5 high-cost groups, n = 9
6 high-cost groups, n = 1
7,8 high-cost groups, n = 0
7 high-cost groups, n = 9
8 high-cost groups, n = 1
6 high-cost groups, n = 18
Polychoric
correlation
–0.25
0.00
0.25
0.50
0.75
1.00
Figure 2 | The aggregation of adult economic-burden outcomes. a, The polychoric correlations show that high-cost group members in one sector were
significantly more likely to reappear as high cost in other sectors. b, The distribution of high-cost individuals across multiple sectors deviated from the
expectation of a random distribution, χ2
(7, n =​ 940) =​ 2103.44, P <​ 0.001, with excesses at the two tails (that is, there are more people than expected
who do not belong to any high-cost group and there are more people than expected who belong to multiple high-cost groups). The expected distribution
is based on the assumption that the high-cost groups were independent and did not overlap beyond chance. The observed/expected ratios in each of the
nine cells are: 1.83, 0.80, 0.71, 0.52, 1.45, 5.09, 16.89, 120.53, 439.47.
NATURE HUMAN BEHAVIOUR 1, 0005 (2016) | DOI: 10.1038/s41562-016-0005 | www.nature.com/nathumbehav	 5
ARTICLESNATURE HUMAN BEHAVIOUR
individuals across multiple sectors deviated from the distribution
that would be expected if the high-cost groups were independent,
χ2
(7, n =​ 940) =​ 2103.44, P <​ 0.001 (Fig. 2b). The fact that member-
ship in one high-cost group is associated with greater likelihood of
membership in other high-cost groups re-framed the prediction
question: how well could childhood risks predict the number of
high-cost groups to which an individual belonged?
At a population level, each of the childhood factors was a statisti-
cally significant predictor of risk for belonging to more high-cost
groups (Table 2). Prediction was the same when men and women
were analysed separately (Supplementary Information). However,
this population-level analysis did not answer the question of whether
childhood factors were useful in predicting the outcome for an
individual child23
. We evaluated the accuracy of individual pre­
dictions by applying a receiver operating characteristic (ROC)
curve analysis. An ROC curve plots the sensitivity and specificity of
prediction at various thresholds and yields a metric indexing
predictive accuracy: the area under the curve (AUC)24
. The AUC
reflects the probability of correctly classifying any randomly
selected pair of cohort members in which one person belongs to
a high-cost group and the other does not. It can take on any value
between 0.50 (indicating chance prediction) and 1.00 (indicating
perfect prediction). Some pundits grade the values as: worthless
(0.5–0.6), poor (0.6–0.7), fair (0.7–0.8), good (0.8–0.9) and excellent
(0.9–1.0). Behavioural scientists note that AUC values of 0.54, 0.64
and 0.71 correspond to Cohen’s d values of 0.20, 0.50 and 0.80,
which are regarded as small, medium and large effects, respec-
tively25
. Using the standards of medical research, values approaching
0.8 suggest adequate discrimination for consideration in decision-
making about intervention26
.
The four childhood risks predicted which cohort members
belonged to any particular single high-cost group with poor-to-fair
accuracy (Fig. 3a). However, as hypothesized, prediction improved
when we turned to predicting who belonged to multiple high-
cost groups (Fig. 3b). Individuals who belonged to three or more
high-cost outcome groups are hereafter referred to as the multiple-
high-cost population segment. The multiple-high-cost segment
comprised 22% of the Dunedin cohort (n =​ 207 of 940 cohort mem-
bers). Childhood socioeconomic deprivation, maltreatment, low
IQ and poor self-control predicted these multiple-high-cost adults
ba
dc
0.0 0.1 0.2 0.3 0.4 0.5 0.6 0.7 0.8 0.9 1.0
1.0
0.9
0.8
0.7
0.6
0.5
0.4
0.3
0.2
0.1
0.0
Truepositiverate
False positive rate
— 0 versus 3+ high-cost groups =
multiple high-cost group* (AUC = 0.87)
— 0 versus 2 high-cost groups* (AUC = 0.73)
— 0 versus 1 high-cost group* (AUC = 0.67)
Chance guess
0.0 0.1 0.2 0.3 0.4 0.5 0.6 0.7 0.8 0.9 1.0
1.0
0.9
0.8
0.7
0.6
0.5
0.4
0.3
0.2
0.1
0.0
Truepositiverate
False positive rate
—
— Fatherless children (AUC = 0.67)
Social welfare* (AUC = 0.78)
— Smoking (AUC = 0.69)
— Excess weight (AUC = 0.61)
— Hospital stays* (AUC = 0.75)
— Prescription fills* (AUC = 0.75)
— Injury claims* (AUC = 0.74)
— Crime* (AUC = 0.77)
Chance guess
Chance guess
Chance guess
0.0 0.1 0.2 0.3 0.4 0.5 0.6 0.7 0.8 0.9 1.0
1.0
0.9
0.8
0.7
0.6
0.5
0.4
0.3
0.2
0.1
0.0
Truepositiverate
False positive rate
— 0 versus 3+ high-cost groups =
multiple high-cost* (AUC=0.87)
—
— Without fatherless children (AUC = 0.88)
Without social welfare* (AUC = 0.86)
— Without smoking (AUC = 0.87)
— Without excess weight (AUC = 0.88)
— Without hospital stays* (AUC = 0.87)
— Without prescription fills* (AUC = 0.86)
— Without injury claims* (AUC = 0.88)
— Without crime* (AUC = 0.87)
0.0 0.1 0.2 0.3 0.4 0.5 0.6 0.7 0.8 0.9 1.0
1.0
0.9
0.8
0.7
0.6
0.5
0.4
0.3
0.2
0.1
0.0
Truepositiverate
False positive rate
— 0 versus 3+ high-cost groups =
multiple high-cost group* (AUC = 0.79)
— 0 versus 2 high-cost groups* (AUC = 0.68)
— 0 versus 1 high-cost group* (AUC = 0.62)
Figure 3 | Predicting the probability of economic-burden outcomes. a–c, We tested the predictive performance of a model that included information
about four childhood risk factors. We assessed discrimination (that is, the model’s ability to classify correctly) using the AUC. The diagonal line in each
panel indicates random classification. Points above the diagonal represent good (better than random) classification results. a, Childhood factors only
modestly predicted which cohort members belonged to any particular single high-cost group. b, Classification improved when predicting who belonged to
multiple high-cost groups. c, Results of a leave-one-out analysis documenting that accurate prediction was not simply an artifact of predicting one
high-cost group well. d, Reaching back to early childhood, brain health at three years of age predicted which cohort members belonged to multiple
high-cost groups. All models controlled for sex. Models in a–c included childhood socioeconomic status (SES), childhood maltreatment, IQ and self-
control. *Time spent outside New Zealand is added as a covariate in analyses that use New Zealand administrative data.
6	 NATURE HUMAN BEHAVIOUR 1, 0005 (2016) | DOI: 10.1038/s41562-016-0005 | www.nature.com/nathumbehav
ARTICLES NATURE HUMAN BEHAVIOUR
with considerable accuracy, as indicated by an AUC value of 0.87
(approaching excellent). To answer the question of whether accurate
prediction of the multiple-high-cost segment capitalized on the fact
that high-cost membership in one particular sector (for example,
the crime sector, welfare sector and so on) could be predicted well,
sensitivity analyses were undertaken in which each high-cost group
was left out one sector at a time, in turn. Results showed that accu-
rate prediction was not simply an artifact of predicting well in any
one sector (Fig. 3c).
Our prediction was based on risk measures (familial socioeco-
nomic characteristics, maltreatment, IQ and self-control) that we
constructed using repeated measurements collected across the
first decade of children’s lives. However, multi-wave risk measure-
ment is not a realistic standard that can be achieved by many other
studies, nor implemented by policy analysts. Moreover, multi-wave
measures from birth to 11 years of age did not address the possible
importance of early-childhood interventions that target preschool-
ers. As such, we asked: how well could outcomes be predicted from
a single brief evaluation of each child, using a standard paediatric
assessment during the preschool years?
At 3 years of age, each child in the cohort participated in a 45 
minute examination that included assessments of neurological soft
signs, intelligence, receptive language and motor skills. The exam-
iners (having no previous knowledge of the child) then rated each
child’s frustration tolerance, resistance, restlessness, impulsivity and
lack of persistence in reaching goals. This examination yielded a sum-
mary index that we have termed brain health, a global index of the
neurocognitive status of three-year-old children27
(Supplementary
Information). Variation in brain health at three years of age sig-
nificantly predicted economically burdensome outcomes in each
sector, except injury claims (Table 3). Moreover, variation in cohort
members’ brain health at three years of age predicted with consider-
able accuracy which individuals would be members of the multiple-
high cost segment 35 years later, with an AUC value of 0.79 (Fig. 3d).
Is this multiple-high-cost population segment a priority preven-
tion target? They made up only 22% of their age cohort born in
one year in one city. However, they left a big footprint on costs of
service delivery (Fig. 4a). By age 38 years they used 66% of the birth
cohort’s welfare benefits; accounted for 77% of fatherless child-
years in the next generation; smoked 54% of the cohort’s tobacco
cigarettes; carried 40% of the cohort’s kilograms of excess weight;
occupied 57% of their cohort’s hospital-bed nights; filled 78% of all
prescriptions; were convicted for 81% of the crimes charged to the
cohort; and even made a disproportionate number (36%) of injury
claims. In contrast, the data also reveal a substantial segment of
the cohort (30%) who did not belong to the high-cost group in any
sector. Figure 4b shows that this group has left an unusually small
footprint on their society so far.
Discussion
This research yielded two results. First, the study uncovered a popu-
lation segment that featured as high cost across multiple health and
social sectors. This illustrates the potential discovery value offered
by integrating the data of multiple longitudinal administrative
databases and electronic health records. Without such data, this
population segment would have remained hidden. Second, by link-
ing administrative data with individual-level longitudinal data, the
study provides the strongest effect sizes yet, measuring the connec-
tion between an at-risk childhood and costly adult outcomes in the
population. The prediction was excellent when it relied on multiple
risk factors measured during the first decade of children’s lives, and
was still good when it relied on information derived from a relatively
Table 2 | Childhood predictors of economic-burden outcomes in a birth cohort.
Univariate models Multivariate models
IRR IRR 95% CI IRR IRR 95% CI
(a) Predicting the number of high-cost groups (range 0-8)
Number of high-cost groups*
 Childhood low SES 1.33 (1.25, 1.42) 1.21 (1.13, 1.29)
 Child maltreatment 1.23 (1.17, 1.30) 1.13 (1.07, 1.20)
 Childhood low IQ 1.26 (1.18, 1.34) 1.05 (0.98, 1.13)
 Childhood low self-control 1.32 (1.25, 1.40) 1.18 (1.11, 1.26)
Univariate models Multivariate models
RR RR 95% CI AUC AUC 95% CI RR RR 95% CI AUC AUC 95% CI
(b) Predicting the multiple-high-cost group
0 versus 1 high-cost group* 0.67 (0.62, 0.72)
 Childhood low SES 1.20 (1.08, 1.32) 0.66 (0.61, 0.71) 1.17 (1.06, 1.30)
 Child maltreatment 1.12 (1.02, 1.22) 0.64 (0.59, 0.69) 1.08 (0.98, 1.18)
 Childhood low IQ 1.07 (0.97, 1.18) 0.62 (0.57, 0.67) 0.97 (0.88, 1.08)
 Childhood low self-control 1.16 (1.06, 1.27) 0.65 (0.60, 0.70) 1.10 (0.99, 1.21)
0 versus 2 high-cost groups* 0.73 (0.69, 0.78)
 Childhood low SES 1.23 (1.10, 1.37) 0.69 (0.64, 0.74) 1.12 (1.00, 1.26)
 Child maltreatment 1.07 (0.96, 1.19) 0.66 (0.61, 0.71) 1.00 (0.89, 1.12)
 Childhood low IQ 1.33 (1.20, 1.48) 0.71 (0.67, 0.76) 1.16 (1.01, 1.32)
 Childhood low self-control 1.29 (1.19, 1.39) 0.72 (0.68, 0.77) 1.19 (1.07, 1.31)
0 versus 3+​high-cost groups =​ multiple-high-cost* 0.87 (0.84, 0.90)
 Childhood low SES 1.49 (1.35, 1.64) 0.83 (0.79, 0.86) 1.31 (1.18, 1.45)
 Child maltreatment 1.28 (1.19, 1.37) 0.80 (0.76, 0.84) 1.14 (1.05, 1.23)
 Childhood low IQ 1.35 (1.24, 1.47) 0.81 (0.77, 0.85) 1.08 (0.98, 1.20)
 Childhood low self-control 1.38 (1.27, 1.49) 0.84 (0.80, 0.87) 1.17 (1.07, 1.29)
Section (a) shows that children who grew up in socioeconomically deprived environments, who experienced child maltreatment, who scored more poorly on childhood IQ tests and who exhibited less self-
control were more likely to belong to more high-cost economic-burden groups in adulthood (ranging from 0–8). Section (b) shows that these childhood factors differentiated a group of cohort members
who became, as adults, members of the multiple-high-cost segment of their society. Incidence rate ratios (IRRs) in bold are statistically significant at P < 0.05. All other details are as for Table 1.
NATURE HUMAN BEHAVIOUR 1, 0005 (2016) | DOI: 10.1038/s41562-016-0005 | www.nature.com/nathumbehav	 7
ARTICLESNATURE HUMAN BEHAVIOUR
brief assessment of brain health when the children were three years
old. Given two three-year-old children (one who grew up to belong
to multiple high-cost groups and one who grew up to belong to
none), the model was able to classify them accurately 80% of the
time. If this pattern of findings is replicated elsewhere, it will imply
that early-years interventions, if efficient and effective with this
population segment, could make very large reductions in economic
burden. The amount that this economic burden can be reduced by
remains an empirical question at present, but historical interven-
tions that have targeted children on the basis of low IQ have proven
effective with a good rate of return, giving cause for optimism28
.
This research has limitations. First, the results reflect one geo-
graphic location and a specific historical period. New Zealand is a
useful laboratory because it suffers income inequalities similar to
the United States and the United Kingdom (after-tax Gini coef-
ficient: NZ =​ 0.33, UK =​ 0.35, US =​ 0.39)29
, spends a comparable
amount on health care (NZ =​ 10%, UK =​ 9%, US =​ 17% of GDP)30
,
has a national health care system and has a generous social safety
net. Nevertheless, geographical and generational variations require
investigation. Second, using 20% to identify a vital proportion of
the population may seem arbitrary, but rather than choosing a
sample-specific operant, we chose the Pareto principle a priori as
a useful rule-of-thumb because it is familiar to researchers, policy-
makers and the public. Third, the data were right-hand censored at
age 38 years, and we could not test how well early-childhood risks
predict economically burdensome outcomes across the full life
course. This is an important question because the health-care bur-
den of developed societies concentrates in older age groups. To the
extent that factors such as smoking, excess weight and health prob-
lems during midlife foretell health-care burden and social depen-
dency, findings here should extend to later life (keeping in mind
that midlife smoking, weight problems and health problems also
forecast premature mortality). Fourth, we address the strength of
prediction only; we did not address the causal mechanisms behind
the predictive associations reported here. Whether the risk fac-
tors studied here are causal, or whether they mediate other prior
causal influences, the finding that economically burdensome adult
outcomes are predictable from these early-life factors with moder-
ate to strong effects suggests that these risk factors are not unrea-
sonable targets for randomized experimental intervention trials.
Moreover, many interventions have treated risk factors that are
not root causes, and improved outcome nevertheless. Fifth, we are
unable to directly compare costs across sectors because we did not
monetize outcomes within each sector. Although the multiple-high-
cost group is clearly ‘expensive’, we did not convert each of our out-
comes (for example, pack-years of smoking, criminal convictions,
Table 3 | Variation in children’s brain health at 3 years of age
predicted which children belonged to high-cost economic-burden
groups 35 years later.
RR RR 95% CI AUC AUC 95% CI
(a) High cost in each sector
Social welfare* 1.38 (1.25, 1.53) 0.73 (0.69, 0.77)
Fatherless children 1.22 (1.07, 1.38) 0.61 (0.56, 0.66)
Smoking 1.25 (1.12, 1.40) 0.60 (0.55, 0.64)
Excess weight 1.15 (1.02, 1.29) 0.56 (0.52, 0.61)
Hospital stays* 1.18 (1.05, 1.34) 0.72 (0.68, 0.76)
Prescription fills* 1.23 (1.10, 1.38) 0.73 (0.69, 0.76)
Injury claims* 1.10 (0.99, 1.23) 0.74 (0.70, 0.77)
Crime* 1.19 (1.09, 1.29) 0.72 (0.68, 0.75)
(b) Number of groups IRR IRR 95% CI
Number of high-cost groups* 1.20 (1.13, 1.27)
(c) Multiple-high-cost groups RR RR 95% CI AUC AUC 95% CI
0 versus 1 high-cost group* 1.03 (0.94, 1.14) 0.62 (0.57, 0.67)
0 versus 2 high-cost groups* 1.17 (1.07, 1.28) 0.68 (0.63, 0.73)
0 versus 3+​high-cost groups* 1.26 (1.17, 1.36) 0.79 (0.75, 0.83)
Section (a) shows that variation in brain health at 3 years of age predicted who was more likely
to belong to a high-cost group in adulthood, in each of eight different sectors. Section (b) shows
that brain health at 3 years of age predicted the number of high-cost groups (ranging from
0−8) to which each cohort member belonged. Section (c) shows that brain health at 3 years of
age differentiated cohort members who became, as adults, members of the multiple-high-cost
segment of their society. All models control for sex. The prediction was the same when men
and women were analysed separately (see Supplementary Information for details). *Time spent
outside New Zealand is added as a covariate in analyses that use New Zealand administrative
data. AUC, area under the curve; CI, confidence interval; IRR, incidence rate ratio; RR, risk ratio.
RR’s and IRR’s in bold are statistically significant at P < 0.05.
100
90
80
70
60
50
40
30
20
10
0
Percentage
Percentage
22%
66%
77%
a b
54%
40%
57%
78%
36%
81%
Cohort
Socialwelfare
Fatherless
children
Smoking
Excessweight
Hospitalstays
Prescriptionfills
Injuryclaims
Crime
Cohort
SocialwelfareFatherless
children
Smoking
Excessweight
HospitalstaysPrescriptionfills
Injuryclaims
Crime
100
90
80
70
60
50
40
30
20
10
0
30%
6% 3%
7%
1%
7%
3%
15%
0%
Figure 4 | The big footprint of multiple-high-cost users. a, Costs to society of multiple-high-cost users. Although the multiple-high-cost group made
up only 22% of the cohort (n =​ 207), it accounted for a disproportionate share of economic-burden outcomes across all eight health and social sectors
that we examined. b, In contrast, a substantial segment of the cohort did not belong to any high-cost group (30%; n =​ 289) and left an unusually light
footprint on society.
8	 NATURE HUMAN BEHAVIOUR 1, 0005 (2016) | DOI: 10.1038/s41562-016-0005 | www.nature.com/nathumbehav
ARTICLES NATURE HUMAN BEHAVIOUR
injury insurance claims) to (New Zealand) dollars, for the follow-
ing three reasons: monetizing outcomes is informative when evalu-
ating return on investment of an intervention of known cost, but
we did not study an intervention22
; monetizing costs is not without
assumptions, and estimates are time- and place-specific; compared
with New-Zealand-specific monetized estimates the concentration
metric reported here will be a more feasible target for replication
and extension studies. The concentration metric can be used, for
example, to ask whether high-cost groups aggregate to the same
extent in different times and places, whether the same risk factors
predict a multiple-high-cost group across time and place, and how
historical events such as economic recessions or immigration affect
high-cost distributions.
As a final limitation, we are aware that from a different perspec-
tive, the economically burdensome behaviours we have studied can
be considered economically generative, or at least neutral. Smokers
fuel the tobacco industry; crime provides jobs in policing, courts and
corrections; hospital admissions, prescription fills and injury insur-
ance claims animate the health care and pharmaceutical industries.
Such cost–benefit analyses were beyond our scope. Moreover, it
is not we who designated these outcomes as burdensome; rather,
we selected them because they are oft-cited long-term targets of
early-years intervention policy18,31
.
This research revealed a predictable aggregation of different
economically burdensome adult outcomes in the same multiple-
high-cost segment of the population. This aggregation has impli-
cations for methodology, prevention science and human rights.
Methodologically, the finding illustrates that social science research
on risk prediction can benefit from considering the accumula-
tion of outcomes within a lifetime. Social scientists have observed
that failure to aggregate information about risk predictors results
in small or null effects in prediction32,33
, but the recommendation
to aggregate has typically been applied only to predictor variables,
such as when studying cumulative disadvantage or adverse child-
hood experiences34,35
. We turned this recommendation on its head
by showing how aggregating outcome variables, not just predictors,
can improve effect sizes in longitudinal prediction research. Such
aggregation has been used in medical epidemiology, to index the
cumulative deficits associated with ageing36
for example, but it is
rarely used in the social and behavioural sciences. Treatment stud-
ies, as well as observational studies, can make use of this principle
to more comprehensively evaluate impact. Moreover, health, social
and justice sectors might benefit from understanding that the bulk
of their services are going to the same clients.
The finding also has implications for early-years prevention sci-
ence2,37–39
. We sought to inform a question that nags at the behav-
ioural and social sciences, and that has strategic consequences for
national policy on children: how strong is the connection between
childhood risk and future costly life-course outcomes? Results
reported here suggest that the importance of childhood risks for
poor adult outcomes has generally been underestimated. It is not
news to service-delivery professionals that some individuals use
more than their share of services. What is new is that individuals
feature in multiple service sectors and they can be identified as
children with reasonable accuracy. The question for intervention
science becomes not just ‘what works?’ but ‘what works for this
multiple-high-cost population segment of children?’
Finally, the finding has implications for human rights. We aimed
to test whether population segmentation could give a more accurate
evidence base to clarify the need for early-years intervention. We
are aware of the potential for misuse; population segments are often
stigmatized and stereotyped. However, the predictions reported
here make clear that the most costly adults in our cohort started the
race of life from a starting block somewhere behind the rest, and
while carrying a heavy handicap in brain health. Such a disadvan-
taged citizen is unlikely to be able to cover his or her share of health
and social costs, but there is no merit in blaming the victim for
economic burden following from childhood disadvantage. Instead,
ameliorating the effects of childhood disadvantage is an important
aim40,41
and achieving this through early-years support for families
and children could benefit all members of a society.
Methods
A more detailed report of the study design, measurement and statistical analysis is
provided in the Supplementary Information.
Dunedin study sample. Participants are members of the Dunedin Multi­
disciplinary Health and Development Study, which tracks the development
of 1,037 individuals born in the period 1972–1973 in Dunedin, New Zealand42
.
Measuring economic-burden outcomes. We drew on personal interviews and
on New Zealand’s multiple nationwide administrative databases and electronic
medical records to ascertain the cumulative distributions of eight economically
burdensome outcomes (Fig. 1).
Social welfare benefit months. Using record linkage, we collected information
about social welfare benefits received from the New Zealand Ministry of Social
Development (Fig. 1a). The cohort accumulated 24,997 months of welfare
payments between January 1993 and March 2012 (approximately age 21–38 years).
The cumulative distribution of benefit months revealed that 20% of the cohort
accounted for 80% of the months of social welfare benefits received by the cohort.
These individuals constituted a high-cost group in the social welfare sector.
Fatherless child-years. Fatherless child-years (Fig. 1b) are defined by
the absence of the biological father from the households in which a cohort
member’s offspring live. Using life history calendars, we recorded information
about childbirths and the living arrangements of all cohort members’ offspring
(until each reached 18 years of age). In the cohort, 669 parents produced
1,418 live births. These offspring lived a total of 10,946 child-years of which
25% (2,755 child-years) were spent in households without their biological
fathers. Twenty per cent of the cohort accounted for 82% of their offsprings’
fatherless years. These individuals constituted a high-cost group in the
fatherless-children sector.
Tobacco smoking pack-years. In repeated personal interviews, we gathered details
about tobacco smoking and calculated the number of pack-years smoked (Fig. 1c),
where pack-years =​ ((number of cigarettes smoked per day ×​ number
of years smoked)/20); 1 pack-year =​ 7,305 cigarettes. The cohort smoked
5,760 pack-years, the equivalent of 42,076,800 cigarettes. Twenty per cent
of the cohort accounted for 68% of the pack-years smoked. These individuals
constituted a high-cost group in the smoking sector.
Excess obese kilograms. We measured height and weight during anthropometric
assessments (Fig. 1d). By early midlife, the cohort had put on 2,924 kg of excess
weight, defined as the total number of kilograms beyond a BMI of 30, the
recognized cut-off for obesity; thus, a person with a BMI ≤​ 30 carries 0 excess obese
kilograms, whereas the excess weight of a person with a BMI >​ 30 is their actual
weight minus the weight predicted for a BMI of 30 based on their height. Twenty
per cent of the cohort accounted for 98% of excess weight in the cohort. These
individuals constituted a high-cost group in the excess-weight sector.
Hospital-bed nights. We obtained details of admission events to public
hospitals from Ministry of Health records (Fig. 1e). The cohort accumulated
8,958 nights in the hospital from January 1988 to March 2012. Twenty
per cent of the cohort accounted for 77% of hospital-bed nights in the cohort.
These individuals constituted a high-cost group in the hospital-stay sector.
Prescription drug fills. We obtained information about prescription drugs filled
by pharmacists, as indicated on the nationwide Pharmaceutical Management
Agency database (Fig. 1f). The cohort filled 66,811 prescriptions between
January 2006 and March 2012. Twenty per cent of the cohort accounted
for 89% of prescriptions. These individuals constituted a high-cost group
in the prescription-fill sector.
Injury insurance claims. We obtained records of insurance claims for accidents
and injuries from the Accident Compensation Corporation, the national provider
of comprehensive, no-fault personal injury cover for New Zealanders (Fig. 1g).
The cohort made 6,919 claims between January 1993 and March 2012. The
concentration was not as pronounced for this outcome as for others, perhaps
owing to the random nature of many accidents and injuries. Nevertheless, 20%
of the cohort accounted for 52% of injury claims in the cohort. These individuals
constituted a high-cost group in the injury-claim sector.
Convictions for crime. We obtained information about criminal convictions
by searching the records available to the New Zealand Police (Fig. 1h).
The cohort had 2,141 convictions for adult crimes (excluding routine traffic
offenses), beginning at age 15. The concentration was more pronounced
NATURE HUMAN BEHAVIOUR 1, 0005 (2016) | DOI: 10.1038/s41562-016-0005 | www.nature.com/nathumbehav	 9
ARTICLESNATURE HUMAN BEHAVIOUR
for this outcome than for others: 20% of the cohort accounted for 97% of
convictions in the cohort. These individuals constituted a high-cost group
in the crime sector.
Measuring childhood risk factors. We measured risk factors that are thought
to augur poor adult outcomes. All risk factor measures have been described in
previous reports about this cohort.
Childhood socioeconomic status43
was defined as the average of the highest
occupational status of either parent across study assessments from the cohort
member’s birth through 11 years (1 =​ unskilled labourer; 6 =​ professional),
on New Zealand’s occupational rating of the 1970s.
Childhood maltreatment44
includes evidence of: (1) maternal rejection
assessed at 3 years of age by observational ratings of mothers’ interaction
with the study children, (2) harsh discipline assessed at ages 7 and 9 years by
parental report of disciplinary behaviours, (3) two or more changes in the
child’s primary caregiver, and (4) physical abuse and (5) sexual abuse
reported by study members once they reached adulthood. For each child,
our cumulative index counts the number of maltreatment indicators during
the first decade of life; 63.7% of children experienced no maltreatment,
26.7% experienced one indicator of maltreatment (hereinafter ‘probable’
maltreatment), and 9.6% experienced two or more indicators of maltreatment
(‘definite’ maltreatment).
Childhood intelligence9
was measured as IQ with the Wechsler Intelligence
Scale for Children – Revised (WISC-R) administered at ages 7, 9 and 11 years.
IQ scores for the three ages were averaged and standardized.
Childhood self-control9
during the first decade of life was measured using
nine measures of self-control: observational ratings of children’s lack of control
(ages 3 and 5 years) and parent, teacher and self-reports of hyperactivity, lack of
persistence, inattention, impulsive aggression and impulsivity (ages 5, 7, 9 and
11 years). The nine measures were positively and significantly correlated. Based
on principal components analysis, the standardized measures were averaged into
a single composite comprising multiple ages and informants, with strong internal
reliability α =​ 0.86.
Brain health at three years of age. Using the information from the child
examination and subsequent behaviour ratings completed when study participants
were three years old, we created a summary factor score via confirmatory
factor analysis which we termed brain health, a global index of the child’s early-
neurocognitive status27
.
Statistical analysis. We began our work by examining the cumulative distributions
of each of the eight outcomes (Fig. 1).
We tested the associations between childhood risk factors and growing up
to be a member of a high-cost group using modified Poisson regression models to
estimate risk ratios (RRs). We then added up (0–8) the number of high-cost
groups to which each individual belonged and used negative binomial regressions
to model incident rate ratios (IRRs). We followed up on this analysis to test
the associations between childhood risk factors and membership in the
multiple-high-cost sector. We evaluated predictive accuracy using ROC curve
analysis to estimate each individual’s probability of belonging to a high-cost
group in society based on their childhood risks.
Data availability. Dunedin Study data are available from the authors on reasonable
request. A managed-access process ensures that approval is granted to research
that comes under the terms of participant consent and privacy (see Supplementary
Information for data-sharing details).
Received 25 April 2016; accepted 22 September 2016;
published 12 December 2016
References
1.	 Human Capital Development Before Age Five (eds Almond, D. & Currie, J.)
(National Bureau of Economic Research, 2010); ​http://www.nber.org/papers/
w15827​
2.	 Duncan, G. J. & Magnuson, K. Investing in preschool programs.
J. Econ. Perspect. 27, 109–131 (2013).
3.	 Campbell, F. et al. Early childhood investments substantially boost adult
health. Science 343, 1478–1485 (2014).
4.	 Gertler, P. et al. Labor market returns to an early childhood stimulation
intervention in Jamaica. Science 344, 998–1001 (2014).
5.	 Heckman, J., Pinto, R. & Savelyev, P. Understanding the mechanisms
through which an influential early childhood program boosted adult
outcomes. Am. Econ. Rev. 103, 2052–2086 (2013).
6.	 Reynolds, A. J., Temple, J. A., Ou, S. R., Arteaga, I. A. & White, B. A. B.
School-based early childhood education and age-28 well-being: effects by
timing, dosage, and subgroups. Science 333, 360–364 (2011).
7.	 Karoly, L. A., Kilburn, M. R. & Cannon, J. S. Proven Benefits of Early
Childhood Interventions (Rand Corporation, 2005); ​http://www.rand.org/pubs/
research_briefs/RB9145.html​
8.	 Heckman, J. J. Skill formation and the economics of investing in
disadvantaged children. Science 312, 1900–1902 (2006).
9.	 Moffitt, T. E. et al. A gradient of childhood self-control predicts health,
wealth, and public safety. Proc. Natl Acad. Sci. USA 108, 2693–2698 (2011).
10.	Roberts, B. W., Kuncel, N. R., Shiner, R., Caspi, A. & Goldberg, L. R.
The power of personality: the comparative validity of personality traits,
socioeconomic status, and cognitive ability for predicting important life
outcomes. Perspect. Psychol. Sci. 2, 313–345 (2007).
11.	Felitti, V. J. et al. Relationship of childhood abuse and household dysfunction
to many of the leading causes of death in adults. The Adverse Childhood
Experiences (ACE) Study. Am. J. Prev. Med. 14, 245–258 (1998).
12.	Rutter, M. Nature, nurture, and development: from evangelism through
science toward policy and practice. Child Dev. 73, 1–21 (2002).
13.	Sampson, R. The characterological imperative. J. Econ. Lit. 54,
493–513 (2016).
14.	Steuerle, E. & Jackson, L. M. Advancing the Power of Economic Evidence to
Inform Investments in Children, Youth, and Families (National Academies,
2016).
15.	Shonkoff, J. P., Boyce, W. T. & McEwen, B. S. Neuroscience, molecular
biology, and the childhood roots of health disparities: building a new
framework for health promotion and disease prevention. J. Am. Med. Assoc.
301, 2252–2259 (2009).
16.	Diamond, A. Activities and programs that improve children’s executive
functions. Curr. Dir. Psychol. Sci. 21, 335–341 (2012).
17.	Black, M. M. & Dewey, K. G. Promoting equity through integrated
early child development and nutrition interventions. Ann. NY Acad. Sci.
1308, 1–10 (2014).
18.	National Prevention Council National Prevention Strategy (US Department of
Health & Human Services, 2011); ​http://www.surgeongeneral.gov/priorities/
prevention/strategy​
19.	Power, C., Kuh, D. & Morton, S. From developmental origins of adult disease
to life course research on adult disease and aging: insights from birth cohort
studies. Annu. Rev. Public Health 34, 7–28 (2013).
20.	Bunkley, N. Jospeh Juran, 103, pioneer in quality control dies. The New York
Times (3 March 2008); ​http://www.nytimes.com/2008/03/03/business/03juran.
html?_r=​0​
21.	Rooney, P. Microsoft’s CEO: 80–20 rule applies to bugs, not just features.
CRN Magazine (3 October 2002); ​http://www.crn.com/news/security/
18821726/microsofts-ceo-80-20-rule-applies-to-bugs-not-just-features.htm​
22.	Heckman, J., Moon, S. H., Pinto, R., Savelyev, P. & Yavitz, A. Analyzing social
experiments as implemented: a reexamination of the evidence from the
HighScope Perry Preschool Program. Quant. Econom. 1, 1–46 (2010).
23.	Pepe, M. S., Janes, H., Longton, G., Leisenring, W. & Newcomb, P.
Limitations of the odds ratio in gauging the performance of a diagnostic,
prognostic, or screening marker. Am. J. Epidemiol. 159, 882–890 (2004).
24.	Kraemer, H. C. et al. Coming to terms with the terms of risk. Arch. Gen.
Psychiat. 54, 337–343 (1997).
25.	Rice, M. E. & Harris, G. T. Comparing effect sizes in follow-up studies:
ROC Area, Cohen’s d, and r. Law Hum. Behav. 29, 615–620 (2005).
26.	Hosmer, D. & Lemeshow, S. Applied Logistic Regression (Wiley, 2005).
27.	Caspi, A. et al. The p factor: one general psychopathology factor in the
structure of psychiatric disorders? Clin. Psychol. Sci. 2, 119–137 (2014).
28.	Heckman, J. J., Moon, S. H., Pinto, R., Savelyev, P. A. & Yavitz, A. The rate
of return to the High Scope Perry Preschool Program. J. Public Econ. 94,
114–128 (2010).
29.	Income distribution and poverty. OECD.Stat. ​https://stats.oecd.org/Index.
aspx?DataSetCode=IDD​ (2012).
30.	Health Expenditure, Total (% of GDP) (The World Bank, 2016);
​http://data.worldbank.org/indicator/SH.XPD.TOTL.ZS/​
31.	Every Child Matters (Department for Education, 2003); ​https://www.
education.gov.uk/consultations/downloadableDocs/EveryChildMatters.pdf​
32.	Thomas, D. C. Invited commentary: is it time to retire the “pack-years”
variable? Maybe not! Am. J. Epidemiol. 179, 299–302 (2014).
33.	Rushton, J. P., Brainerd, C.J. & Pressley, M. Behavioral development and
construct validity: the principle of aggregation. Psychol. Bull. 94, 18–38
(1983).
34.	Evans, G. W., Li, D. & Whipple, S. S. Cumulative risk and child development.
Psychol. Bull. 139, 1342–1396 (2013).
35.	Adverse childhood experiences (ACEs). Centers for Disease Control and
Prevention ​http://www.cdc.gov/violenceprevention/acestudy​ (2016).
36.	Kulminski, A. M. et al. Do gender, disability, and morbidity affect aging rate
in the LLFS? Application of indices of cumulative deficits. Mech. Ageing Dev.
132, 195–201 (2011).
37.	Gormley, W. T. Jr From science to policy in early childhood education.
Science 333, 978–981 (2011).
38.	Heckman, J. J. The economics, technology, and neuroscience of human
capability formation. Proc. Natl. Acad. Sci. USA 104, 13250–13255 (2007).
39.	Gabrieli, C., Ansel, D. & Krachman, S. B. Ready to be Counted: The Research
Case for Education Policy Action on Non-cognitive Skills (Transforming
Education, 2015); ​http://www.transformingeducation.org/resources/
10	 NATURE HUMAN BEHAVIOUR 1, 0005 (2016) | DOI: 10.1038/s41562-016-0005 | www.nature.com/nathumbehav
ARTICLES NATURE HUMAN BEHAVIOUR
40.	Hoedemaekers, R. & Dekkers, W. Justice and solidarity in priority setting in
health care. Health Care Anal. 11, 325–343 (2003).
41.	Kohler, H. P. & Behrman, J. R. Benefits and Costs of the Population
and Demography Targets for the Post-2015 Development Agenda.
(Copenhagen Consensus Center, 2015); ​http://www.copenhagenconsensus.
com/sites/default/files/population_assessment_-_kohler_behrman_0.pdf
42.	Poulton, R., Moffitt, T. E. & Silva, P. A. The Dunedin Multidisciplinary
Health and Development Study: overview of the first 40 years,
with an eye to the future. Soc. Psychiatry Psychiatr. Epidemiol. 50, 679–693
(2015).
43.	Poulton, R. et al. Association between children’s experience of socioeconomic
disadvantage and adult health: a life-course study. Lancet 360, 1640–1645
(2002).
44.	Caspi, A. et al. Role of genotype in the cycle of violence in maltreated
children. Science 297, 851–854 (2002).
Acknowledgements
We thank Dunedin Study members, their families and Dunedin Study founder
Phil Silva. This research received support from US National Institute on Aging (NIA)
grants AG032282, AG048895, AG049789, UK Medical Research Council (MRC)
grant MR/K00381X and ESRC grant ES/M010309/1. The Dunedin Study was supported
by the New Zealand Health Research Council and New Zealand Ministry of Business,
Innovation and Employment (MBIE). Additional support was provided by the Jacobs
Foundation and the Avielle Foundation. The funders had no role in study design,
data collection and analysis, decision to publish, or preparation of the manuscript.
We thank D. Reiss, J. Heckman and his seminar members, and the New Zealand agencies
that offered guidance and assistance to the Dunedin Study. We also thank Z. van der
Merwe (ACC), C. Lewis (Ministry of Health), M. Wilson and R. Ota (Ministry of
Social Development), the Otago Police District Commander, P. Stevenson, J. Curren
and the Dunedin Police. The Otago University Ethics Committee, Duke University and
King’s College London provided ethical approval for the Dunedin Study. Participants
gave written consent before data were collected.
Author contributions
A.C., R.P. and T.E.M. designed the research, and A.C., R.M.H. and T.E.M. wrote the
manuscript. A.C., S.H., S.R., R.P. and T.E.M. collected the data, and it was analysed
by A.C., R.M.H. and H.H. All authors reviewed drafts, provided critical feedback and
approved the final manuscript.
Additional information
Supplementary information is available for this paper.
Reprints and permissions information is available at www.nature.com/reprints.
Correspondence and requests for materials should be addressed to A.C.
How to cite this article: Caspi, A. et al. Childhood forecasting of a small segment of the
population with large economic burden. Nat. Hum. Behav. 1, 0005 (2016).
Competing interests
The authors declare no competing interests.

More Related Content

What's hot

Assessment and Treatment of Childhood Obesity
Assessment and Treatment of Childhood ObesityAssessment and Treatment of Childhood Obesity
Assessment and Treatment of Childhood ObesityHEALTHCoalition
 
Son preference and fertility behavior evidence from Viet Nam - Project statement
Son preference and fertility behavior evidence from Viet Nam - Project statementSon preference and fertility behavior evidence from Viet Nam - Project statement
Son preference and fertility behavior evidence from Viet Nam - Project statementHanh To
 
Multi Indicator cluster survey 2014
Multi Indicator cluster survey 2014Multi Indicator cluster survey 2014
Multi Indicator cluster survey 2014Hanh To
 
Statistics In Public Health Practice
Statistics In Public Health PracticeStatistics In Public Health Practice
Statistics In Public Health Practicefhardnett
 
Impact of increased district-level insecticide-treated net (ITN) distribution...
Impact of increased district-level insecticide-treated net (ITN) distribution...Impact of increased district-level insecticide-treated net (ITN) distribution...
Impact of increased district-level insecticide-treated net (ITN) distribution...MEASURE Evaluation
 
Terrorism_Modelling Paper_BMC_2009_9_91
Terrorism_Modelling Paper_BMC_2009_9_91Terrorism_Modelling Paper_BMC_2009_9_91
Terrorism_Modelling Paper_BMC_2009_9_91Garry Stevens
 
Sexually Transmitted Infection Grant Proposal 2015
Sexually Transmitted Infection Grant Proposal 2015Sexually Transmitted Infection Grant Proposal 2015
Sexually Transmitted Infection Grant Proposal 2015Hannah O'Connor CHES
 
The negative impacts of adolescent sexuality problems among secondary school ...
The negative impacts of adolescent sexuality problems among secondary school ...The negative impacts of adolescent sexuality problems among secondary school ...
The negative impacts of adolescent sexuality problems among secondary school ...lukeman Joseph Ade shittu
 
Burden of Caregivers Care for Children with Thalassemia at Babylon Child and ...
Burden of Caregivers Care for Children with Thalassemia at Babylon Child and ...Burden of Caregivers Care for Children with Thalassemia at Babylon Child and ...
Burden of Caregivers Care for Children with Thalassemia at Babylon Child and ...iosrjce
 
Male circumcision should be promoted in developing countries as a major means...
Male circumcision should be promoted in developing countries as a major means...Male circumcision should be promoted in developing countries as a major means...
Male circumcision should be promoted in developing countries as a major means...Felipe Mejia Medina
 
Parental alcohol consumption and the risk of congenital heart diseases in off...
Parental alcohol consumption and the risk of congenital heart diseases in off...Parental alcohol consumption and the risk of congenital heart diseases in off...
Parental alcohol consumption and the risk of congenital heart diseases in off...BARRY STANLEY 2 fasd
 
Asokan_ Grant Proposal doc
Asokan_ Grant Proposal docAsokan_ Grant Proposal doc
Asokan_ Grant Proposal docRatheesh Asokan
 
External validation of an electronic phenotyping algorithm to detect attentio...
External validation of an electronic phenotyping algorithm to detect attentio...External validation of an electronic phenotyping algorithm to detect attentio...
External validation of an electronic phenotyping algorithm to detect attentio...TÀI LIỆU NGÀNH MAY
 
Wekerle Pediatrics Rome 2018
Wekerle Pediatrics Rome 2018Wekerle Pediatrics Rome 2018
Wekerle Pediatrics Rome 2018Christine Wekerle
 

What's hot (20)

Assessment and Treatment of Childhood Obesity
Assessment and Treatment of Childhood ObesityAssessment and Treatment of Childhood Obesity
Assessment and Treatment of Childhood Obesity
 
Son preference and fertility behavior evidence from Viet Nam - Project statement
Son preference and fertility behavior evidence from Viet Nam - Project statementSon preference and fertility behavior evidence from Viet Nam - Project statement
Son preference and fertility behavior evidence from Viet Nam - Project statement
 
Multi Indicator cluster survey 2014
Multi Indicator cluster survey 2014Multi Indicator cluster survey 2014
Multi Indicator cluster survey 2014
 
Hallman africa insight final
Hallman africa insight final Hallman africa insight final
Hallman africa insight final
 
Statistics In Public Health Practice
Statistics In Public Health PracticeStatistics In Public Health Practice
Statistics In Public Health Practice
 
Impact of increased district-level insecticide-treated net (ITN) distribution...
Impact of increased district-level insecticide-treated net (ITN) distribution...Impact of increased district-level insecticide-treated net (ITN) distribution...
Impact of increased district-level insecticide-treated net (ITN) distribution...
 
LindseyGarrison_CE
LindseyGarrison_CELindseyGarrison_CE
LindseyGarrison_CE
 
Terrorism_Modelling Paper_BMC_2009_9_91
Terrorism_Modelling Paper_BMC_2009_9_91Terrorism_Modelling Paper_BMC_2009_9_91
Terrorism_Modelling Paper_BMC_2009_9_91
 
Sexually Transmitted Infection Grant Proposal 2015
Sexually Transmitted Infection Grant Proposal 2015Sexually Transmitted Infection Grant Proposal 2015
Sexually Transmitted Infection Grant Proposal 2015
 
American Journal of Urology Research
American Journal of Urology ResearchAmerican Journal of Urology Research
American Journal of Urology Research
 
The negative impacts of adolescent sexuality problems among secondary school ...
The negative impacts of adolescent sexuality problems among secondary school ...The negative impacts of adolescent sexuality problems among secondary school ...
The negative impacts of adolescent sexuality problems among secondary school ...
 
Burden of Caregivers Care for Children with Thalassemia at Babylon Child and ...
Burden of Caregivers Care for Children with Thalassemia at Babylon Child and ...Burden of Caregivers Care for Children with Thalassemia at Babylon Child and ...
Burden of Caregivers Care for Children with Thalassemia at Babylon Child and ...
 
We Can Do More
We Can Do MoreWe Can Do More
We Can Do More
 
Abstract
AbstractAbstract
Abstract
 
Male circumcision should be promoted in developing countries as a major means...
Male circumcision should be promoted in developing countries as a major means...Male circumcision should be promoted in developing countries as a major means...
Male circumcision should be promoted in developing countries as a major means...
 
Parental alcohol consumption and the risk of congenital heart diseases in off...
Parental alcohol consumption and the risk of congenital heart diseases in off...Parental alcohol consumption and the risk of congenital heart diseases in off...
Parental alcohol consumption and the risk of congenital heart diseases in off...
 
Asokan_ Grant Proposal doc
Asokan_ Grant Proposal docAsokan_ Grant Proposal doc
Asokan_ Grant Proposal doc
 
External validation of an electronic phenotyping algorithm to detect attentio...
External validation of an electronic phenotyping algorithm to detect attentio...External validation of an electronic phenotyping algorithm to detect attentio...
External validation of an electronic phenotyping algorithm to detect attentio...
 
Wekerle Pediatrics Rome 2018
Wekerle Pediatrics Rome 2018Wekerle Pediatrics Rome 2018
Wekerle Pediatrics Rome 2018
 
A Risk and Resilience Framework for Child, Youth, and Family Policy
A Risk and Resilience Framework for Child, Youth, and Family PolicyA Risk and Resilience Framework for Child, Youth, and Family Policy
A Risk and Resilience Framework for Child, Youth, and Family Policy
 

Similar to Childhood forecasting

Health Inequalities Among Australians
Health Inequalities Among AustraliansHealth Inequalities Among Australians
Health Inequalities Among AustraliansLaura Torres
 
Preventing Childhood Obesity: The Need To Create Healthy Places
Preventing Childhood Obesity: The Need To Create Healthy PlacesPreventing Childhood Obesity: The Need To Create Healthy Places
Preventing Childhood Obesity: The Need To Create Healthy PlacesKlausGroenholm
 
Running head UNIT 8 PROJECT1UNIT 8 PROJECT2Unit 8 Proj.docx
Running head  UNIT 8 PROJECT1UNIT 8 PROJECT2Unit 8 Proj.docxRunning head  UNIT 8 PROJECT1UNIT 8 PROJECT2Unit 8 Proj.docx
Running head UNIT 8 PROJECT1UNIT 8 PROJECT2Unit 8 Proj.docxjoellemurphey
 
Crimson Publishers-The Role of Financial Stress in Old Age well-Being
Crimson Publishers-The Role of Financial Stress in Old Age well-BeingCrimson Publishers-The Role of Financial Stress in Old Age well-Being
Crimson Publishers-The Role of Financial Stress in Old Age well-BeingCrimsonPublishersGGS
 
SOA Case Challenge Indiana University (1)
SOA Case Challenge Indiana University (1)SOA Case Challenge Indiana University (1)
SOA Case Challenge Indiana University (1)Samual Pfeffer
 
A realist synthesis to develop an explanatory model of how policy instruments...
A realist synthesis to develop an explanatory model of how policy instruments...A realist synthesis to develop an explanatory model of how policy instruments...
A realist synthesis to develop an explanatory model of how policy instruments...Araz Taeihagh
 
Kids And Old Age: Taking the long view of children's health and well-being
Kids And Old Age: Taking the long view of children's health and well-beingKids And Old Age: Taking the long view of children's health and well-being
Kids And Old Age: Taking the long view of children's health and well-beingThe Economist Media Businesses
 
Sexual Risk Behaviors Research
Sexual Risk Behaviors Research Sexual Risk Behaviors Research
Sexual Risk Behaviors Research Brittney Johns
 
Assessment of communication messages used in adolescent
Assessment of communication messages used in adolescentAssessment of communication messages used in adolescent
Assessment of communication messages used in adolescentAlexander Decker
 
HLT 362V Grand Canyon University Wk5 Epidemiology Discussion Responses.docx
HLT 362V Grand Canyon University Wk5 Epidemiology Discussion Responses.docxHLT 362V Grand Canyon University Wk5 Epidemiology Discussion Responses.docx
HLT 362V Grand Canyon University Wk5 Epidemiology Discussion Responses.docxbkbk37
 
Running head ASSIGNMENT 3 1ASSIGNMENT 3 4
Running head ASSIGNMENT 3 1ASSIGNMENT 3 4Running head ASSIGNMENT 3 1ASSIGNMENT 3 4
Running head ASSIGNMENT 3 1ASSIGNMENT 3 4MalikPinckney86
 
Ageism, Healthy Life Expectancy and Population.pdf
Ageism, Healthy Life Expectancy and Population.pdfAgeism, Healthy Life Expectancy and Population.pdf
Ageism, Healthy Life Expectancy and Population.pdfFULYAENAYAVCI
 
[[INOSR ES 11(2)134-147 Evaluation of the Infant Mortality rate at Ishaka Adv...
[[INOSR ES 11(2)134-147 Evaluation of the Infant Mortality rate at Ishaka Adv...[[INOSR ES 11(2)134-147 Evaluation of the Infant Mortality rate at Ishaka Adv...
[[INOSR ES 11(2)134-147 Evaluation of the Infant Mortality rate at Ishaka Adv...PUBLISHERJOURNAL
 
Screening Tool for Developmental Disorders in Children
Screening Tool for Developmental Disorders in ChildrenScreening Tool for Developmental Disorders in Children
Screening Tool for Developmental Disorders in ChildrenApollo Hospitals
 
Future of Health
Future of HealthFuture of Health
Future of HealthS A Tabish
 

Similar to Childhood forecasting (20)

TL-6839 Barroso
TL-6839 BarrosoTL-6839 Barroso
TL-6839 Barroso
 
Environmental Pollutants and Disease in American
Environmental Pollutants and Disease in AmericanEnvironmental Pollutants and Disease in American
Environmental Pollutants and Disease in American
 
Health Inequalities Among Australians
Health Inequalities Among AustraliansHealth Inequalities Among Australians
Health Inequalities Among Australians
 
Preventing Childhood Obesity: The Need To Create Healthy Places
Preventing Childhood Obesity: The Need To Create Healthy PlacesPreventing Childhood Obesity: The Need To Create Healthy Places
Preventing Childhood Obesity: The Need To Create Healthy Places
 
Running head UNIT 8 PROJECT1UNIT 8 PROJECT2Unit 8 Proj.docx
Running head  UNIT 8 PROJECT1UNIT 8 PROJECT2Unit 8 Proj.docxRunning head  UNIT 8 PROJECT1UNIT 8 PROJECT2Unit 8 Proj.docx
Running head UNIT 8 PROJECT1UNIT 8 PROJECT2Unit 8 Proj.docx
 
HBM- vehicular emissions
HBM- vehicular emissionsHBM- vehicular emissions
HBM- vehicular emissions
 
Crimson Publishers-The Role of Financial Stress in Old Age well-Being
Crimson Publishers-The Role of Financial Stress in Old Age well-BeingCrimson Publishers-The Role of Financial Stress in Old Age well-Being
Crimson Publishers-The Role of Financial Stress in Old Age well-Being
 
SOA Case Challenge Indiana University (1)
SOA Case Challenge Indiana University (1)SOA Case Challenge Indiana University (1)
SOA Case Challenge Indiana University (1)
 
A realist synthesis to develop an explanatory model of how policy instruments...
A realist synthesis to develop an explanatory model of how policy instruments...A realist synthesis to develop an explanatory model of how policy instruments...
A realist synthesis to develop an explanatory model of how policy instruments...
 
Kids And Old Age: Taking the long view of children's health and well-being
Kids And Old Age: Taking the long view of children's health and well-beingKids And Old Age: Taking the long view of children's health and well-being
Kids And Old Age: Taking the long view of children's health and well-being
 
Sexual Risk Behaviors Research
Sexual Risk Behaviors Research Sexual Risk Behaviors Research
Sexual Risk Behaviors Research
 
Assessment of communication messages used in adolescent
Assessment of communication messages used in adolescentAssessment of communication messages used in adolescent
Assessment of communication messages used in adolescent
 
HLT 362V Grand Canyon University Wk5 Epidemiology Discussion Responses.docx
HLT 362V Grand Canyon University Wk5 Epidemiology Discussion Responses.docxHLT 362V Grand Canyon University Wk5 Epidemiology Discussion Responses.docx
HLT 362V Grand Canyon University Wk5 Epidemiology Discussion Responses.docx
 
Running head ASSIGNMENT 3 1ASSIGNMENT 3 4
Running head ASSIGNMENT 3 1ASSIGNMENT 3 4Running head ASSIGNMENT 3 1ASSIGNMENT 3 4
Running head ASSIGNMENT 3 1ASSIGNMENT 3 4
 
Ageism, Healthy Life Expectancy and Population.pdf
Ageism, Healthy Life Expectancy and Population.pdfAgeism, Healthy Life Expectancy and Population.pdf
Ageism, Healthy Life Expectancy and Population.pdf
 
Vaccination
VaccinationVaccination
Vaccination
 
[[INOSR ES 11(2)134-147 Evaluation of the Infant Mortality rate at Ishaka Adv...
[[INOSR ES 11(2)134-147 Evaluation of the Infant Mortality rate at Ishaka Adv...[[INOSR ES 11(2)134-147 Evaluation of the Infant Mortality rate at Ishaka Adv...
[[INOSR ES 11(2)134-147 Evaluation of the Infant Mortality rate at Ishaka Adv...
 
Relation between Changing Lifestyle and Adolescent Obesity in India: A Commun...
Relation between Changing Lifestyle and Adolescent Obesity in India: A Commun...Relation between Changing Lifestyle and Adolescent Obesity in India: A Commun...
Relation between Changing Lifestyle and Adolescent Obesity in India: A Commun...
 
Screening Tool for Developmental Disorders in Children
Screening Tool for Developmental Disorders in ChildrenScreening Tool for Developmental Disorders in Children
Screening Tool for Developmental Disorders in Children
 
Future of Health
Future of HealthFuture of Health
Future of Health
 

More from Paul Coelho, MD

Suicidality Poster References.docx
Suicidality Poster References.docxSuicidality Poster References.docx
Suicidality Poster References.docxPaul Coelho, MD
 
Opioid Milli-equivalence Conversion Factors CDC
Opioid Milli-equivalence Conversion Factors CDCOpioid Milli-equivalence Conversion Factors CDC
Opioid Milli-equivalence Conversion Factors CDCPaul Coelho, MD
 
Labeling Woefulness: The Social Construction of Fibromyalgia
Labeling Woefulness: The Social Construction of FibromyalgiaLabeling Woefulness: The Social Construction of Fibromyalgia
Labeling Woefulness: The Social Construction of FibromyalgiaPaul Coelho, MD
 
Outcomes in Long-term Opioid Tapering and Buprenorphine Transition: A Retrosp...
Outcomes in Long-term Opioid Tapering and Buprenorphine Transition: A Retrosp...Outcomes in Long-term Opioid Tapering and Buprenorphine Transition: A Retrosp...
Outcomes in Long-term Opioid Tapering and Buprenorphine Transition: A Retrosp...Paul Coelho, MD
 
Pain Phenotyping Tool For Primary Care
Pain Phenotyping Tool For Primary CarePain Phenotyping Tool For Primary Care
Pain Phenotyping Tool For Primary CarePaul Coelho, MD
 
Fibromyalgia & Somatic Symptom Disorder Patient Handout
Fibromyalgia & Somatic Symptom Disorder Patient HandoutFibromyalgia & Somatic Symptom Disorder Patient Handout
Fibromyalgia & Somatic Symptom Disorder Patient HandoutPaul Coelho, MD
 
Community Catastrophizing
Community CatastrophizingCommunity Catastrophizing
Community CatastrophizingPaul Coelho, MD
 
Risk-Benefit High-Dose LTOT
Risk-Benefit High-Dose LTOTRisk-Benefit High-Dose LTOT
Risk-Benefit High-Dose LTOTPaul Coelho, MD
 
Mortality quadrupled among opioid-driven hospitalizations notably within lowe...
Mortality quadrupled among opioid-driven hospitalizations notably within lowe...Mortality quadrupled among opioid-driven hospitalizations notably within lowe...
Mortality quadrupled among opioid-driven hospitalizations notably within lowe...Paul Coelho, MD
 
Prescriptions filled following an opioid-related hospitalization.
Prescriptions filled following an opioid-related hospitalization.Prescriptions filled following an opioid-related hospitalization.
Prescriptions filled following an opioid-related hospitalization.Paul Coelho, MD
 
Jamapsychiatry santavirta 2017_oi_170084
Jamapsychiatry santavirta 2017_oi_170084Jamapsychiatry santavirta 2017_oi_170084
Jamapsychiatry santavirta 2017_oi_170084Paul Coelho, MD
 
Correlation of opioid mortality with prescriptions and social determinants -a...
Correlation of opioid mortality with prescriptions and social determinants -a...Correlation of opioid mortality with prescriptions and social determinants -a...
Correlation of opioid mortality with prescriptions and social determinants -a...Paul Coelho, MD
 
Gao recommendations to CMS
Gao recommendations to CMSGao recommendations to CMS
Gao recommendations to CMSPaul Coelho, MD
 
Prescribing by specialty
Prescribing by specialtyPrescribing by specialty
Prescribing by specialtyPaul Coelho, MD
 
The place-of-antipsychotics-in-the-therapy-of-anxiety-disorders-and-obsessive...
The place-of-antipsychotics-in-the-therapy-of-anxiety-disorders-and-obsessive...The place-of-antipsychotics-in-the-therapy-of-anxiety-disorders-and-obsessive...
The place-of-antipsychotics-in-the-therapy-of-anxiety-disorders-and-obsessive...Paul Coelho, MD
 
Structured opioid refill clinic epic smartphrases
Structured opioid refill clinic epic smartphrases Structured opioid refill clinic epic smartphrases
Structured opioid refill clinic epic smartphrases Paul Coelho, MD
 
Opioids for the Treatment of Chronic Pain: Mistakes Made, Lessons Learned, an...
Opioids for the Treatment of Chronic Pain: Mistakes Made, Lessons Learned, an...Opioids for the Treatment of Chronic Pain: Mistakes Made, Lessons Learned, an...
Opioids for the Treatment of Chronic Pain: Mistakes Made, Lessons Learned, an...Paul Coelho, MD
 
The potential adverse influence of physicians’ words.
The potential adverse influence of physicians’ words.The potential adverse influence of physicians’ words.
The potential adverse influence of physicians’ words.Paul Coelho, MD
 
Ctaf chronic pain__evidence_report_100417
Ctaf chronic pain__evidence_report_100417Ctaf chronic pain__evidence_report_100417
Ctaf chronic pain__evidence_report_100417Paul Coelho, MD
 

More from Paul Coelho, MD (20)

Suicidality Poster References.docx
Suicidality Poster References.docxSuicidality Poster References.docx
Suicidality Poster References.docx
 
Opioid Milli-equivalence Conversion Factors CDC
Opioid Milli-equivalence Conversion Factors CDCOpioid Milli-equivalence Conversion Factors CDC
Opioid Milli-equivalence Conversion Factors CDC
 
Labeling Woefulness: The Social Construction of Fibromyalgia
Labeling Woefulness: The Social Construction of FibromyalgiaLabeling Woefulness: The Social Construction of Fibromyalgia
Labeling Woefulness: The Social Construction of Fibromyalgia
 
Outcomes in Long-term Opioid Tapering and Buprenorphine Transition: A Retrosp...
Outcomes in Long-term Opioid Tapering and Buprenorphine Transition: A Retrosp...Outcomes in Long-term Opioid Tapering and Buprenorphine Transition: A Retrosp...
Outcomes in Long-term Opioid Tapering and Buprenorphine Transition: A Retrosp...
 
Pain Phenotyping Tool For Primary Care
Pain Phenotyping Tool For Primary CarePain Phenotyping Tool For Primary Care
Pain Phenotyping Tool For Primary Care
 
Fibromyalgia & Somatic Symptom Disorder Patient Handout
Fibromyalgia & Somatic Symptom Disorder Patient HandoutFibromyalgia & Somatic Symptom Disorder Patient Handout
Fibromyalgia & Somatic Symptom Disorder Patient Handout
 
Community Catastrophizing
Community CatastrophizingCommunity Catastrophizing
Community Catastrophizing
 
Risk-Benefit High-Dose LTOT
Risk-Benefit High-Dose LTOTRisk-Benefit High-Dose LTOT
Risk-Benefit High-Dose LTOT
 
Space Trial
Space TrialSpace Trial
Space Trial
 
Mortality quadrupled among opioid-driven hospitalizations notably within lowe...
Mortality quadrupled among opioid-driven hospitalizations notably within lowe...Mortality quadrupled among opioid-driven hospitalizations notably within lowe...
Mortality quadrupled among opioid-driven hospitalizations notably within lowe...
 
Prescriptions filled following an opioid-related hospitalization.
Prescriptions filled following an opioid-related hospitalization.Prescriptions filled following an opioid-related hospitalization.
Prescriptions filled following an opioid-related hospitalization.
 
Jamapsychiatry santavirta 2017_oi_170084
Jamapsychiatry santavirta 2017_oi_170084Jamapsychiatry santavirta 2017_oi_170084
Jamapsychiatry santavirta 2017_oi_170084
 
Correlation of opioid mortality with prescriptions and social determinants -a...
Correlation of opioid mortality with prescriptions and social determinants -a...Correlation of opioid mortality with prescriptions and social determinants -a...
Correlation of opioid mortality with prescriptions and social determinants -a...
 
Gao recommendations to CMS
Gao recommendations to CMSGao recommendations to CMS
Gao recommendations to CMS
 
Prescribing by specialty
Prescribing by specialtyPrescribing by specialty
Prescribing by specialty
 
The place-of-antipsychotics-in-the-therapy-of-anxiety-disorders-and-obsessive...
The place-of-antipsychotics-in-the-therapy-of-anxiety-disorders-and-obsessive...The place-of-antipsychotics-in-the-therapy-of-anxiety-disorders-and-obsessive...
The place-of-antipsychotics-in-the-therapy-of-anxiety-disorders-and-obsessive...
 
Structured opioid refill clinic epic smartphrases
Structured opioid refill clinic epic smartphrases Structured opioid refill clinic epic smartphrases
Structured opioid refill clinic epic smartphrases
 
Opioids for the Treatment of Chronic Pain: Mistakes Made, Lessons Learned, an...
Opioids for the Treatment of Chronic Pain: Mistakes Made, Lessons Learned, an...Opioids for the Treatment of Chronic Pain: Mistakes Made, Lessons Learned, an...
Opioids for the Treatment of Chronic Pain: Mistakes Made, Lessons Learned, an...
 
The potential adverse influence of physicians’ words.
The potential adverse influence of physicians’ words.The potential adverse influence of physicians’ words.
The potential adverse influence of physicians’ words.
 
Ctaf chronic pain__evidence_report_100417
Ctaf chronic pain__evidence_report_100417Ctaf chronic pain__evidence_report_100417
Ctaf chronic pain__evidence_report_100417
 

Recently uploaded

Bangalore Call Girls Nelamangala Number 7001035870 Meetin With Bangalore Esc...
Bangalore Call Girls Nelamangala Number 7001035870  Meetin With Bangalore Esc...Bangalore Call Girls Nelamangala Number 7001035870  Meetin With Bangalore Esc...
Bangalore Call Girls Nelamangala Number 7001035870 Meetin With Bangalore Esc...narwatsonia7
 
Russian Escorts Girls Nehru Place ZINATHI 🔝9711199012 ☪ 24/7 Call Girls Delhi
Russian Escorts Girls  Nehru Place ZINATHI 🔝9711199012 ☪ 24/7 Call Girls DelhiRussian Escorts Girls  Nehru Place ZINATHI 🔝9711199012 ☪ 24/7 Call Girls Delhi
Russian Escorts Girls Nehru Place ZINATHI 🔝9711199012 ☪ 24/7 Call Girls DelhiAlinaDevecerski
 
Bangalore Call Girls Hebbal Kempapura Number 7001035870 Meetin With Bangalor...
Bangalore Call Girls Hebbal Kempapura Number 7001035870  Meetin With Bangalor...Bangalore Call Girls Hebbal Kempapura Number 7001035870  Meetin With Bangalor...
Bangalore Call Girls Hebbal Kempapura Number 7001035870 Meetin With Bangalor...narwatsonia7
 
Russian Call Girls in Pune Riya 9907093804 Short 1500 Night 6000 Best call gi...
Russian Call Girls in Pune Riya 9907093804 Short 1500 Night 6000 Best call gi...Russian Call Girls in Pune Riya 9907093804 Short 1500 Night 6000 Best call gi...
Russian Call Girls in Pune Riya 9907093804 Short 1500 Night 6000 Best call gi...Miss joya
 
Call Girls Service Chennai Jiya 7001305949 Independent Escort Service Chennai
Call Girls Service Chennai Jiya 7001305949 Independent Escort Service ChennaiCall Girls Service Chennai Jiya 7001305949 Independent Escort Service Chennai
Call Girls Service Chennai Jiya 7001305949 Independent Escort Service ChennaiNehru place Escorts
 
Low Rate Call Girls Pune Esha 9907093804 Short 1500 Night 6000 Best call girl...
Low Rate Call Girls Pune Esha 9907093804 Short 1500 Night 6000 Best call girl...Low Rate Call Girls Pune Esha 9907093804 Short 1500 Night 6000 Best call girl...
Low Rate Call Girls Pune Esha 9907093804 Short 1500 Night 6000 Best call girl...Miss joya
 
Best Rate (Hyderabad) Call Girls Jahanuma ⟟ 8250192130 ⟟ High Class Call Girl...
Best Rate (Hyderabad) Call Girls Jahanuma ⟟ 8250192130 ⟟ High Class Call Girl...Best Rate (Hyderabad) Call Girls Jahanuma ⟟ 8250192130 ⟟ High Class Call Girl...
Best Rate (Hyderabad) Call Girls Jahanuma ⟟ 8250192130 ⟟ High Class Call Girl...astropune
 
Russian Call Girls in Bangalore Manisha 7001305949 Independent Escort Service...
Russian Call Girls in Bangalore Manisha 7001305949 Independent Escort Service...Russian Call Girls in Bangalore Manisha 7001305949 Independent Escort Service...
Russian Call Girls in Bangalore Manisha 7001305949 Independent Escort Service...narwatsonia7
 
Bangalore Call Girls Majestic 📞 9907093804 High Profile Service 100% Safe
Bangalore Call Girls Majestic 📞 9907093804 High Profile Service 100% SafeBangalore Call Girls Majestic 📞 9907093804 High Profile Service 100% Safe
Bangalore Call Girls Majestic 📞 9907093804 High Profile Service 100% Safenarwatsonia7
 
Call Girls Service Pune Vaishnavi 9907093804 Short 1500 Night 6000 Best call ...
Call Girls Service Pune Vaishnavi 9907093804 Short 1500 Night 6000 Best call ...Call Girls Service Pune Vaishnavi 9907093804 Short 1500 Night 6000 Best call ...
Call Girls Service Pune Vaishnavi 9907093804 Short 1500 Night 6000 Best call ...Miss joya
 
VIP Call Girls Pune Vrinda 9907093804 Short 1500 Night 6000 Best call girls S...
VIP Call Girls Pune Vrinda 9907093804 Short 1500 Night 6000 Best call girls S...VIP Call Girls Pune Vrinda 9907093804 Short 1500 Night 6000 Best call girls S...
VIP Call Girls Pune Vrinda 9907093804 Short 1500 Night 6000 Best call girls S...Miss joya
 
(👑VVIP ISHAAN ) Russian Call Girls Service Navi Mumbai🖕9920874524🖕Independent...
(👑VVIP ISHAAN ) Russian Call Girls Service Navi Mumbai🖕9920874524🖕Independent...(👑VVIP ISHAAN ) Russian Call Girls Service Navi Mumbai🖕9920874524🖕Independent...
(👑VVIP ISHAAN ) Russian Call Girls Service Navi Mumbai🖕9920874524🖕Independent...Taniya Sharma
 
Call Girls Near Hotel Marine Plaza ✔ 9820252231 ✔For 18+ VIP Call Girl At The...
Call Girls Near Hotel Marine Plaza ✔ 9820252231 ✔For 18+ VIP Call Girl At The...Call Girls Near Hotel Marine Plaza ✔ 9820252231 ✔For 18+ VIP Call Girl At The...
Call Girls Near Hotel Marine Plaza ✔ 9820252231 ✔For 18+ VIP Call Girl At The...call girls in ahmedabad high profile
 
Call Girls Service In Shyam Nagar Whatsapp 8445551418 Independent Escort Service
Call Girls Service In Shyam Nagar Whatsapp 8445551418 Independent Escort ServiceCall Girls Service In Shyam Nagar Whatsapp 8445551418 Independent Escort Service
Call Girls Service In Shyam Nagar Whatsapp 8445551418 Independent Escort Serviceparulsinha
 
(Rocky) Jaipur Call Girl - 9001626015 Escorts Service 50% Off with Cash ON De...
(Rocky) Jaipur Call Girl - 9001626015 Escorts Service 50% Off with Cash ON De...(Rocky) Jaipur Call Girl - 9001626015 Escorts Service 50% Off with Cash ON De...
(Rocky) Jaipur Call Girl - 9001626015 Escorts Service 50% Off with Cash ON De...indiancallgirl4rent
 
Bangalore Call Girls Marathahalli 📞 9907093804 High Profile Service 100% Safe
Bangalore Call Girls Marathahalli 📞 9907093804 High Profile Service 100% SafeBangalore Call Girls Marathahalli 📞 9907093804 High Profile Service 100% Safe
Bangalore Call Girls Marathahalli 📞 9907093804 High Profile Service 100% Safenarwatsonia7
 
Call Girls Service Navi Mumbai Samaira 8617697112 Independent Escort Service ...
Call Girls Service Navi Mumbai Samaira 8617697112 Independent Escort Service ...Call Girls Service Navi Mumbai Samaira 8617697112 Independent Escort Service ...
Call Girls Service Navi Mumbai Samaira 8617697112 Independent Escort Service ...Call girls in Ahmedabad High profile
 
Call Girls Service Bellary Road Just Call 7001305949 Enjoy College Girls Service
Call Girls Service Bellary Road Just Call 7001305949 Enjoy College Girls ServiceCall Girls Service Bellary Road Just Call 7001305949 Enjoy College Girls Service
Call Girls Service Bellary Road Just Call 7001305949 Enjoy College Girls Servicenarwatsonia7
 
CALL ON ➥9907093804 🔝 Call Girls Hadapsar ( Pune) Girls Service
CALL ON ➥9907093804 🔝 Call Girls Hadapsar ( Pune)  Girls ServiceCALL ON ➥9907093804 🔝 Call Girls Hadapsar ( Pune)  Girls Service
CALL ON ➥9907093804 🔝 Call Girls Hadapsar ( Pune) Girls ServiceMiss joya
 
💎VVIP Kolkata Call Girls Parganas🩱7001035870🩱Independent Girl ( Ac Rooms Avai...
💎VVIP Kolkata Call Girls Parganas🩱7001035870🩱Independent Girl ( Ac Rooms Avai...💎VVIP Kolkata Call Girls Parganas🩱7001035870🩱Independent Girl ( Ac Rooms Avai...
💎VVIP Kolkata Call Girls Parganas🩱7001035870🩱Independent Girl ( Ac Rooms Avai...Taniya Sharma
 

Recently uploaded (20)

Bangalore Call Girls Nelamangala Number 7001035870 Meetin With Bangalore Esc...
Bangalore Call Girls Nelamangala Number 7001035870  Meetin With Bangalore Esc...Bangalore Call Girls Nelamangala Number 7001035870  Meetin With Bangalore Esc...
Bangalore Call Girls Nelamangala Number 7001035870 Meetin With Bangalore Esc...
 
Russian Escorts Girls Nehru Place ZINATHI 🔝9711199012 ☪ 24/7 Call Girls Delhi
Russian Escorts Girls  Nehru Place ZINATHI 🔝9711199012 ☪ 24/7 Call Girls DelhiRussian Escorts Girls  Nehru Place ZINATHI 🔝9711199012 ☪ 24/7 Call Girls Delhi
Russian Escorts Girls Nehru Place ZINATHI 🔝9711199012 ☪ 24/7 Call Girls Delhi
 
Bangalore Call Girls Hebbal Kempapura Number 7001035870 Meetin With Bangalor...
Bangalore Call Girls Hebbal Kempapura Number 7001035870  Meetin With Bangalor...Bangalore Call Girls Hebbal Kempapura Number 7001035870  Meetin With Bangalor...
Bangalore Call Girls Hebbal Kempapura Number 7001035870 Meetin With Bangalor...
 
Russian Call Girls in Pune Riya 9907093804 Short 1500 Night 6000 Best call gi...
Russian Call Girls in Pune Riya 9907093804 Short 1500 Night 6000 Best call gi...Russian Call Girls in Pune Riya 9907093804 Short 1500 Night 6000 Best call gi...
Russian Call Girls in Pune Riya 9907093804 Short 1500 Night 6000 Best call gi...
 
Call Girls Service Chennai Jiya 7001305949 Independent Escort Service Chennai
Call Girls Service Chennai Jiya 7001305949 Independent Escort Service ChennaiCall Girls Service Chennai Jiya 7001305949 Independent Escort Service Chennai
Call Girls Service Chennai Jiya 7001305949 Independent Escort Service Chennai
 
Low Rate Call Girls Pune Esha 9907093804 Short 1500 Night 6000 Best call girl...
Low Rate Call Girls Pune Esha 9907093804 Short 1500 Night 6000 Best call girl...Low Rate Call Girls Pune Esha 9907093804 Short 1500 Night 6000 Best call girl...
Low Rate Call Girls Pune Esha 9907093804 Short 1500 Night 6000 Best call girl...
 
Best Rate (Hyderabad) Call Girls Jahanuma ⟟ 8250192130 ⟟ High Class Call Girl...
Best Rate (Hyderabad) Call Girls Jahanuma ⟟ 8250192130 ⟟ High Class Call Girl...Best Rate (Hyderabad) Call Girls Jahanuma ⟟ 8250192130 ⟟ High Class Call Girl...
Best Rate (Hyderabad) Call Girls Jahanuma ⟟ 8250192130 ⟟ High Class Call Girl...
 
Russian Call Girls in Bangalore Manisha 7001305949 Independent Escort Service...
Russian Call Girls in Bangalore Manisha 7001305949 Independent Escort Service...Russian Call Girls in Bangalore Manisha 7001305949 Independent Escort Service...
Russian Call Girls in Bangalore Manisha 7001305949 Independent Escort Service...
 
Bangalore Call Girls Majestic 📞 9907093804 High Profile Service 100% Safe
Bangalore Call Girls Majestic 📞 9907093804 High Profile Service 100% SafeBangalore Call Girls Majestic 📞 9907093804 High Profile Service 100% Safe
Bangalore Call Girls Majestic 📞 9907093804 High Profile Service 100% Safe
 
Call Girls Service Pune Vaishnavi 9907093804 Short 1500 Night 6000 Best call ...
Call Girls Service Pune Vaishnavi 9907093804 Short 1500 Night 6000 Best call ...Call Girls Service Pune Vaishnavi 9907093804 Short 1500 Night 6000 Best call ...
Call Girls Service Pune Vaishnavi 9907093804 Short 1500 Night 6000 Best call ...
 
VIP Call Girls Pune Vrinda 9907093804 Short 1500 Night 6000 Best call girls S...
VIP Call Girls Pune Vrinda 9907093804 Short 1500 Night 6000 Best call girls S...VIP Call Girls Pune Vrinda 9907093804 Short 1500 Night 6000 Best call girls S...
VIP Call Girls Pune Vrinda 9907093804 Short 1500 Night 6000 Best call girls S...
 
(👑VVIP ISHAAN ) Russian Call Girls Service Navi Mumbai🖕9920874524🖕Independent...
(👑VVIP ISHAAN ) Russian Call Girls Service Navi Mumbai🖕9920874524🖕Independent...(👑VVIP ISHAAN ) Russian Call Girls Service Navi Mumbai🖕9920874524🖕Independent...
(👑VVIP ISHAAN ) Russian Call Girls Service Navi Mumbai🖕9920874524🖕Independent...
 
Call Girls Near Hotel Marine Plaza ✔ 9820252231 ✔For 18+ VIP Call Girl At The...
Call Girls Near Hotel Marine Plaza ✔ 9820252231 ✔For 18+ VIP Call Girl At The...Call Girls Near Hotel Marine Plaza ✔ 9820252231 ✔For 18+ VIP Call Girl At The...
Call Girls Near Hotel Marine Plaza ✔ 9820252231 ✔For 18+ VIP Call Girl At The...
 
Call Girls Service In Shyam Nagar Whatsapp 8445551418 Independent Escort Service
Call Girls Service In Shyam Nagar Whatsapp 8445551418 Independent Escort ServiceCall Girls Service In Shyam Nagar Whatsapp 8445551418 Independent Escort Service
Call Girls Service In Shyam Nagar Whatsapp 8445551418 Independent Escort Service
 
(Rocky) Jaipur Call Girl - 9001626015 Escorts Service 50% Off with Cash ON De...
(Rocky) Jaipur Call Girl - 9001626015 Escorts Service 50% Off with Cash ON De...(Rocky) Jaipur Call Girl - 9001626015 Escorts Service 50% Off with Cash ON De...
(Rocky) Jaipur Call Girl - 9001626015 Escorts Service 50% Off with Cash ON De...
 
Bangalore Call Girls Marathahalli 📞 9907093804 High Profile Service 100% Safe
Bangalore Call Girls Marathahalli 📞 9907093804 High Profile Service 100% SafeBangalore Call Girls Marathahalli 📞 9907093804 High Profile Service 100% Safe
Bangalore Call Girls Marathahalli 📞 9907093804 High Profile Service 100% Safe
 
Call Girls Service Navi Mumbai Samaira 8617697112 Independent Escort Service ...
Call Girls Service Navi Mumbai Samaira 8617697112 Independent Escort Service ...Call Girls Service Navi Mumbai Samaira 8617697112 Independent Escort Service ...
Call Girls Service Navi Mumbai Samaira 8617697112 Independent Escort Service ...
 
Call Girls Service Bellary Road Just Call 7001305949 Enjoy College Girls Service
Call Girls Service Bellary Road Just Call 7001305949 Enjoy College Girls ServiceCall Girls Service Bellary Road Just Call 7001305949 Enjoy College Girls Service
Call Girls Service Bellary Road Just Call 7001305949 Enjoy College Girls Service
 
CALL ON ➥9907093804 🔝 Call Girls Hadapsar ( Pune) Girls Service
CALL ON ➥9907093804 🔝 Call Girls Hadapsar ( Pune)  Girls ServiceCALL ON ➥9907093804 🔝 Call Girls Hadapsar ( Pune)  Girls Service
CALL ON ➥9907093804 🔝 Call Girls Hadapsar ( Pune) Girls Service
 
💎VVIP Kolkata Call Girls Parganas🩱7001035870🩱Independent Girl ( Ac Rooms Avai...
💎VVIP Kolkata Call Girls Parganas🩱7001035870🩱Independent Girl ( Ac Rooms Avai...💎VVIP Kolkata Call Girls Parganas🩱7001035870🩱Independent Girl ( Ac Rooms Avai...
💎VVIP Kolkata Call Girls Parganas🩱7001035870🩱Independent Girl ( Ac Rooms Avai...
 

Childhood forecasting

  • 1. NATURE HUMAN BEHAVIOUR 1, 0005 (2016) | DOI: 10.1038/s41562-016-0005 | www.nature.com/nathumbehav 1 ARTICLES PUBLISHED: 12 DECEMBER 2016 | VOLUME: 1 | ARTICLE NUMBER: 0005 Childhood forecasting of a small segment of the population with large economic burden Avshalom Caspi1, ​2, ​3, ​4 *, Renate M. Houts1 , Daniel W. Belsky5, ​6 , Honalee Harrington1 , Sean Hogan7 , Sandhya Ramrakha7 , Richie Poulton7 and Terrie E. Moffitt1, ​2, ​3, ​4 Policymakersareinterestedinearly-yearsinterventionstoamelioratechildhoodrisks.Theyhopeforimprovedadultoutcomesin the long run that bring a return on investment. The size of the return that can be expected partly depends on how strongly child- hood risks forecast adult outcomes, but there is disagreement about whether childhood determines adulthood. We integrated multiple nationwide administrative databases and electronic medical records with the four-decade-long Dunedin birth cohort study to test child-to-adult prediction in a different way, using a population-segmentation approach. A segment comprising 22% of the cohort accounted for 36% of the cohort’s injury insurance claims; 40% of excess obese kilograms; 54% of cigarettes smoked; 57% of hospital nights; 66% of welfare benefits; 77% of fatherless child-rearing; 78% of prescription fills; and 81% of criminal convictions. Childhood risks, including poor brain health at three years of age, predicted this segment with large effect sizes. Early-years interventions that are effective for this population segment could yield very large returns on investment. A round the world, the population is ageing and total fertil- ity rates are declining. As a result, nations increasingly view children and young people as valuable resources for the economic and social well-being of whole societies. This view is accompanied by public-policy interest in early interventions to help as many children as possible achieve their full potential. Akeyquestionconcernsthepotentialsizeoftheimpactthatmightbe brought about by interventions in the early years of children’s lives1,2 . Research teams that have followed up on small samples of children who were enrolled in intervention experiments carried out decades ago point to reductions in school leaving, unemployment, crime, obesity and even blood pressure3–6 . Some argue that today’s better- designed interventions might achieve greater reductions in adult problems than previous efforts7 (see also www.nuffieldfoundation. org, www.blueprintsprograms.com, http://ies.ed.gov/ncee/wwc and http://incredibleyears.com). Others assert that interventions for the youngest children will bring an even greater return on investment compared with interventions that begin when children are older8 . However, a skeptic could point out that return on investment for society will depend not only on an intervention’s capacity to ame- liorate childhood risks, but also on how relevant those risks are for downstream adult functioning in the general population. Thus, to a large extent, the question of how much early-years intervention can lift health and social well-being and reduce costs depends on how strongly early-years risk factors are tied to adult outcomes in the population. Our own research and that of others suggests that while childhood risk factors do predict adult outcomes with statistical significance, the effect sizes are typically modest9–11 . The interpreta- tion of these modest child-to-adult effect sizes is polarizing, and has sown confusion among scientists, policy makers and the public12–14 . On the one hand, claims are made that the ‘child is father of the man’, because continuity from childhood risks to adult outcomes is stronger than expected, given the long duration of follow-up. On the other hand, on the basis of the same data, warnings are issued about the myth of early-childhood determinism and about unwarranted overemphasis on childhood. Here, we tackled the prediction question anew in the context of the Dunedin Longitudinal Study, a population-representative 1972–1973 birth cohort of 1,037 New Zealanders assessed at ages 3, 5, 7, 9, 11, 13, 15, 18, 21, 26, 32 and 38 years and followed from birth to midlife with 95% retention (Supplementary Information). We first integrated our longitudinal survey data and clinical data with multiple nationwide government administrative databases and elec- tronic medical records. Then, using a novel segmentation approach, we tested the hypothesis that a small segment of the adult popula- tion accounts for a large cumulative economic burden and that this segment can be predicted with good accuracy from early childhood. Results Throughout the cohort’s childhood, during the first decade of life, we measured risk factors that are thought to augur poor adult out- comes: growing up in a socioeconomically deprived family, expo- sure to maltreatment, low IQ and poor self-control. We report these four risk factors here because they are proven predictors of adult health and social outcomes and are high-priority targets in many early-years intervention programmes15–17 . A strength of this analysis is that all childhood risk predictors were measured prospectively, unbiased by participants’ knowledge of their adult outcomes. At the most recent follow-up assessment when the cohort reached 38 years of age, roughly the midpoint in the human lifespan, we drew on personal interviews and on New Zealand’s multiple nationwide administrative databases and electronic medical records to ascertain the cumulative distributions of economically burdensome outcomes in eight social and health sectors. These outcomes are referred to here as economically burdensome because, in each instance, these are events, behaviours and conditions that saddle society and 1 Department of Psychology & Neuroscience, Duke University, Durham, North Carolina 27708, USA. 2 Department of Psychiatry & Behavioural Sciences, Duke University School of Medicine, Durham, North Carolina 27708, USA. 3 Center for Genomic and Computational Biology, Duke University, Durham, North Carolina 27708, USA. 4 Social, Genetic, & Developmental Psychiatry Research Centre, Institute of Psychiatry, Psychology, & Neuroscience, King’s College London, London SE5 8AF, UK. 5 Department of Medicine, Duke University School of Medicine, Durham, North Carolina 27708, USA. 6 Social Science Research Institute, Duke University, Durham, North Carolina 27708, USA. 7 Department of Psychology, University of Otago, Dunedin 9016, New Zealand. *e-mail: ac115@duke.edu
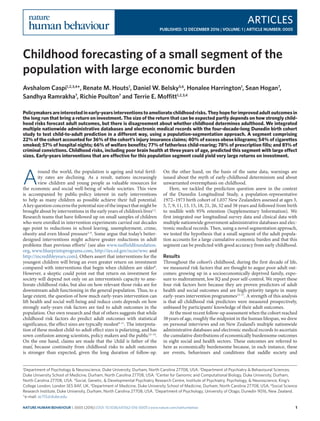
  • 2. 2 NATURE HUMAN BEHAVIOUR 1, 0005 (2016) | DOI: 10.1038/s41562-016-0005 | www.nature.com/nathumbehav ARTICLES NATURE HUMAN BEHAVIOUR d % of total excess obese kilograms (n = 2,924 kg) 20% of cohort members = 98% of total excess obese kilograms Percentage 100 90 80 70 60 50 40 30 20 10 0 % of cohort members c % of total smoking pack years (n = 5,760 pack-years) 20% of cohort members = 68% of total tobacco smoking pack-years Percentage 100 90 80 70 60 50 40 30 20 10 0 % of cohort members b % of cohort members 20% of cohort members = 82% of total fatherless child-years Percentage Max. 0 100 90 80 70 60 50 40 30 20 10 0 % of total fatherless child-years (n = 2,755 child-years) a % of cohort members 100 90 80 70 60 50 40 30 20 10 0 1 2 3 Percentage 20% of cohort members = 80% of total social welfare benefit months Max. 0 Max. 0 Max. 0 Max. 0Max. 0 Max. 0 Max. 0 % of total social welfare benefit months (n = 24,997 months) f % of total prescription drug fills (n = 66,811 fills) 20% of cohort members = 89% of total prescription drug fills % of cohort members Percentage 100 90 80 70 60 50 40 30 20 10 0 e % of cohort members 20% of cohort members = 77% of total hospital-bed nights Percentage 100 90 80 70 60 50 40 30 20 10 0 % of total hospital-bed nights (n = 8,958 nights) h % of cohort members % of total criminal court convictions (n = 2,141 covictions) 20% of cohort members = 97% of total criminal court convictions Percentage 100 90 80 70 60 50 40 30 20 10 0 g % of total injury insurance claims (n = 6,919 claims) % of cohort members 20% of cohort members = 52% of total injury insurance claims Percentage 100 90 80 70 60 50 40 30 20 10 0 Figure 1 | Measuring the concentration of economic-burden outcomes in a birth cohort. The data represent information about 940 people who were born in one hospital in the period 1972–1973 and are lifelong participants in the Dunedin Longitudinal Study. a–h, A minority of individuals is shown to account for a majority of outcomes in a birth cohort for each of eight different social and health sectors: social welfare (a), fatherless children (b), smoking (c), excess obese kilograms (d), hospital stays (e), prescription fills (f), injury claims (g) and crime (h). Each panel displays the cumulative distribution of an outcome in the cohort. To find the proportion of each outcome that 20% of the population accounts for, start at 20% on the vertical axis and follow dashed arrow 1 to the right (to the purple line), then follow arrow 2 up to the blue line, then follow arrow 3 to the left (back to the vertical axis) to read off the corresponding proportion of the total. Each x-axis denotes the count of each respective outcome in its own units (e.g. benefit months, pack-years and so on).
  • 3. NATURE HUMAN BEHAVIOUR 1, 0005 (2016) | DOI: 10.1038/s41562-016-0005 | www.nature.com/nathumbehav 3 ARTICLESNATURE HUMAN BEHAVIOUR government with both direct and indirect costs. These are also the same outcomes that early-years interventions hope to reduce18 . We predicted social welfare dependency, fatherless child-rearing (defined by the absence of the biological father from the households in which a cohort member’s offspring live), tobacco smoking, excess body weight, admissions to taxpayer-funded national-health-service hospitals, taxpayer-funded prescription drug fills, taxpayer-funded insurance claims paid out for accidents and injuries, and convictions for crime (Fig. 1). Analyses tested how strongly childhood risks pre- dicted these economically burdensome outcomes in this cohort. Prospective longitudinal cohort studies have tackled the predic- tion question before19 . Here, we draw attention to two infrequently tried approaches to prediction. Our first fresh approach was to pre- dict the concentration of each economically burdensome behaviour by focusing on its cumulative distribution across the cohort. Typically, prediction has focused on dimensional outcomes, such as the num- ber of crime convictions accrued by a person, or nominal outcomes, such as whether the person is a convicted offender or not. Instead, we noted that most economically burdensome outcomes have a markedly skewed distribution, and accordingly defined our prediction target as the small group of cohort members who could be considered high- cost because they accounted for an excessive amount of an outcome (for example, a few individuals account for the majority of criminal convictions and are thus high-cost users of the criminal justice sec- tor). To define this concentration, we followed the lead of Vilfredo Pareto who, over 100 years ago, observed that 80% of ‘effects’ emanate from 20% of ‘sources’20 . In Pareto’s day, the problem definition was that 20% of families owned 80% of land in Italy. The so-called Pareto Table 1 | Childhood predictors of economic-burden outcomes in a birth cohort. High cost in each sector Univariate models Multivariate models RR RR 95% CI AUC AUC 95% CI RR RR 95% CI AUC AUC 95% CI Social welfare* 0.78 (0.74, 0.82)  Childhood low SES 1.47 (1.28, 1.69) 0.73 (0.69, 0.77) 1.18 (1.02, 1.36)  Child maltreatment 1.47 (1.33, 1.62) 0.74 (0.70, 0.78) 1.31 (1.18, 1.46)  Childhood low IQ 1.50 (1.37, 1.65) 0.73 (0.69, 0.77) 1.19 (1.05, 1.34)  Childhood low self-control 1.51 (1.37, 1.65) 0.75 (0.71, 0.79) 1.24 (1.10, 1.39) Fatherless children 0.67 (0.62, 0.72)  Childhood low SES 1.39 (1.17, 1.65) 0.63 (0.58, 0.68) 1.24 (1.03, 1.49)  Child maltreatment 1.36 (1.19, 1.56) 0.63 (0.58, 0.68) 1.26 (1.09, 1.46)  Childhood low IQ 1.26 (1.09, 1.47) 0.62 (0.56, 0.67) 1.04 (0.86, 1.26)  Childhood low self-control 1.33 (1.18, 1.50) 0.64 (0.59, 0.69) 1.15 (0.99, 1.34) Smoking 0.69 (0.65, 0.74)  Childhood low SES 1.50 (1.30, 1.73) 0.64 (0.60, 0.69) 1.29 (1.11, 1.50)  Child maltreatment 1.34 (1.21, 1.49) 0.61 (0.56, 0.66) 1.20 (1.06, 1.35)  Childhood low IQ 1.36 (1.21, 1.53) 0.64 (0.59, 0.68) 1.08 (0.93, 1.25)  Childhood low self-control 1.43 (1.30, 1.57) 0.65 (0.60, 0.70) 1.21 (1.07, 1.37) Excess weight 0.61 (0.56, 0.65)  Childhood low SES 1.26 (1.11, 1.43) 0.59 (0.55, 0.64) 1.16 (1.00, 1.35)  Child maltreatment 1.13 (1.01, 1.28) 0.56 (0.52, 0.61) 1.09 (0.96, 1.24)  Childhood low IQ 1.24 (1.10, 1.40) 0.58 (0.53, 0.63) 1.14 (0.97, 1.34)  Childhood low self-control 1.18 (1.06, 1.32) 0.57 (0.52, 0.62) 1.04 (0.89, 1.20) Hospital stays* 0.75 (0.71, 0.79)  Childhood low SES 1.35 (1.18, 1.54) 0.74 (0.70, 0.78) 1.23 (1.07, 1.43)  Child maltreatment 1.14 (1.02, 1.29) 0.72 (0.68, 0.76) 1.06 (0.93, 1.20)  Childhood low IQ 1.26 (1.12, 1.43) 0.73 (0.69, 0.77) 1.09 (0.95, 1.26)  Childhood low self-control 1.27 (1.14, 1.42) 0.74 (0.70, 0.77) 1.15 (1.01, 1.32) Prescription fills* 0.75 (0.71, 0.78)  Childhood low SES 1.27 (1.11, 1.44) 0.73 (0.70, 0.77) 1.18 (1.03, 1.37)  Child maltreatment 1.10 (0.98, 1.25) 0.71 (0.67, 0.74) 1.02 (0.89, 1.17)  Childhood low IQ 1.30 (1.16, 1.45) 0.73 (0.70, 0.77) 1.14 (0.99, 1.32)  Childhood low self-control 1.25 (1.12, 1.39) 0.73 (0.70, 0.77) 1.11 (0.98, 1.27) Injury claims* 0.74 (0.71, 0.78)  Childhood low SES 1.18 (1.03, 1.34) 0.74 (0.70, 0.78) 1.19 (1.02, 1.38)  Child maltreatment 1.03 (0.92, 1.16) 0.73 (0.69, 0.77) 0.98 (0.86, 1.12)  Childhood low IQ 1.07 (0.95, 1.20) 0.73 (0.69, 0.77) 0.95 (0.82, 1.10)  Childhood low self-control 1.12 (1.01, 1.24) 0.74 (0.70, 0.78) 1.09 (0.95, 1.24) Crime* 0.77 (0.74, 0.80)  Childhood low SES 1.36 (1.22, 1.52) 0.74 (0.70, 0.77) 1.24 (1.11, 1.39)  Child maltreatment 1.31 (1.20, 1.43) 0.73 (0.70, 0.77) 1.18 (1.07, 1.30)  Childhood low IQ 1.19 (1.08, 1.31) 0.72 (0.68, 0.76) 0.93 (0.83, 1.04)  Childhood low self-control 1.35 (1.25, 1.46) 0.75 (0.71, 0.79) 1.26 (1.15, 1.38) The Table shows that children who grew up in socioeconomically deprived environments, who experienced child maltreatment, who scored more poorly on childhood IQ tests, and who exhibited less self-control were more likely to belong to a high-cost economic burden group as adults, in each of eight different sectors. Childhood socioeconomic status (SES), IQ and self-control are standardized z-scores (mean (M) =​ 0, s.d. =​ 1); childhood maltreatment is coded as 0 =​ none, 1 =​ probable, 2 =​ definite maltreatment. All models control for sex. The prediction was the same when men and women were analysed separately (see Supplementary Information for details). *Time spent outside New Zealand is added as a covariate in analyses that use New Zealand administrative data. AUC,​ area under the curve; CI,​ confidence interval; RR,​ risk ratio. RRs in bold are statistically significant at P < 0.05.
  • 4. 4 NATURE HUMAN BEHAVIOUR 1, 0005 (2016) | DOI: 10.1038/s41562-016-0005 | www.nature.com/nathumbehav ARTICLES NATURE HUMAN BEHAVIOUR principle is alive and useful today: for example, in software engineer- ing, 20% of the code is said to contain 80% of the errors21 . Here, we measured each outcome variable in units that could be meaning- fully counted (for example, tobacco pack-years, hospital-bed nights, prescription fills, criminal convictions and so on). Such measures allowed us to identify the minority of individuals who accounted for the majority of each economically burdensome outcome. Our second fresh approach was to predict the aggregation of dif- ferent types of economically burdensome behavioural outcomes. Economic analyses of early-years interventions illustrate the advan- tages of estimating the costs associated with multiple outcomes22 . However, typical approaches to prediction in population studies continue to predict only one outcome at a time. We noted that some cohort members appeared to be engaged in economically burden- some behaviour across multiple health and social sectors. This observation suggests that a relatively small population segment may generate a large share of societal costs. If this is true, this group would be a high-value target for prevention. We hypothesized that predicting such aggregated concentrations would yield stronger estimates of prediction from childhood to adulthood than reported in previous research. We analysed aggregation as the second step, after analysing concentration. Adult outcomes were concentrated as anticipated from the Pareto principle (that is, the 80–20 rule). Cumulative distribution functions showed that in each of the eight social and health sec- tors where we collected data, 20% of the individuals consistently accounted for a disproportionate share (close to 80%) of the out- come (Fig. 1). These distributions led us to operationally define a high-cost group in each sector as the 20% of the cohort members who accounted for a disproportionate share in that sector. We observed that members of the high-cost group in every sector could be differentiated from their peers by the same four childhood disadvantages: they tended to have grown up in more socioeco- nomically deprived environments; to have experienced child mal- treatment; to have scored poorly on childhood IQ tests; and to have exhibited low childhood self-control (Table  1). The predictions were fairly uniform across each of the eight different social and health sectors with the exception of injury claims. In addition to being less concentrated within a high-cost group, injury claims were less strongly associated with childhood risk factors. Figure 1 and Table 1 both focus on one sector at a time. However, a heat map (Fig. 2a) showed that high-cost group members in one sector were often significantly more likely to reappear as high-cost in other sectors too, and that the observed distribution of high-cost a Social welfare Fatherless children Smoking Excess weight Hospital stays Prescription fills Injury claims Fatherless children 0.6 Smoking 0.5 0.6 Excess weight 0.1 0.0 0.0 Hospital stays 0.4 0.2 0.2 0.2 Prescription fills 0.5 0.3 0.3 0.2 0.5 Injury claims 0.1 0.3 0.2 0.1 0.1 0.2 Crime 0.5 0.5 0.5 –0.1 0.1 0.2 0.4 0% 10% 20% 30% 40% 50% 60% 70% 80% 90% 100% Expected distribution b Observed distribution None n = 155 1 high-cost group n = 314 2 high-cost groups n = 278 None n = 284 1 high-cost group n = 252 2 high-cost groups n = 197 4 high-cost groups n = 44 5 high-cost groups n = 44 3 high-cost groups n = 72 3 high-cost groups n = 139 4 high-cost groups n = 63 5 high-cost groups, n = 9 6 high-cost groups, n = 1 7,8 high-cost groups, n = 0 7 high-cost groups, n = 9 8 high-cost groups, n = 1 6 high-cost groups, n = 18 Polychoric correlation –0.25 0.00 0.25 0.50 0.75 1.00 Figure 2 | The aggregation of adult economic-burden outcomes. a, The polychoric correlations show that high-cost group members in one sector were significantly more likely to reappear as high cost in other sectors. b, The distribution of high-cost individuals across multiple sectors deviated from the expectation of a random distribution, χ2 (7, n =​ 940) =​ 2103.44, P <​ 0.001, with excesses at the two tails (that is, there are more people than expected who do not belong to any high-cost group and there are more people than expected who belong to multiple high-cost groups). The expected distribution is based on the assumption that the high-cost groups were independent and did not overlap beyond chance. The observed/expected ratios in each of the nine cells are: 1.83, 0.80, 0.71, 0.52, 1.45, 5.09, 16.89, 120.53, 439.47.
  • 5. NATURE HUMAN BEHAVIOUR 1, 0005 (2016) | DOI: 10.1038/s41562-016-0005 | www.nature.com/nathumbehav 5 ARTICLESNATURE HUMAN BEHAVIOUR individuals across multiple sectors deviated from the distribution that would be expected if the high-cost groups were independent, χ2 (7, n =​ 940) =​ 2103.44, P <​ 0.001 (Fig. 2b). The fact that member- ship in one high-cost group is associated with greater likelihood of membership in other high-cost groups re-framed the prediction question: how well could childhood risks predict the number of high-cost groups to which an individual belonged? At a population level, each of the childhood factors was a statisti- cally significant predictor of risk for belonging to more high-cost groups (Table 2). Prediction was the same when men and women were analysed separately (Supplementary Information). However, this population-level analysis did not answer the question of whether childhood factors were useful in predicting the outcome for an individual child23 . We evaluated the accuracy of individual pre­ dictions by applying a receiver operating characteristic (ROC) curve analysis. An ROC curve plots the sensitivity and specificity of prediction at various thresholds and yields a metric indexing predictive accuracy: the area under the curve (AUC)24 . The AUC reflects the probability of correctly classifying any randomly selected pair of cohort members in which one person belongs to a high-cost group and the other does not. It can take on any value between 0.50 (indicating chance prediction) and 1.00 (indicating perfect prediction). Some pundits grade the values as: worthless (0.5–0.6), poor (0.6–0.7), fair (0.7–0.8), good (0.8–0.9) and excellent (0.9–1.0). Behavioural scientists note that AUC values of 0.54, 0.64 and 0.71 correspond to Cohen’s d values of 0.20, 0.50 and 0.80, which are regarded as small, medium and large effects, respec- tively25 . Using the standards of medical research, values approaching 0.8 suggest adequate discrimination for consideration in decision- making about intervention26 . The four childhood risks predicted which cohort members belonged to any particular single high-cost group with poor-to-fair accuracy (Fig. 3a). However, as hypothesized, prediction improved when we turned to predicting who belonged to multiple high- cost groups (Fig. 3b). Individuals who belonged to three or more high-cost outcome groups are hereafter referred to as the multiple- high-cost population segment. The multiple-high-cost segment comprised 22% of the Dunedin cohort (n =​ 207 of 940 cohort mem- bers). Childhood socioeconomic deprivation, maltreatment, low IQ and poor self-control predicted these multiple-high-cost adults ba dc 0.0 0.1 0.2 0.3 0.4 0.5 0.6 0.7 0.8 0.9 1.0 1.0 0.9 0.8 0.7 0.6 0.5 0.4 0.3 0.2 0.1 0.0 Truepositiverate False positive rate — 0 versus 3+ high-cost groups = multiple high-cost group* (AUC = 0.87) — 0 versus 2 high-cost groups* (AUC = 0.73) — 0 versus 1 high-cost group* (AUC = 0.67) Chance guess 0.0 0.1 0.2 0.3 0.4 0.5 0.6 0.7 0.8 0.9 1.0 1.0 0.9 0.8 0.7 0.6 0.5 0.4 0.3 0.2 0.1 0.0 Truepositiverate False positive rate — — Fatherless children (AUC = 0.67) Social welfare* (AUC = 0.78) — Smoking (AUC = 0.69) — Excess weight (AUC = 0.61) — Hospital stays* (AUC = 0.75) — Prescription fills* (AUC = 0.75) — Injury claims* (AUC = 0.74) — Crime* (AUC = 0.77) Chance guess Chance guess Chance guess 0.0 0.1 0.2 0.3 0.4 0.5 0.6 0.7 0.8 0.9 1.0 1.0 0.9 0.8 0.7 0.6 0.5 0.4 0.3 0.2 0.1 0.0 Truepositiverate False positive rate — 0 versus 3+ high-cost groups = multiple high-cost* (AUC=0.87) — — Without fatherless children (AUC = 0.88) Without social welfare* (AUC = 0.86) — Without smoking (AUC = 0.87) — Without excess weight (AUC = 0.88) — Without hospital stays* (AUC = 0.87) — Without prescription fills* (AUC = 0.86) — Without injury claims* (AUC = 0.88) — Without crime* (AUC = 0.87) 0.0 0.1 0.2 0.3 0.4 0.5 0.6 0.7 0.8 0.9 1.0 1.0 0.9 0.8 0.7 0.6 0.5 0.4 0.3 0.2 0.1 0.0 Truepositiverate False positive rate — 0 versus 3+ high-cost groups = multiple high-cost group* (AUC = 0.79) — 0 versus 2 high-cost groups* (AUC = 0.68) — 0 versus 1 high-cost group* (AUC = 0.62) Figure 3 | Predicting the probability of economic-burden outcomes. a–c, We tested the predictive performance of a model that included information about four childhood risk factors. We assessed discrimination (that is, the model’s ability to classify correctly) using the AUC. The diagonal line in each panel indicates random classification. Points above the diagonal represent good (better than random) classification results. a, Childhood factors only modestly predicted which cohort members belonged to any particular single high-cost group. b, Classification improved when predicting who belonged to multiple high-cost groups. c, Results of a leave-one-out analysis documenting that accurate prediction was not simply an artifact of predicting one high-cost group well. d, Reaching back to early childhood, brain health at three years of age predicted which cohort members belonged to multiple high-cost groups. All models controlled for sex. Models in a–c included childhood socioeconomic status (SES), childhood maltreatment, IQ and self- control. *Time spent outside New Zealand is added as a covariate in analyses that use New Zealand administrative data.
  • 6. 6 NATURE HUMAN BEHAVIOUR 1, 0005 (2016) | DOI: 10.1038/s41562-016-0005 | www.nature.com/nathumbehav ARTICLES NATURE HUMAN BEHAVIOUR with considerable accuracy, as indicated by an AUC value of 0.87 (approaching excellent). To answer the question of whether accurate prediction of the multiple-high-cost segment capitalized on the fact that high-cost membership in one particular sector (for example, the crime sector, welfare sector and so on) could be predicted well, sensitivity analyses were undertaken in which each high-cost group was left out one sector at a time, in turn. Results showed that accu- rate prediction was not simply an artifact of predicting well in any one sector (Fig. 3c). Our prediction was based on risk measures (familial socioeco- nomic characteristics, maltreatment, IQ and self-control) that we constructed using repeated measurements collected across the first decade of children’s lives. However, multi-wave risk measure- ment is not a realistic standard that can be achieved by many other studies, nor implemented by policy analysts. Moreover, multi-wave measures from birth to 11 years of age did not address the possible importance of early-childhood interventions that target preschool- ers. As such, we asked: how well could outcomes be predicted from a single brief evaluation of each child, using a standard paediatric assessment during the preschool years? At 3 years of age, each child in the cohort participated in a 45  minute examination that included assessments of neurological soft signs, intelligence, receptive language and motor skills. The exam- iners (having no previous knowledge of the child) then rated each child’s frustration tolerance, resistance, restlessness, impulsivity and lack of persistence in reaching goals. This examination yielded a sum- mary index that we have termed brain health, a global index of the neurocognitive status of three-year-old children27 (Supplementary Information). Variation in brain health at three years of age sig- nificantly predicted economically burdensome outcomes in each sector, except injury claims (Table 3). Moreover, variation in cohort members’ brain health at three years of age predicted with consider- able accuracy which individuals would be members of the multiple- high cost segment 35 years later, with an AUC value of 0.79 (Fig. 3d). Is this multiple-high-cost population segment a priority preven- tion target? They made up only 22% of their age cohort born in one year in one city. However, they left a big footprint on costs of service delivery (Fig. 4a). By age 38 years they used 66% of the birth cohort’s welfare benefits; accounted for 77% of fatherless child- years in the next generation; smoked 54% of the cohort’s tobacco cigarettes; carried 40% of the cohort’s kilograms of excess weight; occupied 57% of their cohort’s hospital-bed nights; filled 78% of all prescriptions; were convicted for 81% of the crimes charged to the cohort; and even made a disproportionate number (36%) of injury claims. In contrast, the data also reveal a substantial segment of the cohort (30%) who did not belong to the high-cost group in any sector. Figure 4b shows that this group has left an unusually small footprint on their society so far. Discussion This research yielded two results. First, the study uncovered a popu- lation segment that featured as high cost across multiple health and social sectors. This illustrates the potential discovery value offered by integrating the data of multiple longitudinal administrative databases and electronic health records. Without such data, this population segment would have remained hidden. Second, by link- ing administrative data with individual-level longitudinal data, the study provides the strongest effect sizes yet, measuring the connec- tion between an at-risk childhood and costly adult outcomes in the population. The prediction was excellent when it relied on multiple risk factors measured during the first decade of children’s lives, and was still good when it relied on information derived from a relatively Table 2 | Childhood predictors of economic-burden outcomes in a birth cohort. Univariate models Multivariate models IRR IRR 95% CI IRR IRR 95% CI (a) Predicting the number of high-cost groups (range 0-8) Number of high-cost groups*  Childhood low SES 1.33 (1.25, 1.42) 1.21 (1.13, 1.29)  Child maltreatment 1.23 (1.17, 1.30) 1.13 (1.07, 1.20)  Childhood low IQ 1.26 (1.18, 1.34) 1.05 (0.98, 1.13)  Childhood low self-control 1.32 (1.25, 1.40) 1.18 (1.11, 1.26) Univariate models Multivariate models RR RR 95% CI AUC AUC 95% CI RR RR 95% CI AUC AUC 95% CI (b) Predicting the multiple-high-cost group 0 versus 1 high-cost group* 0.67 (0.62, 0.72)  Childhood low SES 1.20 (1.08, 1.32) 0.66 (0.61, 0.71) 1.17 (1.06, 1.30)  Child maltreatment 1.12 (1.02, 1.22) 0.64 (0.59, 0.69) 1.08 (0.98, 1.18)  Childhood low IQ 1.07 (0.97, 1.18) 0.62 (0.57, 0.67) 0.97 (0.88, 1.08)  Childhood low self-control 1.16 (1.06, 1.27) 0.65 (0.60, 0.70) 1.10 (0.99, 1.21) 0 versus 2 high-cost groups* 0.73 (0.69, 0.78)  Childhood low SES 1.23 (1.10, 1.37) 0.69 (0.64, 0.74) 1.12 (1.00, 1.26)  Child maltreatment 1.07 (0.96, 1.19) 0.66 (0.61, 0.71) 1.00 (0.89, 1.12)  Childhood low IQ 1.33 (1.20, 1.48) 0.71 (0.67, 0.76) 1.16 (1.01, 1.32)  Childhood low self-control 1.29 (1.19, 1.39) 0.72 (0.68, 0.77) 1.19 (1.07, 1.31) 0 versus 3+​high-cost groups =​ multiple-high-cost* 0.87 (0.84, 0.90)  Childhood low SES 1.49 (1.35, 1.64) 0.83 (0.79, 0.86) 1.31 (1.18, 1.45)  Child maltreatment 1.28 (1.19, 1.37) 0.80 (0.76, 0.84) 1.14 (1.05, 1.23)  Childhood low IQ 1.35 (1.24, 1.47) 0.81 (0.77, 0.85) 1.08 (0.98, 1.20)  Childhood low self-control 1.38 (1.27, 1.49) 0.84 (0.80, 0.87) 1.17 (1.07, 1.29) Section (a) shows that children who grew up in socioeconomically deprived environments, who experienced child maltreatment, who scored more poorly on childhood IQ tests and who exhibited less self- control were more likely to belong to more high-cost economic-burden groups in adulthood (ranging from 0–8). Section (b) shows that these childhood factors differentiated a group of cohort members who became, as adults, members of the multiple-high-cost segment of their society. Incidence rate ratios (IRRs) in bold are statistically significant at P < 0.05. All other details are as for Table 1.
  • 7. NATURE HUMAN BEHAVIOUR 1, 0005 (2016) | DOI: 10.1038/s41562-016-0005 | www.nature.com/nathumbehav 7 ARTICLESNATURE HUMAN BEHAVIOUR brief assessment of brain health when the children were three years old. Given two three-year-old children (one who grew up to belong to multiple high-cost groups and one who grew up to belong to none), the model was able to classify them accurately 80% of the time. If this pattern of findings is replicated elsewhere, it will imply that early-years interventions, if efficient and effective with this population segment, could make very large reductions in economic burden. The amount that this economic burden can be reduced by remains an empirical question at present, but historical interven- tions that have targeted children on the basis of low IQ have proven effective with a good rate of return, giving cause for optimism28 . This research has limitations. First, the results reflect one geo- graphic location and a specific historical period. New Zealand is a useful laboratory because it suffers income inequalities similar to the United States and the United Kingdom (after-tax Gini coef- ficient: NZ =​ 0.33, UK =​ 0.35, US =​ 0.39)29 , spends a comparable amount on health care (NZ =​ 10%, UK =​ 9%, US =​ 17% of GDP)30 , has a national health care system and has a generous social safety net. Nevertheless, geographical and generational variations require investigation. Second, using 20% to identify a vital proportion of the population may seem arbitrary, but rather than choosing a sample-specific operant, we chose the Pareto principle a priori as a useful rule-of-thumb because it is familiar to researchers, policy- makers and the public. Third, the data were right-hand censored at age 38 years, and we could not test how well early-childhood risks predict economically burdensome outcomes across the full life course. This is an important question because the health-care bur- den of developed societies concentrates in older age groups. To the extent that factors such as smoking, excess weight and health prob- lems during midlife foretell health-care burden and social depen- dency, findings here should extend to later life (keeping in mind that midlife smoking, weight problems and health problems also forecast premature mortality). Fourth, we address the strength of prediction only; we did not address the causal mechanisms behind the predictive associations reported here. Whether the risk fac- tors studied here are causal, or whether they mediate other prior causal influences, the finding that economically burdensome adult outcomes are predictable from these early-life factors with moder- ate to strong effects suggests that these risk factors are not unrea- sonable targets for randomized experimental intervention trials. Moreover, many interventions have treated risk factors that are not root causes, and improved outcome nevertheless. Fifth, we are unable to directly compare costs across sectors because we did not monetize outcomes within each sector. Although the multiple-high- cost group is clearly ‘expensive’, we did not convert each of our out- comes (for example, pack-years of smoking, criminal convictions, Table 3 | Variation in children’s brain health at 3 years of age predicted which children belonged to high-cost economic-burden groups 35 years later. RR RR 95% CI AUC AUC 95% CI (a) High cost in each sector Social welfare* 1.38 (1.25, 1.53) 0.73 (0.69, 0.77) Fatherless children 1.22 (1.07, 1.38) 0.61 (0.56, 0.66) Smoking 1.25 (1.12, 1.40) 0.60 (0.55, 0.64) Excess weight 1.15 (1.02, 1.29) 0.56 (0.52, 0.61) Hospital stays* 1.18 (1.05, 1.34) 0.72 (0.68, 0.76) Prescription fills* 1.23 (1.10, 1.38) 0.73 (0.69, 0.76) Injury claims* 1.10 (0.99, 1.23) 0.74 (0.70, 0.77) Crime* 1.19 (1.09, 1.29) 0.72 (0.68, 0.75) (b) Number of groups IRR IRR 95% CI Number of high-cost groups* 1.20 (1.13, 1.27) (c) Multiple-high-cost groups RR RR 95% CI AUC AUC 95% CI 0 versus 1 high-cost group* 1.03 (0.94, 1.14) 0.62 (0.57, 0.67) 0 versus 2 high-cost groups* 1.17 (1.07, 1.28) 0.68 (0.63, 0.73) 0 versus 3+​high-cost groups* 1.26 (1.17, 1.36) 0.79 (0.75, 0.83) Section (a) shows that variation in brain health at 3 years of age predicted who was more likely to belong to a high-cost group in adulthood, in each of eight different sectors. Section (b) shows that brain health at 3 years of age predicted the number of high-cost groups (ranging from 0−8) to which each cohort member belonged. Section (c) shows that brain health at 3 years of age differentiated cohort members who became, as adults, members of the multiple-high-cost segment of their society. All models control for sex. The prediction was the same when men and women were analysed separately (see Supplementary Information for details). *Time spent outside New Zealand is added as a covariate in analyses that use New Zealand administrative data. AUC, area under the curve; CI, confidence interval; IRR, incidence rate ratio; RR, risk ratio. RR’s and IRR’s in bold are statistically significant at P < 0.05. 100 90 80 70 60 50 40 30 20 10 0 Percentage Percentage 22% 66% 77% a b 54% 40% 57% 78% 36% 81% Cohort Socialwelfare Fatherless children Smoking Excessweight Hospitalstays Prescriptionfills Injuryclaims Crime Cohort SocialwelfareFatherless children Smoking Excessweight HospitalstaysPrescriptionfills Injuryclaims Crime 100 90 80 70 60 50 40 30 20 10 0 30% 6% 3% 7% 1% 7% 3% 15% 0% Figure 4 | The big footprint of multiple-high-cost users. a, Costs to society of multiple-high-cost users. Although the multiple-high-cost group made up only 22% of the cohort (n =​ 207), it accounted for a disproportionate share of economic-burden outcomes across all eight health and social sectors that we examined. b, In contrast, a substantial segment of the cohort did not belong to any high-cost group (30%; n =​ 289) and left an unusually light footprint on society.
  • 8. 8 NATURE HUMAN BEHAVIOUR 1, 0005 (2016) | DOI: 10.1038/s41562-016-0005 | www.nature.com/nathumbehav ARTICLES NATURE HUMAN BEHAVIOUR injury insurance claims) to (New Zealand) dollars, for the follow- ing three reasons: monetizing outcomes is informative when evalu- ating return on investment of an intervention of known cost, but we did not study an intervention22 ; monetizing costs is not without assumptions, and estimates are time- and place-specific; compared with New-Zealand-specific monetized estimates the concentration metric reported here will be a more feasible target for replication and extension studies. The concentration metric can be used, for example, to ask whether high-cost groups aggregate to the same extent in different times and places, whether the same risk factors predict a multiple-high-cost group across time and place, and how historical events such as economic recessions or immigration affect high-cost distributions. As a final limitation, we are aware that from a different perspec- tive, the economically burdensome behaviours we have studied can be considered economically generative, or at least neutral. Smokers fuel the tobacco industry; crime provides jobs in policing, courts and corrections; hospital admissions, prescription fills and injury insur- ance claims animate the health care and pharmaceutical industries. Such cost–benefit analyses were beyond our scope. Moreover, it is not we who designated these outcomes as burdensome; rather, we selected them because they are oft-cited long-term targets of early-years intervention policy18,31 . This research revealed a predictable aggregation of different economically burdensome adult outcomes in the same multiple- high-cost segment of the population. This aggregation has impli- cations for methodology, prevention science and human rights. Methodologically, the finding illustrates that social science research on risk prediction can benefit from considering the accumula- tion of outcomes within a lifetime. Social scientists have observed that failure to aggregate information about risk predictors results in small or null effects in prediction32,33 , but the recommendation to aggregate has typically been applied only to predictor variables, such as when studying cumulative disadvantage or adverse child- hood experiences34,35 . We turned this recommendation on its head by showing how aggregating outcome variables, not just predictors, can improve effect sizes in longitudinal prediction research. Such aggregation has been used in medical epidemiology, to index the cumulative deficits associated with ageing36 for example, but it is rarely used in the social and behavioural sciences. Treatment stud- ies, as well as observational studies, can make use of this principle to more comprehensively evaluate impact. Moreover, health, social and justice sectors might benefit from understanding that the bulk of their services are going to the same clients. The finding also has implications for early-years prevention sci- ence2,37–39 . We sought to inform a question that nags at the behav- ioural and social sciences, and that has strategic consequences for national policy on children: how strong is the connection between childhood risk and future costly life-course outcomes? Results reported here suggest that the importance of childhood risks for poor adult outcomes has generally been underestimated. It is not news to service-delivery professionals that some individuals use more than their share of services. What is new is that individuals feature in multiple service sectors and they can be identified as children with reasonable accuracy. The question for intervention science becomes not just ‘what works?’ but ‘what works for this multiple-high-cost population segment of children?’ Finally, the finding has implications for human rights. We aimed to test whether population segmentation could give a more accurate evidence base to clarify the need for early-years intervention. We are aware of the potential for misuse; population segments are often stigmatized and stereotyped. However, the predictions reported here make clear that the most costly adults in our cohort started the race of life from a starting block somewhere behind the rest, and while carrying a heavy handicap in brain health. Such a disadvan- taged citizen is unlikely to be able to cover his or her share of health and social costs, but there is no merit in blaming the victim for economic burden following from childhood disadvantage. Instead, ameliorating the effects of childhood disadvantage is an important aim40,41 and achieving this through early-years support for families and children could benefit all members of a society. Methods A more detailed report of the study design, measurement and statistical analysis is provided in the Supplementary Information. Dunedin study sample. Participants are members of the Dunedin Multi­ disciplinary Health and Development Study, which tracks the development of 1,037 individuals born in the period 1972–1973 in Dunedin, New Zealand42 . Measuring economic-burden outcomes. We drew on personal interviews and on New Zealand’s multiple nationwide administrative databases and electronic medical records to ascertain the cumulative distributions of eight economically burdensome outcomes (Fig. 1). Social welfare benefit months. Using record linkage, we collected information about social welfare benefits received from the New Zealand Ministry of Social Development (Fig. 1a). The cohort accumulated 24,997 months of welfare payments between January 1993 and March 2012 (approximately age 21–38 years). The cumulative distribution of benefit months revealed that 20% of the cohort accounted for 80% of the months of social welfare benefits received by the cohort. These individuals constituted a high-cost group in the social welfare sector. Fatherless child-years. Fatherless child-years (Fig. 1b) are defined by the absence of the biological father from the households in which a cohort member’s offspring live. Using life history calendars, we recorded information about childbirths and the living arrangements of all cohort members’ offspring (until each reached 18 years of age). In the cohort, 669 parents produced 1,418 live births. These offspring lived a total of 10,946 child-years of which 25% (2,755 child-years) were spent in households without their biological fathers. Twenty per cent of the cohort accounted for 82% of their offsprings’ fatherless years. These individuals constituted a high-cost group in the fatherless-children sector. Tobacco smoking pack-years. In repeated personal interviews, we gathered details about tobacco smoking and calculated the number of pack-years smoked (Fig. 1c), where pack-years =​ ((number of cigarettes smoked per day ×​ number of years smoked)/20); 1 pack-year =​ 7,305 cigarettes. The cohort smoked 5,760 pack-years, the equivalent of 42,076,800 cigarettes. Twenty per cent of the cohort accounted for 68% of the pack-years smoked. These individuals constituted a high-cost group in the smoking sector. Excess obese kilograms. We measured height and weight during anthropometric assessments (Fig. 1d). By early midlife, the cohort had put on 2,924 kg of excess weight, defined as the total number of kilograms beyond a BMI of 30, the recognized cut-off for obesity; thus, a person with a BMI ≤​ 30 carries 0 excess obese kilograms, whereas the excess weight of a person with a BMI >​ 30 is their actual weight minus the weight predicted for a BMI of 30 based on their height. Twenty per cent of the cohort accounted for 98% of excess weight in the cohort. These individuals constituted a high-cost group in the excess-weight sector. Hospital-bed nights. We obtained details of admission events to public hospitals from Ministry of Health records (Fig. 1e). The cohort accumulated 8,958 nights in the hospital from January 1988 to March 2012. Twenty per cent of the cohort accounted for 77% of hospital-bed nights in the cohort. These individuals constituted a high-cost group in the hospital-stay sector. Prescription drug fills. We obtained information about prescription drugs filled by pharmacists, as indicated on the nationwide Pharmaceutical Management Agency database (Fig. 1f). The cohort filled 66,811 prescriptions between January 2006 and March 2012. Twenty per cent of the cohort accounted for 89% of prescriptions. These individuals constituted a high-cost group in the prescription-fill sector. Injury insurance claims. We obtained records of insurance claims for accidents and injuries from the Accident Compensation Corporation, the national provider of comprehensive, no-fault personal injury cover for New Zealanders (Fig. 1g). The cohort made 6,919 claims between January 1993 and March 2012. The concentration was not as pronounced for this outcome as for others, perhaps owing to the random nature of many accidents and injuries. Nevertheless, 20% of the cohort accounted for 52% of injury claims in the cohort. These individuals constituted a high-cost group in the injury-claim sector. Convictions for crime. We obtained information about criminal convictions by searching the records available to the New Zealand Police (Fig. 1h). The cohort had 2,141 convictions for adult crimes (excluding routine traffic offenses), beginning at age 15. The concentration was more pronounced
  • 9. NATURE HUMAN BEHAVIOUR 1, 0005 (2016) | DOI: 10.1038/s41562-016-0005 | www.nature.com/nathumbehav 9 ARTICLESNATURE HUMAN BEHAVIOUR for this outcome than for others: 20% of the cohort accounted for 97% of convictions in the cohort. These individuals constituted a high-cost group in the crime sector. Measuring childhood risk factors. We measured risk factors that are thought to augur poor adult outcomes. All risk factor measures have been described in previous reports about this cohort. Childhood socioeconomic status43 was defined as the average of the highest occupational status of either parent across study assessments from the cohort member’s birth through 11 years (1 =​ unskilled labourer; 6 =​ professional), on New Zealand’s occupational rating of the 1970s. Childhood maltreatment44 includes evidence of: (1) maternal rejection assessed at 3 years of age by observational ratings of mothers’ interaction with the study children, (2) harsh discipline assessed at ages 7 and 9 years by parental report of disciplinary behaviours, (3) two or more changes in the child’s primary caregiver, and (4) physical abuse and (5) sexual abuse reported by study members once they reached adulthood. For each child, our cumulative index counts the number of maltreatment indicators during the first decade of life; 63.7% of children experienced no maltreatment, 26.7% experienced one indicator of maltreatment (hereinafter ‘probable’ maltreatment), and 9.6% experienced two or more indicators of maltreatment (‘definite’ maltreatment). Childhood intelligence9 was measured as IQ with the Wechsler Intelligence Scale for Children – Revised (WISC-R) administered at ages 7, 9 and 11 years. IQ scores for the three ages were averaged and standardized. Childhood self-control9 during the first decade of life was measured using nine measures of self-control: observational ratings of children’s lack of control (ages 3 and 5 years) and parent, teacher and self-reports of hyperactivity, lack of persistence, inattention, impulsive aggression and impulsivity (ages 5, 7, 9 and 11 years). The nine measures were positively and significantly correlated. Based on principal components analysis, the standardized measures were averaged into a single composite comprising multiple ages and informants, with strong internal reliability α =​ 0.86. Brain health at three years of age. Using the information from the child examination and subsequent behaviour ratings completed when study participants were three years old, we created a summary factor score via confirmatory factor analysis which we termed brain health, a global index of the child’s early- neurocognitive status27 . Statistical analysis. We began our work by examining the cumulative distributions of each of the eight outcomes (Fig. 1). We tested the associations between childhood risk factors and growing up to be a member of a high-cost group using modified Poisson regression models to estimate risk ratios (RRs). We then added up (0–8) the number of high-cost groups to which each individual belonged and used negative binomial regressions to model incident rate ratios (IRRs). We followed up on this analysis to test the associations between childhood risk factors and membership in the multiple-high-cost sector. We evaluated predictive accuracy using ROC curve analysis to estimate each individual’s probability of belonging to a high-cost group in society based on their childhood risks. Data availability. Dunedin Study data are available from the authors on reasonable request. A managed-access process ensures that approval is granted to research that comes under the terms of participant consent and privacy (see Supplementary Information for data-sharing details). Received 25 April 2016; accepted 22 September 2016; published 12 December 2016 References 1. Human Capital Development Before Age Five (eds Almond, D. & Currie, J.) (National Bureau of Economic Research, 2010); ​http://www.nber.org/papers/ w15827​ 2. Duncan, G. J. & Magnuson, K. Investing in preschool programs. J. Econ. Perspect. 27, 109–131 (2013). 3. Campbell, F. et al. Early childhood investments substantially boost adult health. Science 343, 1478–1485 (2014). 4. Gertler, P. et al. Labor market returns to an early childhood stimulation intervention in Jamaica. Science 344, 998–1001 (2014). 5. Heckman, J., Pinto, R. & Savelyev, P. Understanding the mechanisms through which an influential early childhood program boosted adult outcomes. Am. Econ. Rev. 103, 2052–2086 (2013). 6. Reynolds, A. J., Temple, J. A., Ou, S. R., Arteaga, I. A. & White, B. A. B. School-based early childhood education and age-28 well-being: effects by timing, dosage, and subgroups. Science 333, 360–364 (2011). 7. Karoly, L. A., Kilburn, M. R. & Cannon, J. S. Proven Benefits of Early Childhood Interventions (Rand Corporation, 2005); ​http://www.rand.org/pubs/ research_briefs/RB9145.html​ 8. Heckman, J. J. Skill formation and the economics of investing in disadvantaged children. Science 312, 1900–1902 (2006). 9. Moffitt, T. E. et al. A gradient of childhood self-control predicts health, wealth, and public safety. Proc. Natl Acad. Sci. USA 108, 2693–2698 (2011). 10. Roberts, B. W., Kuncel, N. R., Shiner, R., Caspi, A. & Goldberg, L. R. The power of personality: the comparative validity of personality traits, socioeconomic status, and cognitive ability for predicting important life outcomes. Perspect. Psychol. Sci. 2, 313–345 (2007). 11. Felitti, V. J. et al. Relationship of childhood abuse and household dysfunction to many of the leading causes of death in adults. The Adverse Childhood Experiences (ACE) Study. Am. J. Prev. Med. 14, 245–258 (1998). 12. Rutter, M. Nature, nurture, and development: from evangelism through science toward policy and practice. Child Dev. 73, 1–21 (2002). 13. Sampson, R. The characterological imperative. J. Econ. Lit. 54, 493–513 (2016). 14. Steuerle, E. & Jackson, L. M. Advancing the Power of Economic Evidence to Inform Investments in Children, Youth, and Families (National Academies, 2016). 15. Shonkoff, J. P., Boyce, W. T. & McEwen, B. S. Neuroscience, molecular biology, and the childhood roots of health disparities: building a new framework for health promotion and disease prevention. J. Am. Med. Assoc. 301, 2252–2259 (2009). 16. Diamond, A. Activities and programs that improve children’s executive functions. Curr. Dir. Psychol. Sci. 21, 335–341 (2012). 17. Black, M. M. & Dewey, K. G. Promoting equity through integrated early child development and nutrition interventions. Ann. NY Acad. Sci. 1308, 1–10 (2014). 18. National Prevention Council National Prevention Strategy (US Department of Health & Human Services, 2011); ​http://www.surgeongeneral.gov/priorities/ prevention/strategy​ 19. Power, C., Kuh, D. & Morton, S. From developmental origins of adult disease to life course research on adult disease and aging: insights from birth cohort studies. Annu. Rev. Public Health 34, 7–28 (2013). 20. Bunkley, N. Jospeh Juran, 103, pioneer in quality control dies. The New York Times (3 March 2008); ​http://www.nytimes.com/2008/03/03/business/03juran. html?_r=​0​ 21. Rooney, P. Microsoft’s CEO: 80–20 rule applies to bugs, not just features. CRN Magazine (3 October 2002); ​http://www.crn.com/news/security/ 18821726/microsofts-ceo-80-20-rule-applies-to-bugs-not-just-features.htm​ 22. Heckman, J., Moon, S. H., Pinto, R., Savelyev, P. & Yavitz, A. Analyzing social experiments as implemented: a reexamination of the evidence from the HighScope Perry Preschool Program. Quant. Econom. 1, 1–46 (2010). 23. Pepe, M. S., Janes, H., Longton, G., Leisenring, W. & Newcomb, P. Limitations of the odds ratio in gauging the performance of a diagnostic, prognostic, or screening marker. Am. J. Epidemiol. 159, 882–890 (2004). 24. Kraemer, H. C. et al. Coming to terms with the terms of risk. Arch. Gen. Psychiat. 54, 337–343 (1997). 25. Rice, M. E. & Harris, G. T. Comparing effect sizes in follow-up studies: ROC Area, Cohen’s d, and r. Law Hum. Behav. 29, 615–620 (2005). 26. Hosmer, D. & Lemeshow, S. Applied Logistic Regression (Wiley, 2005). 27. Caspi, A. et al. The p factor: one general psychopathology factor in the structure of psychiatric disorders? Clin. Psychol. Sci. 2, 119–137 (2014). 28. Heckman, J. J., Moon, S. H., Pinto, R., Savelyev, P. A. & Yavitz, A. The rate of return to the High Scope Perry Preschool Program. J. Public Econ. 94, 114–128 (2010). 29. Income distribution and poverty. OECD.Stat. ​https://stats.oecd.org/Index. aspx?DataSetCode=IDD​ (2012). 30. Health Expenditure, Total (% of GDP) (The World Bank, 2016); ​http://data.worldbank.org/indicator/SH.XPD.TOTL.ZS/​ 31. Every Child Matters (Department for Education, 2003); ​https://www. education.gov.uk/consultations/downloadableDocs/EveryChildMatters.pdf​ 32. Thomas, D. C. Invited commentary: is it time to retire the “pack-years” variable? Maybe not! Am. J. Epidemiol. 179, 299–302 (2014). 33. Rushton, J. P., Brainerd, C.J. & Pressley, M. Behavioral development and construct validity: the principle of aggregation. Psychol. Bull. 94, 18–38 (1983). 34. Evans, G. W., Li, D. & Whipple, S. S. Cumulative risk and child development. Psychol. Bull. 139, 1342–1396 (2013). 35. Adverse childhood experiences (ACEs). Centers for Disease Control and Prevention ​http://www.cdc.gov/violenceprevention/acestudy​ (2016). 36. Kulminski, A. M. et al. Do gender, disability, and morbidity affect aging rate in the LLFS? Application of indices of cumulative deficits. Mech. Ageing Dev. 132, 195–201 (2011). 37. Gormley, W. T. Jr From science to policy in early childhood education. Science 333, 978–981 (2011). 38. Heckman, J. J. The economics, technology, and neuroscience of human capability formation. Proc. Natl. Acad. Sci. USA 104, 13250–13255 (2007). 39. Gabrieli, C., Ansel, D. & Krachman, S. B. Ready to be Counted: The Research Case for Education Policy Action on Non-cognitive Skills (Transforming Education, 2015); ​http://www.transformingeducation.org/resources/
  • 10. 10 NATURE HUMAN BEHAVIOUR 1, 0005 (2016) | DOI: 10.1038/s41562-016-0005 | www.nature.com/nathumbehav ARTICLES NATURE HUMAN BEHAVIOUR 40. Hoedemaekers, R. & Dekkers, W. Justice and solidarity in priority setting in health care. Health Care Anal. 11, 325–343 (2003). 41. Kohler, H. P. & Behrman, J. R. Benefits and Costs of the Population and Demography Targets for the Post-2015 Development Agenda. (Copenhagen Consensus Center, 2015); ​http://www.copenhagenconsensus. com/sites/default/files/population_assessment_-_kohler_behrman_0.pdf 42. Poulton, R., Moffitt, T. E. & Silva, P. A. The Dunedin Multidisciplinary Health and Development Study: overview of the first 40 years, with an eye to the future. Soc. Psychiatry Psychiatr. Epidemiol. 50, 679–693 (2015). 43. Poulton, R. et al. Association between children’s experience of socioeconomic disadvantage and adult health: a life-course study. Lancet 360, 1640–1645 (2002). 44. Caspi, A. et al. Role of genotype in the cycle of violence in maltreated children. Science 297, 851–854 (2002). Acknowledgements We thank Dunedin Study members, their families and Dunedin Study founder Phil Silva. This research received support from US National Institute on Aging (NIA) grants AG032282, AG048895, AG049789, UK Medical Research Council (MRC) grant MR/K00381X and ESRC grant ES/M010309/1. The Dunedin Study was supported by the New Zealand Health Research Council and New Zealand Ministry of Business, Innovation and Employment (MBIE). Additional support was provided by the Jacobs Foundation and the Avielle Foundation. The funders had no role in study design, data collection and analysis, decision to publish, or preparation of the manuscript. We thank D. Reiss, J. Heckman and his seminar members, and the New Zealand agencies that offered guidance and assistance to the Dunedin Study. We also thank Z. van der Merwe (ACC), C. Lewis (Ministry of Health), M. Wilson and R. Ota (Ministry of Social Development), the Otago Police District Commander, P. Stevenson, J. Curren and the Dunedin Police. The Otago University Ethics Committee, Duke University and King’s College London provided ethical approval for the Dunedin Study. Participants gave written consent before data were collected. Author contributions A.C., R.P. and T.E.M. designed the research, and A.C., R.M.H. and T.E.M. wrote the manuscript. A.C., S.H., S.R., R.P. and T.E.M. collected the data, and it was analysed by A.C., R.M.H. and H.H. All authors reviewed drafts, provided critical feedback and approved the final manuscript. Additional information Supplementary information is available for this paper. Reprints and permissions information is available at www.nature.com/reprints. Correspondence and requests for materials should be addressed to A.C. How to cite this article: Caspi, A. et al. Childhood forecasting of a small segment of the population with large economic burden. Nat. Hum. Behav. 1, 0005 (2016). Competing interests The authors declare no competing interests.