Parental alcohol consumption and the risk of congenital heart diseases in offspring an updated systematic review and meta-analysis
•
1 like•38 views

Conclusions: Although the role of potential bias and evidence of heterogeneity should be carefully evaluated, our review indicates that parental alcohol exposures are significantly associated with the risk of CHDs in offspring, which highlights the necessity of improving health awareness to prevent alcohol exposure during preconception and conception periods.

Recommended
Recommended
More Related Content
What's hot
What's hot (19)
Similar to Parental alcohol consumption and the risk of congenital heart diseases in offspring an updated systematic review and meta-analysis
Similar to Parental alcohol consumption and the risk of congenital heart diseases in offspring an updated systematic review and meta-analysis (20)
More from BARRY STANLEY 2 fasd
More from BARRY STANLEY 2 fasd (20)
Recently uploaded
Recently uploaded (20)
Parental alcohol consumption and the risk of congenital heart diseases in offspring an updated systematic review and meta-analysis
- 1. Review Parental alcohol consumption and the risk of congenital heart diseases in offspring: An updated systematic review and meta-analysis Senmao Zhang, Lesan Wang, Tubao Yang, Lizhang Chen, Lijuan Zhao, Tingting Wang, Letao Chen, Ziwei Ye, Zan Zheng and Jiabi Qin Abstract Objective: The aim of this study was to provide updated evidence to assess the association between parental alcohol consumption and the risk of total congenital heart diseases (CHDs) and specific CHD phenotypes in offspring, and explore the possible dose–response pattern. Methods: PubMed, Embase and Chinese databases were searched with an end-date parameter of July 24, 2019 to identify studies meeting pre-stated inclusion criteria. A random-effects model was used to calculate the overall combined risk estimates. A meta-analysis of the dose–response relationship was performed. Subgroup analysis, sensitivity analysis, and Galbraith plot were conducted to explore potential heterogeneity moderators. Results: A total of 55 studies involving 41,747 CHD cases and 297,587 controls were identified. Overall, both maternal (odds ratio (OR) ¼ 1.16; 95% confidence interval (CI): 1.05–1.27) and paternal (OR ¼ 1.44; 95% CI: 1.19–1.74) alcohol exposures were significantly associated with risk of total CHDs in offspring. Additionally, a nonlinear dose–response relationship between parental alcohol exposure and risk of total CHDs was observed. With an increase in parental alcohol consumption, the risk of total CHDs in offspring also gradually increases. For specific CHD phenotypes, a statistically significant association was found between maternal alcohol consumption and risk of tetralogy of fallot (OR ¼ 1.20; 95% CI: 1.08–1.33). Relevant heterogeneity moderators have been identified by subgroup analysis, and sensitivity analysis yielded consistent results. Conclusions: Although the role of potential bias and evidence of heterogeneity should be carefully evaluated, our review indicates that parental alcohol exposures are significantly associated with the risk of CHDs in offspring, which highlights the necessity of improving health awareness to prevent alcohol exposure during preconception and conception periods. Keywords Congenital heart diseases, alcohol consumption, systematic review, meta-analysis Received 24 June 2019; accepted 17 August 2019 Introduction Congenital heart diseases (CHDs), defined as significant structural abnormalities of the heart or intrathoracic great vessels occurring in embryonic period, are cur- rently the most common birth defects and the main cause of perinatal mortality.1–4 Besides, it was reported that CHDs can increase the risk of cardiovascular dis- ease in later life, even after surgical treatment.5 Department of Epidemiology and Health Statistics, Xiangya School of Public Health, Central South University, Hunan, China Corresponding author: Jiabi Qin, Department of Epidemiology and Health Statistics, Xiangya School of Public Health, Central South University, 110 Xiangya Road, Changsha, Hunan 410078, China. Email: qinjiabi123@163.com European Journal of Preventive Cardiology 0(00) 1–12 ! The European Society of Cardiology 2019 Article reuse guidelines: sagepub.com/journals-permissions DOI: 10.1177/2047487319874530 journals.sagepub.com/home/cpr
- 2. Epidemiologically, it was estimated that the worldwide prevalence of CHDs was 8.22% of all live births, and approximately 1.35 million babies with CHDs were born each year, representing a major global health problem.6 In China, the prevalence of CHDs in live birth was 7–8%, with 100,000 to 150,000 cases per year.7,8 Although many studies have been performed on CHDs, the pathogenesis has not been fully elucidated. Some studies suggested that parental alcohol con- sumption was significantly associated with the risk of fetal alcohol spectrum disorder (FASD) (the main clinical symptoms include congenital abnormalities, growth retardation, and mental, behavioral, cognitive, and/or learning-ability delays and disorders),9,10 and approximately 28.5% of FASD children were diag- nosed with CHDs,10 which indicates that parental alco- hol consumption may increase the risk of CHDs in offspring. Although data available from many original studies have examined the association between parental alcohol consumption and risk of CHDs in off- spring,4,11–19 the results were still inconsistent. So far, three meta-analyses,20–22 performed four years ago, have been conducted to address this issue. However, these three reviews only focused on the asso- ciation between maternal alcohol consumption and risk of CHDs, and did not pay attention to paternal alcohol consumption. Meanwhile, the three reviews did not find any statistically significant association between alcohol consumption and risk of CHDs. Additionally, many subsequent studies11–19 have been published since the publication of the aforementioned reviews. The inclu- sion of these newer literatures in future meta-analysis would be bound to increase the statistical power, which would help in finding a statistically significant differ- ence. Again, the shape of the dose–response relation- ship between parental alcohol consumption and risk of CHDs in offspring is also warranted to clarify. Considering the inconsistency of the existing studies and the insufficient statistical power of the published reviews, we conducted an updated systematic review and meta-analysis with the following objectives: (i) to review and summarize the association between parental alcohol consumption and risk of both total CHDs and specific CHD phenotypes in offspring; (ii) to assess the possible dose–response pattern between parental alco- hol consumption and risk of total CHDs; and (iii) to identify the potential heterogeneity moderators by sub- group and sensitivity analyses. Methods Literature search strategy We referred to the Preferred Reporting Items for Systematic Reviews and Meta-analyses (PRISMA) guidelines to report this meta-analysis.23 Relevant stu- dies assessing the risk of CHDs in offspring associated with parental alcohol consumption were identified. PubMed, Embase, China Biology Medicine disc, Chinese Scientific Journals Full-text Database (CQVIP), China National Knowledge Infrastructure (CNKI), and Wanfang Database were searched from 1950 to July 24, 2019. We used and combined the fol- lowing search terms: ‘‘(congenital heart disease OR congenital heart defect OR congenital heart malforma- tion OR congenital heart anomalies OR congenital car- diac disease OR congenital cardiac defect OR congenital cardiac malformation OR congenital cardiac anomalies OR cardiovascular malformation OR con- genital cardiovascular disease OR cardiovascular defect OR cardiovascular anomalies) AND (alcohol OR drink- ing OR parental drinking OR parental alcohol OR maternal drinking OR and maternal alcohol) AND (cohort study OR prospective study OR follow-up study OR longitudinal study OR incidence study OR case-control study).’’ Furthermore, reference lists of the retrieved articles and recent reviews were evaluated. Exposures and outcomes of interest In the present study, the exposures of interest were par- ental alcohol consumption. Alcohol exposure was defined as any alcohol taken during the peri-conception period (three months before the pregnancy and the first trimester of pregnancy).24 Additionally, we also exam- ined the association between parental binge drinking (defined as five or more drinks per sitting25 ) and risk of CHDs. The outcomes of interest were CHDs. In this review, we focused not only on the risk of total CHDs, but also on the risk-specific CHD phenotypes, including ventricular septal defect (VSD), atrial septal defect (ASD), atrioventricular septal defect (AVSD), d-transposition of the great arteried (TGA), tetralogy of fallot (TOF), pulmonary valve stenosis (PVS), and so on. Because variations in the definition of exposures and outcomes exist across countries and cultures, it is extremely difficult to define uniform standards. Some of the included studies did not always define exposures and outcomes, and in such cases, we relied on the cor- responding terminology in the original articles. Inclusion and exclusion criteria Studies were considered eligible if they: (i) were published in Chinese or English; (ii) had a cohort or case–control design; (iii) had use of parental alcohol consumption as the exposure of interest; (iv) had use of CHDs as the outcome of interest; and (v) reported relative risks (RRs) and odds ratios (ORs), with corres- ponding 95% confidence intervals (CIs) (or data to 2 European Journal of Preventive Cardiology 0(00)
- 3. calculate them). If the same population was studied in more than one study, we included the study with the longest follow-up time or the most information. Data extraction and quality assessment Two independent authors (SMZ and JBQ) extracted data and assessed study quality. Any disagreements were resolved through discussion among the authors until consensus was reached. Data extraction was per- formed by using a standardized data collection form. We extracted any reported RRs or ORs of CHDs for parents having alcohol exposure, compared with those without alcohol exposure. Additionally, the character- istics of each study were extracted. Information was recorded as follows: the first author’s name; publication year; geographic region; study design; recruitment period; number of cases/controls; exposure of interest (maternal or paternal alcohol exposure); alcohol expos- ure time; reported CHDs; whether the confounding fac- tors were adjusted; and quality scores. The Newcastle–Ottawa Scale26 was adapted to evaluate the quality of inclusion studies. In statistics, the scale is a tool used for assessing the quality of non- randomized studies included in a systematic review and/or meta-analysis. Using this scale, each study is judged on eight items, categorized into three groups: the selection of the study groups; the comparability of the groups; and the ascertainment of outcome or expos- ure of interest. Stars awarded for each quality item serve as a quick visual assessment. Stars are awarded such that the highest-quality studies can be awarded with as many as nine stars. If a study gains 7 stars, it will be considered of higher methodologic quality. Statistical analysis OR was used to measure the association between paren- tal alcohol consumption and risk of CHDs, and RR was directly considered as OR. The combined OR and the corresponding 95% CI were calculated using random- effects models. Homogeneity of effect size across studies was tested by using the Q-statistic (significance level at P 0.10). The I2 -statistic was a quantitative measure used to evaluate the inconsistency across studies (signifi- cance level at I2 50%).27 Sensitivity analysis was conducted to explore pos- sible explanations for heterogeneity and examine the influence of various exclusion criteria on the overall risk estimate. We performed a sensitivity analysis by omitting studies with low-quality scores or omitting studies that did not adjust any confounding factors when assessing the association between parental alco- hol consumption and CHD risk. Again, we investigated the influence of a single study on the overall risk estimate by omitting one study in each turn. Meanwhile, Galbraith plot was also conducted to detect the heterogeneity due to individual studies.28 Subgroup analyses were performed according to geo- graphic region, study design, alcohol exposure time, whether the confounding factors were adjusted, and quality scores. Potential publication bias was assessed by Begg’s funnel plots and Begg’s rank correlation test (significance level at P 0.10).29 Subgroup analyses, sensitivity analyses, Galbraith plot, and publication bias assessment were performed only for the risk of total CHDs, considering the limited number of included studies for specific CHD phenotypes. Additionally, a dose–response analysis, which has been described by the previous study, was conducted to assess the relationship between parental alcohol con- sumption and risk of total CHDs.30,31 We transformed alcohol consumption categories into grams of alcohol per day as a common unit of measurement. If the ori- ginal studies had not stated the grams of alcohol per drink in the study, or the conversion coefficient, then we would make the conversion based on geographical loca- tion: for Canada, 13.6g; USA, 12g; UK, 8 g; China (female), 25g; China (male), 50g; and for both New Zealand and Australia, 10g of pure alcohol. For all other countries without any clear specifications, 12g of pure alcohol was used as an equivalent of per drink.20,31 Statistical analyses were performed using Stata ver- sion 12.0 (College Station, TX: StataCorp, LLP) and Review Manager Version 5.3 (The Nordic Cochrane Centre, The Cochrane Collaboration). Statistical tests were declared significant for a two-sided P-value not exceeding 0.05, except where otherwise specified. Results Search results and study characteristics We initially searched 2186 potentially eligible articles; most were excluded after the first screening based on titles or abstracts because they were duplicates, reviews, or unrelated to our topics. After full-text review of 142 studies, 20 studies in which outcome measures could not be extracted, 16 studies including multiple congenital defects, 18 studies in which the exposure was inconsistent with our interest, three studies belong- ing to duplicated data, and 30 studies not reporting the frequency of alcohol consumption were further excluded. Finally, we identified 55 eligible articles (Supplementary Table 1: reference numbers 1–55). The study selection process is summarized in Supplementary Figure 1. The characteristics of the included studies, which involved a total of 41,747 CHDs cases and 297,587 controls and were published between 1991 and 2019, Zhang et al. 3
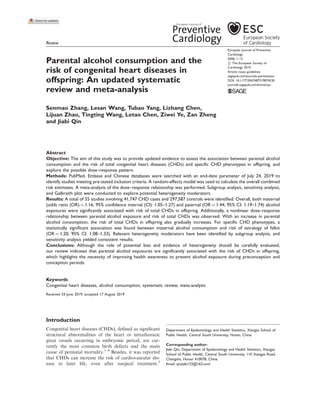
- 4. are summarized in Supplementary Table 1. Twenty- nine studies (52.7%) were conducted in Asia, 15 (27.3%) in North America, 10 (18.2%) in Europe, and one (1.8%) in Oceania. Only three studies had a cohort design, while the remaining belonged to case– control studies. The association between maternal alcohol consumption and risk of CHDs was reported in the 45 included studies, and the risk of CHDs asso- ciated with paternal alcohol exposure was assessed in the 24 included studies. Of these, 10 studies (Supplementary Table 1: reference numbers 3, 5–8, 10–12, 21, 32) reported the relationship between maternal binge drink- ing of alcohol and risk of CHDs, and nine studies (Supplementary Table 1: reference numbers 12, 16, 23, 29, 32, 46, 47, 50, 53) reported the association between paternal binge alcohol and risk of CHDs. Maternal alcohol consumption and risk of CHDs in offspring Risk estimates between maternal alcohol consumption and risk of total CHDs in offspring are summarized in Figure 1. Overall, mothers who had alcohol exposure experiences were at a significantly higher risk of CHDs in offspring compared with those without alcohol exposure (OR ¼ 1.16, 95% CI: 1.05– 1.27; P ¼ 0.003). However, substantial heterogeneity was found (P 0.00001; I2 ¼ 74.0%). In addition, 10 studies assessed the risk of CHDs associated with maternal binge drinking of alcohol; mothers having binge drinking experiences, compared with those with- out alcohol exposure, had a significantly increased risk of total CHDs (OR ¼ 1.16, 95% CI: 1.02–1.32) (Supplementary Figure 2). Risk estimates between maternal alcohol consumption and risk of specific CHD phenotypes in offspring are summarized in Figure 2. Our results suggested that maternal alcohol consumption was not significantly asso- ciated with the risk of specific CHD phenotypes except for TOF (OR ¼ 1.20, 95% CI: 1.08–1.33; P ¼ 0.0007). Paternal alcohol consumption and risk of CHDs in offspring Risk estimates between paternal alcohol consumption and risk of total CHDs in offspring are summarized in Figure 3. Overall, if fathers had a history of alcohol exposure, their children experienced a significantly increased risk of total CHDs (OR ¼ 1.44, 95% CI: 1.19–1.74; P ¼ 0.0001), but substantial heterogeneity was observed (P 0.00001; I2 ¼ 90.0%). Additionally, we found a statistically significant association between paternal binge drinking of alcohol and risk of total CHDs in offspring (OR ¼ 1.52, 95% CI: 1.20–1.95) (Supplementary Figure 3). It is interesting to note that only a small number of studies focused on the risk of specific CHD phenotypes associated with paternal alcohol exposure. The present meta-analysis did not show a statistically significant association between paternal alcohol consumption and reported phenotypes of CHDs including VSD (OR ¼ 1.35, 95% CI: 0.99–1.84) and ASD (OR ¼ 2.60, 95% CI: 0.85–7.96) (Figure 2). Dose–response relationship The dose–response relationship between maternal alco- hol consumption (Supplementary Table 1: reference numbers 2–13) and risk of total CHDs is summarized in Figure 4(a), and the dose–response relationship between paternal alcohol consumption (Supplementary Table 1: reference numbers 12–13, 45) and risk of total CHDs is summarized in Figure 4(b). Overall, there was a nonlinear relationship between parental alcohol expos- ure and risk of total CHDs. With an increase in parental alcohol consumption, the risk of total CHDs in offspring also gradually increased. When maternal alcohol con- sumption was more than 116 grams per day, the risk of total CHDs in offspring significantly increased by 42% (OR ¼ 1.42, 95% CI: 1.07–1.88). Similarly, the risk of total CHDs in offspring was also significantly increased by 47% (OR¼ 1.47, 95% CI: 1.10–1.97) when paternal alcohol consumption was more than 375 grams per day. Subgroup analyses Subgroup analyses for risk estimates between parental alcohol consumption and total CHDs are summarized in Table 1. For risk estimates between maternal alcohol exposure and risk of total CHDs in offspring, after sub- group analysis, geographic region (test for subgroup difference (TSD): I2 ¼ 94.5%), whether the confound- ing factors were adjusted (TSD: I2 ¼ 93.9%), and alco- hol exposure time (TSD: I2 ¼ 56.3%) were identified as relevant heterogeneity moderators. The risk of total CHDs associated with maternal alcohol exposure was significantly different for different geographic regions (v2 ¼ 55.01; P 0.00001) as well as whether the con- founding factors were adjusted (v2 ¼ 16.30; P 0.00001). When data were restricted to studies from Asia (OR ¼ 2.21; 95% CI: 1.58–3.09), and studies controlling the confounding factors (OR ¼ 1.60; 95% CI: 1.29–1.97), the risk of total CHDs was further increased. For risk estimates between paternal alcohol expos- ure and risk of total CHDs in offspring, after subgroup analysis, whether the confounding factors were adjusted (TSD: I2 ¼ 61.1%) and geographic region (TSD: I2 ¼ 28.7%) were identified as relevant 4 European Journal of Preventive Cardiology 0(00)
- 5. heterogeneity moderators. However, there were no stat- istically significant differences for risk of total CHDs in offspring associated with paternal alcohol exposure for whether the confounding factors were adjusted (v2 ¼ 2.57; P ¼ 0.11) and geographic region (v2 ¼ 1.40; P ¼ 0.24). The risk of total CHDs was further increased when data were studies from Asia (OR ¼ 1.50; 95% CI: 1.21–1.85), and studies controlling the confounding fac- tors (OR ¼ 2.07; 95% CI: 1.27–3.37). Sensitivity analysis For risk estimates between maternal alcohol consump- tion and total CHDs, removing the poor quality studies did not change overall risk estimates (OR ¼ 1.16; 95% CI: 1.05–1.29), with substantial evidence of heterogen- eity (P 0.00001; I2 ¼ 77.0%). The further exclusion of 29 studies not controlling for any confounding factors when assessing the association between maternal Baardman, ME 2012 Bean, H 2011 Boneva, RS 1999 Botto, LD 2014 Carmichael, SL 2003 Cedergren, MI 2002 Chen, YL 2019 Chen, LL 2012 Chen, WB 2013 Chen, ZS 2019 Ewing, CK 1997 Feng, Y 2018 Fixler, DE 1998 Gao, YQ 2016 Grewal, J 2008 Guo, YZ 2011 Guo, YZ 2016 Hao, GH 2015 Hobbs, CA 2006 Kuciene, R 2009 Lin, FN 2016 Liu, XQ 2018 Martinez-Frias 2004 Mateja, WA 2012 McDonald, AD 1992 O'Leary, CM 2013 Peng, T 2009 Smedts, H 2009 Steinberger, EK 2002 Stingone, JA 2017 Strandberg-Larsen, K 2011 Strobino, B 1999 Tikkanen, J 1991 van Driel, LM 2008 Verkleij-Hagoort, AC 2006 Wang, C 2013 Wang, C 2015 Wijnands, KP 2014 Williams, LJ 2004 Xiang, O 2017 Xu, XL 2018 Yang, Y 2011 Zhao, DD 2019 Zhao, TM 2016 Zhu, Y 2015 –0.15 0.01 –0.01 –0.09 0.28 –0.05 1.58 –1.11 1.82 –0.5 –0.02 0.17 0.26 1.16 0.19 1.99 2.19 1.73 –0.59 0.34 0.06 1.01 0.1 0.01 –0.04 0.41 1.82 0.05 –0.49 –0.08 0.04 –0.12 0.18 0.02 –0.28 –0.27 0.28 0.36 0.11 2.13 0.54 0.87 1.698 0.03 –0.07 0.16 0.21 0.07 0.04 0.15 0.16 0.36 1.16 0.75 0.59 0.09 0.08 0.34 0.53 0.15 0.63 0.57 0.49 0.23 0.24 0.18 0.43 0.22 0.26 0.11 0.07 0.75 0.17 0.72 0.06 0.07 0.1 0.31 0.18 0.2 0.37 0.23 0.22 0.17 1.07 0.37 0.41 0.68 0.43 0.07 3.1% 2.5% 4.3% 4.6% 3.2% 3.1% 1.3% 0.2% 0.4% 0.6% 4.0% 4.2% 1.4% 0.7% 3.2% 0.5% 0.6% 0.8% 2.3% 2.2% 2.8% 1.0% 2.4% 2.0% 3.8% 4.3% 0.4% 3.0% 0.4% 4.4% 4.3% 3.9% 1.6% 2.8% 2.6% 1.3% 2.3% 2.4% 3.0% 0.2% 1.3% 1.1% 0.5% 1.0% 4.3% 0.86 [0.63, 1.18] 1.01 [0.67, 1.52] 0.99 [0.86, 1.14] 0.91 [0.85, 0.99] 1.32 [0.99, 1.78] 0.95 [0.70, 1.30] 4.85 [2.40, 9.83] 0.33 [0.03, 3.20] 6.17 [1.42, 26.84] 0.61 [0.19, 1.93] 0.98 [0.82, 1.17] 1.19 [1.01, 1.39] 1.30 [0.67, 2.53] 3.19 [1.13, 9.01] 1.21 [0.90, 1.62] 7.32 [2.13, 25.15] 8.94 [2.92, 27.31] 5.64 [2.16, 14.74] 0.55 [0.35, 0.87] 1.40 [0.88, 2.25] 1.06 [0.75, 1.51] 2.75 [1.18, 6.38] 1.11 [0.72, 1.70] 1.01 [0.61, 1.68] 0.96 [0.77, 1.19] 1.51 [1.31, 1.73] 6.17 [1.42, 26.84] 1.05 [0.75, 1.47] 0.61 [0.15, 2.51] 0.92 [0.82, 1.04] 1.04 [0.91, 1.19] 0.89 [0.73, 1.08] 1.20 [0.65, 2.20] 1.02 [0.72, 1.45] 0.76 [0.51, 1.12] 0.76 [0.37, 1.58] 1.32 [0.84, 2.08] 1.43 [0.93, 2.21] 1.12 [0.80, 1.56] 8.41 [1.03, 68.52] 1.72 [0.83, 3.54] 2.39 [1.07, 5.33] 5.46 [1.44, 20.71] 1.03 [0.44, 2.39] 0.93 [0.81, 1.07] Study or subgroup Log [Risk ratio] SE Weight Risk ratio Risk ratio IV, Random, 95% CI IV, Random, 95% CI Heterogeneity: Tau2 = 0.05; Chi2 = 166.15, df = 44 (P 0.00001); I2 = 74% Test for overall effect: Z = 2.98 (P = 0.003) Total (95% Cl) 100.0% 1.16 [1.05, 1.27] 0.2 0.5 Favours [experimental] Favours [control] 1 2 5 Figure 1. Forest plot for maternal alcohol consumption and risk of overall CHDs. SE: standard error; CI: confidence interval. Zhang et al. 5
- 6. 3.1.1 maternal alcohol consumption and VSD 3.1.2 maternal alcohol consumption and ASD Subtotal (95% Cl) Subtotal (95% Cl) Subtotal (95% Cl) Subtotal (95% Cl) Subtotal (95% Cl) Subtotal (95% Cl) Subtotal (95% Cl) Subtotal (95% Cl) 3.1.4 maternal alcohol consumption and TGA 3.1.5 maternal alcohol consumption and TOF 3.1.6 maternal alcohol consumption and PVS 3.1.7 paternal alcohol consumption and VSD 3.1.8 paternal alcohol consumption and ASD 3.1.3 maternal alcohol consumption and AVSD Bean, H 2011 Ewing, CK 1997 Feng, Y 2018 Gao, YQ 2016 O'Leary, CM 2013 Stingone, JA 2017 Strandberg-Larsen, K 2011 Tikkanen, J 1991 Wijnands, KP 2014 Williams, LJ 2004 Zhu, Y 2015 0.03 –0.02 0.17 1.61 0.49 –0.11 0.13 0.18 0.36 0.11 –0.12 0.28 0.09 0.1 0.61 0.22 0.11 0.09 0.16 0.22 0.17 0.11 4.0% 14.3% 13.4% 1.0% 5.7% 12.5% 14.3% 8.7% 5.7% 8.1% 12.5% 1.03 [0.60, 1.78] 0.98 [0.82, 1.17] 1.19 [0.97, 1.44] 5.00 [1.51, 16.54] 1.63 [1.06, 2.51] 0.90 [0.72, 1.11] 1.14 [0.95, 1.36] 1.20 [0.87, 1.64] 1.43 [0.93, 2.21] 1.12 [0.80, 1.56] 0.89 [0.71, 1.10] 0.80 [0.22, 2.87] 0.89 [0.70, 1.12] 1.77 [1.27, 2.47] 1.30 [0.56, 3.01] 1.03 [0.78, 1.36] 0.82 [0.65, 1.04] 0.90 [0.73, 1.12] 0.96 [0.50, 1.83] 0.92 [0.58, 1.48] 1.16 [0.66, 2.05] 1.43 [1.03, 2.00] 1.39 [0.87, 2.23] 1.14 [0.57, 2.26] 0.94 [0.72, 1.24] 1.01 [0.83, 1.23] 1.09 [0.72, 1.65] 1.82 [1.05, 3.15] 1.03 [0.70, 1.52] 1.75 [0.85, 3.62] 1.22 [0.98, 1.52] 1.17 [1.02, 1.35] 1.19 [0.56, 2.50] 0.90 [0.71, 1.13] 0.82 [0.66, 1.02] 0.86 [0.74, 1.01] 1.07 [0.94, 1.23] 5.26 [1.79, 15.46] 3.35 [1.42, 7.94] 1.75 [1.16, 2.64] 1.03 [0.63, 1.68] 1.01 [0.83, 1.23] 5.93 [2.60, 13.51] 3.39 [1.96, 5.86] 2.3% 19.6% 15.5% 4.8% 17.9% 19.6% 20.4% 23.9% 45.2% 30.9% 19.3% 11.0% 5.6% 25.6% 38.5% 6.4% 3.6% 7.1% 2.1% 23.3% 57.6% 4.4% 43.7% 52.0% 25.1% 25.5% 6.3% 8.7% 18.2% 16.1% 36.0% 30.4% 33.5% 0.65 0.12 0.17 0.43 0.14 0.12 0.11 0.33 0.24 0.29 0.17 0.24 0.35 0.14 0.1 0.21 0.28 0.2 0.37 0.11 0.07 0.38 0.12 0.11 0.08 0.07 0.55 0.44 0.21 0.25 0.1 0.42 0.28 –0.22 –0.12 0.57 0.26 0.03 –0.2 –0.1 –0.04 –0.08 0.15 0.36 0.33 0.13 –0.06 0.01 0.09 0.6 0.03 0.56 0.2 0.16 0.17 –0.11 –0.2 –0.15 0.07 1.66 1.21 0.56 0.03 0.01 1.78 1.22 Bean, H 2011 Feng, Y 2018 O'Leary, CM 2013 Stingone, JA 2017 Strandberg-Larsen, K 2011 Zhao, TM 2016 Zhu, Y 2015 Bean, H 2011 Feng, Y 2018 Stingone, JA 2017 Carmichael, SL 2003 Grewal, J 2008 O'Leary, CM 2013 Stingone, JA 2017 Zhu, Y 2015 Carmichael, SL 2003 Feng, Y 2018 Grewal, J 2008 O'Leary, CM 2013 Stingone, JA 2017 Zhu, Y 2015 Feng, Y 2018 Stingone, JA 2017 Zhu, Y 2015 Ewing, CK 1997 Feng, Y 2018 Gao, YQ 2016 Li, YN 2016 Ou, YQ 2016 Wijnands, KP 2014 Feng, Y 2018 Li, YN 2016 Ou, YQ 2016 100.0% 100.0% 100.0% 100.0% 100.0% 100.0% 100.0% 100.0% 1.11 [0.98, 1.25] 1.02 [0.83, 1.25] 1.00 [0.73, 1.37] 1.11 [0.94, 1.31] 1.20 [1.08, 1.33] 0.87 [0.74, 1.01] 1.35 [0.99, 1.84] 2.60 [0.85, 7.96] Study or subgroup Log [Odds ratio] SE Weight Odds ratio Odds ratio IV, Random, 95% CI IV, Random, 95% CI Heterogeneity: Tau2 = 0.02; Chi2 = 20.41, df = 10 (P = 0.03); I2 = 51% Test for overall effect: Z = 1.61 (P = 0.11) Heterogeneity: Tau2 = 0.04; Chi2 = 16.15, df = 6 (P = 0.01); I2 = 63% Test for overall effect: Z = 0.17 (P = 0.86) Heterogeneity: Tau2 = 0.00; Chi2 = 0.39, df = 2 (P = 0.82); I2 = 0% Test for overall effect: Z = 0.00 (P = 1.00) Heterogeneity: Tau2 = 0.01; Chi2 = 5.31, df = 4 (P = 0.26); I2 = 25% Test for overall effect: Z = 1.19 (P = 0.24) Heterogeneity: Tau2 = 0.00; Chi2 = 4.17, df = 5 (P = 0.53); I2 = 0% Test for overall effect: Z = 3.38 (P = 0.0007) Heterogeneity: Tau2 = 0.00; Chi2 = 1.02, df = 2 (P = 0.60); I2 = 0% Test for overall effect: Z = 1.82 (P = 0.07) Heterogeneity: Tau2 = 0.09; Chi2 = 27.70, df = 5 (P 0.0001); I2 = 82% Test for overall effect: Z = 1.88 (P = 0.06) Heterogeneity: Tau2 = 0.90; Chi2 = 30.96, df = 2 (P 0.00001); I2 = 94% Test for overall effect: Z = 1.67 (P = 0.09) 0.2 0.5 1 2 5 Figure 2. Forest plot for parental alcohol consumption and risk of different CHD phenotypes. SE: standard error; CI: confidence interval. 6 European Journal of Preventive Cardiology 0(00)
- 7. alcohol exposure and CHD risk yielded similar results (OR ¼ 1.60; 95% CI: 1.29–1.97), but heterogeneity was still present (P 0.00001; I2 ¼ 84.0%). Besides, the elimination of any single study at a time did not materially alter the overall risk estimate (Supplementary Figure 4(a)). For the association between paternal alcohol con- sumption and risk of total CHDs in offspring, the Study or subgroup Chen, LL 2012 0 –0.42 –0.15 0.05 0.45 0.66 0.57 0.11 0.67 0.78 –0.39 0.72 0.47 0.2 0.76 0.69 0.14 –0.01 0.03 0.04 1.01 2.29 1.01 0.73 Chen, ZS 2019 Ewing, CK 1997 Feng, Y 2018 Gao, YQ 2016 Gong, T 2009 Li, J 2016 Li, X 2014 Li, YN 2016 Lin, FN 2016 Liu, XH 2016 Liu, XQ 2018 Lv, GR 2016 Ma, L 2015 Ou, YQ 2016 Steinberger, EK 2002 Wang, C 2013 Wang, C 2015 Wijnands, KP 2014 Xiang, O 2017 Xie, RX 2015 Xu, XL 2018 Yang, Y 2011 Zhao, GL 2011 Heterogeneity: Tau2 = 0.18; Chi2 = 232.72, df = 23 (P 0.00001); I2 = 90% Test for overall effect: Z = 3.79 (P = 0.0001) Total (95% Cl) 100.0% 1.44 [1.19, 1.74] Log [Odds ratio] SE Weight Odds ratio Odds ratio IV, Random, 95% CI IV, Random, 95% CI 0.17 0.29 0.08 0.06 0.22 0.15 0.24 0.15 0.21 0.31 0.06 0.14 0.26 0.25 0.14 0.32 0.2 0.11 0.25 0.13 0.28 0.63 0.14 0.26 4.5% 3.5% 5.0% 5.1% 4.1% 4.6% 3.9% 4.6% 4.2% 3.4% 5.1% 4.7% 3.8% 3.9% 4.7% 3.3% 4.3% 4.9% 3.9% 4.8% 3.6% 1.6% 4.7% 3.8% 1.00 [0.72, 1.40] 0.66 [0.37, 1.16] 0.86 [0.74, 1.01] 1.05 [0.93, 1.18] 1.57 [1.02, 2.41] 1.93 [1.44, 2.60] 1.77 [1.10, 2.83] 1.12 [0.83, 1.50] 1.95 [1.29, 2.95] 2.18 [1.19, 4.01] 0.68 [0.60, 0.76] 2.05 [1.56, 2.70] 1.60 [0.96, 2.66] 1.22 [0.75, 1.99] 2.14 [1.63, 2.81] 1.99 [1.06, 3.73] 1.15 [0.78, 1.70] 0.99 [0.80, 1.23] 1.03 [0.63, 1.68] 1.04 [0.81, 1.34] 2.75 [1.59, 4.75] 9.87 [2.87, 33.95] 2.75 [2.09, 3.61] 2.08 [1.25, 3.45] 0.2 0.5 1 2 5 Figure 3. Forest plot for paternal alcohol consumption and risk of overall CHDs. SE: standard error; CI: confidence interval. 6.00 (a) (b) 5.50 3.50 2.50 1.50 1.00 0 20 40 60 80 100 120 140 160 180 200 220 240 0 50 100 150 200 250 300 350 400 450 500 1.00 3.00 3.00 2.00 2.00 Oddsrisk Oddsrisk 4.50 4.00 4.00 5.00 5.00 Figure 4. The dose–response relationship between alcohol consumption and risk of overall CHDs. (a) Maternal alcohol consumption, grams/day. (b) Paternal alcohol consumption, grams/day. Zhang et al. 7
- 8. exclusion of eight low-quality studies yielded similar results (OR ¼ 1.45; 95% CI: 1.20–1.76), with sub- stantial evidence of heterogeneity (P 0.00001; I2 ¼ 83.0%). Additionally, the further exclusion of any single study at a time also yielded consistent results (Supplementary Figure 4(b)). Galbraith plot Galbraith plot analysis was performed to find the stu- dies that bring about heterogeneity. For the association between maternal alcohol exposure and risk of total CHDs in offspring, 12 studies (Supplementary Table 1: reference numbers 33–44) were identified after Galbraith plot analysis. After excluding these 12 stu- dies, the risk between maternal alcohol consumption and risk of CHDs was slightly increased (OR ¼ 1.02, 95% CI: 0.97–1.08, I2 ¼ 14.0%), but there was no statistical significance. For the association between paternal alcohol exposure and risk of total CHDs in offspring, 11 studies (Supplementary Table 1: reference numbers 44–54) were identified after Galbraith plot analysis. When excluding these 11 studies, we found that the conclusion was no different compared with the original results (OR ¼ 1.13, 95% CI: 1.01–1.26, I2 ¼ 31.0%). Publication bias For risk estimates between parental alcohol consump- tion and total CHDs, both the Begg’s funnel plot (see Supplementary Figure 6(a) for maternal alcohol Table 1. Subgroup analysis of association between alcohol consumption and congenital heart defects. Subgroup variables No. of studies Pooled OR (95% CI) Measure of heterogeneity v2 P-value I2 Maternal alcohol exposure Geographic region 55.01* 0.00001* 94.5%* North America 15 0.96 (0.90–1.02) 17.41 0.24 20.0% Europe 10 1.03 (0.94–1.13) 8.21 0.51 0.0% Oceania 1 1.51 (1.31–1.73) – – – Asia 19 2.21 (1.58–3.09) 72.49 0.00001 75.0% Study design 0.00* 0.99* 0.0%* Cohort 3 1.15 (0.87–1.53) 18.80 0.00001 89.0% Case–control study 42 1.15 (1.04–1.27) 134.41 0.00001 69.0% Alcohol exposure time 4.57* 0.10* 56.3%* Pregnancy 5 0.91 (0.73–1.14) 1.81 0.77 0.0% Pre-pregnancy and pregnancy 15 1.18 (0.98–1.42) 38.90 0.0004 64.0% First trimester 25 1.20 (1.06–1.36) 124.36 0.00001 81.0% Whether the confounding factors were adjusted 16.30* 0.00001* 93.9%* Adjusted 16 1.60 (1.29–1.97) 93.40 0.00001 84.0% Unadjusted 29 1.00 (0.93–1.09) 45.66 0.02 39.0% Quality score 0.03* 0.87* 0.0%* 7 8 1.13 (0.87–1.48) 12.44 0.09 44.0% 7 37 1.16 (1.05–1.29) 153.64 0.00001 77.0% Paternal alcohol exposure Geographic region 1.40* 0.24* 28.7%* Asia 21 1.50 (1.21–1.85) 218.43 0.00001 91.0% North America and Europe 3 1.11 (0.72–1.73) 6.73 0.03 70.0% Whether the confounding factors were adjusted 2.57* 0.11* 61.1%* Adjusted 5 2.07 (1.27–3.37) 48.99 0.00001 92.0% Unadjusted 19 1.33 (1.07–1.65) 168.94 0.00001 89.0% Quality score 0.04* 0.83* 0.0%* 7 8 1.37 (0.87–2.17) 133.64 0.00001 95.0% 7 16 1.45 (1.20–1.76) 89.60 0.00001 83.0% OR: odds ratio; CI: confidence interval. *Test for subgroup differences. 8 European Journal of Preventive Cardiology 0(00)
- 9. consumption; see Supplementary Figure 6(b) for pater- nal alcohol consumption) and Begg’s rank correlation test (P ¼ 0.002 for maternal alcohol consumption; P ¼ 0.106 for paternal alcohol consumption) indicated evidence of publication bias. Discussion Presently, the health problems caused by drinking have become a global public health problem. According to the Global Status Report on Alcohol and Health, the harmful use of alcohol kills more than three million people per year, causing more than 5% of the global disease burden.32 Meanwhile, as we all know, alcohol has been publicly defined as a teratogen.33 Therefore, an increasing amount of research is interested in the question of whether parental alcohol consumption in those periods can increase the risk of CHDs in off- spring. However, until now, study results on this issue are often inconsistent. Our meta-analysis of 55 studies, including three cohort studies and 52 case–control stu- dies, and involving 41,747 CHDs cases and 297,587 controls, with sufficient statistical power, aimed at pro- viding updated evidence to assess the association between parental alcohol consumption and the risk of total CHDs and specific CHD phenotypes in offspring, and to explore the possible dose–response pattern between parental alcohol consumption and risk of CHDs. An improved understanding of this topic may have important public health implications, given the possibility that the clear results might help guide future health education on alcohol-related health risks during pregnancy. Findings from our meta-analysis indicated that par- ents having alcohol exposure experienced a significantly increased risk of CHDs in offspring. For example, the risk of total CHDs in offspring was significantly increased by 16% among mothers experiencing alcohol exposure, and 44% among fathers having alcohol expos- ure. For specific CHD phenotypes, the present study suggested that mothers that consumed alcohol were at a significantly higher risk of TOF in offspring, compared with those without alcohol exposure. However, our study did not find a statistically significant association between parental alcohol exposure and the remaining phenotypes of CHDs because of the limited number of included studies for specific phenotypes. Additionally, our meta-analysis showed a nonlinear dose–response relationship between parental alcohol exposure and risk of total CHDs. A gradually increased risk of total CHDs was observed with the increase of parental alco- hol consumption, although there were no statistically significant differences at the level of low-exposure doses. As far as we know, to date, only three meta- analyses20–22 have been conducted on this topic. However, our study has important strengths compared with previously published meta-analyses. First, the pre- sent study focused not only on the risk of CHDs asso- ciated with maternal alcohol exposure, but also on the risk of CHDs associated with paternal alcohol expos- ure. Yet, in the past reviews,20–22 only the risk of CHDs associated with maternal alcohol consumption was con- sidered. To our knowledge, the present study is the first to conduct a meta-analysis to clarify the relationship between paternal alcohol consumption and CHD risk. Second, our findings suggested that both maternal and paternal alcohol exposure significantly increased the risk of CHDs in offspring, which has not been con- firmed by previous meta-analyses.20–22 Three published meta-analyses20–22 did not show a statistically signifi- cant difference for the risk of CHDs in offspring among mothers experiencing alcohol exposure compared with those without alcohol exposure. The possible reasons for this difference may be due to dif- ferent sample size between our study and previous reviews. Our review is the most up to date on this sub- ject. With the accumulating evidence and enlarged sample size, we have enhanced statistical power to pro- vide more precise and reliable risk estimates. Third, our study comprehensively assessed the association between parental alcohol exposure and risk of specific CHD phenotypes, and also explored the potential dose– response relationship between parental alcohol exposure and CHD risk; however, the previous reviews did not take into account these important and crit- ical issues. Furthermore, the association between parental alcohol exposure and CHD risk persists and remains statistically significant in sensitivity analysis based on various exclusion criteria. The most relevant heterogeneity moderators have been identified by sub- group analysis. Although the teratogenic effect of ethanol exposure has been fully proved, the underlying mechanisms involved in the association between parental alcohol exposure and CHD risk in offspring remain uncertain. For the association between maternal alcohol exposure and risk of CHDs, one hypothesis is that genetic-level change caused by alcohol exposure may increase the risk of CHDs. Previous studies have shown that the teratogenic effect of alcohol may induce genetic changes.33,34 Serrano et al. have confirmed that mater- nal alcohol exposure can affect the Wnt/b-catenin sig- naling pathway, which is known to promote the change of normal gene activation and cardio-genesis.35 At the same time, the interaction between gene and alcohol exposure may also lead to an increased risk of CHDs.36,37 For example, Strandberg-Larsen et al. con- firmed that mothers experiencing alcohol exposure were at a significantly higher risk of CHDs in offspring when they had certain variant alleles.38 Additionally, it has Zhang et al. 9
- 10. been hypothesized that maternal alcohol exposure may affect the development of the fetal heart through its contribution to impaired conversion of retinol to retinoic acid, antagonism of the N-methyl-d-aspartate (NMDA) receptor, compromised nutritional status, or vascular disruptive events.39 For the association between paternal alcohol expos- ure and risk of CHDs in offspring, there are few studies to explore potential mechanisms. According to previ- ous studies,40,41 the pathways of male influence on offspring can be summarized as DNA methylation, his- tone modification, and microRNA (miRNA) expres- sion. For example, it has been reported that paternal alcohol exposure can affect the change of DNA trans- mission methylation in spermatozoa, significantly decrease the activity of DNA methyltransferase, lead to CG hypomethylation, and then activate the normal silencing gene, resulting in congenital abnormality of offspring.40 Some studies also indicated that histone modification can regulate gene expression and change sperm activity, which leads to abnormal phenotypes of offspring.38,41 In addition, the pathway analysis showed that the expression of miRNA can control many car- diovascular pathways, which may lead to cardiac devel- opment defects.42 In brief, the uncertainty of underlying mechanisms between parental alcohol con- sumption and risk of CHDs in offspring warrants fur- ther research. Several limitations are relevant to our study. First, there was substantial heterogeneity among stu- dies for the association between parental alcohol expos- ure and risk of CHDs. This is not surprising, given the different study populations and methodologies. We detected the major source of heterogeneity by the sub- group analysis, the sensitivity analysis, and Galbraith plot analysis. The sensitivity analysis yielded consistent results by deleting one study at a time, or some low- quality studies or studies not controlling for any con- founding factors, and calculating the combined OR for the remaining studies. After subgroup analysis, the major source of heterogeneity was identified, including geographic region, and whether the confounding fac- tors were controlled; however, there was still evidence of heterogeneity after subgroup or sensitivity analyses, both of which indicated that our results were little affected by heterogeneity. Additionally, after Galbraith plot analysis and the further exclusion of those studies that bring about heterogeneity, although the overall estimates were slightly decreased, the hetero- geneity was significantly decreased, which indicated that multicenter, prospective, and larger-sample studies need to be carried out to further confirm our results in the future. In the meantime, we should view the results with caution because of heterogeneity. Second, although our meta-analysis assessed the risk of specific CHD phenotypes associated with parental alcohol exposure, we only relied on a small number of studies because most of the included studies did not report the risk of specific CHD phenotypes, which limited our findings. Additionally, due to the fact that most of the original studies did not detail the types of alcohol, we did not assess the association of different types of alcohol with CHDs. Future studies should emphasize the precise classification of alcohol types, as well as the specific CHD phenotypes, which would contribute to further providing accurate and refined evidence to explain the association between alcohol consumption and risk of CHDs. Third, residual confounding is of concern. Uncontrolled or unmeasured risk factors potentially produce biases. Although restricting analysis to studies that have adjusted confounding factors did not materi- ally alter the combined risk estimate, the potential effects of residual confounding might not be completely excluded. Fourth, our meta-analysis included many case–control studies because only three cohort studies were available. When data were restricted to cohort studies, we did not find a significantly positive associ- ation between maternal alcohol consumption and risk of CHDs (OR ¼ 1.15, 95% CI: 0.87–1.53), but among case–control studies, we found that maternal alcohol exposure was significantly associated with the risk of total CHDs (OR ¼ 1.15, 95% CI: 1.04–1.27). However, case–control studies are widely acknowl- edged to be prone to recall and selection biases, which restrict the strength and quality of evidence. Therefore, we should still view the results with caution because of potential bias. Fifth, because variations in the definition of alcohol exposure exist across countries and cultures, it is extremely difficult to define uniform standards, which may increase the likelihood of mis- classification bias. Sixth, potential publication bias could influence the findings. In our review, both the Begg’s funnel plot and Begg’s rank correlation test indi- cated evidence of publication bias. Additionally, our study did not compare the effect of paternal and mater- nal alcohol consumption on the risk of CHDs, which thus remains to be explained by further studies. Last but not least, because the present review only included studies published in Chinese or English, additional research in other populations is warranted to generalize the findings. In summary, our meta-analysis, which includes a large proportion of participants, giving it sufficient stat- istical power, aims to address the association between parental alcohol exposure and risk of CHDs in off- spring. Although the role of potential bias and evidence of heterogeneity should be carefully evaluated, our study indicates that parents with alcohol exposure are at a significantly higher risk of CHDs in offspring 10 European Journal of Preventive Cardiology 0(00)
- 11. compared with those without alcohol consumption. Additionally, there is a nonlinear dose–response rela- tionship between parental alcohol exposure and risk of CHDs. With an increase in parental alcohol consump- tion, the risk of CHDs in offspring also gradually increased. Therefore, our findings highlight the necessity of improving health awareness to prevent alcohol expos- ure during the preconception and conception periods. Acknowledgement The authors would like to thank the editors and reviewers for their suggestions. Author contributions SMZ and JBQ contributed to the conception or design of the work. SMZ, LZC, TBY, LSW, TTW, LJZ, LTC, ZWY, ZZ, and JBQ contributed to the acquisition, analysis, or interpret- ation of data for the work. SMZ and JBQ drafted the manu- script and critically revised the manuscript. All authors gave final approval and agree to be accountable for all aspects of work ensuring integrity and accuracy. Declaration of conflicting interests The author(s) declared no potential conflicts of interest with respect to the research, authorship, and/or publication of this article. Funding The author(s) disclosed receipt of the following financial sup- port for the research, authorship, and/or publication of this article: JBQ was supported by the project funded by the Natural Science Foundation of Hunan Province (grant number 2018JJ2551), the National Natural Science Foundation Program of China (grant number 81803313), the Hunan Provincial Key Research and Development Program (grant numbers 2018SK2063 and 2018SK2062), and the New Teachers’ Scientific Research Driven Foundation of Central South University (grant number 502045001). References 1. Krasuski RA and Bashore TM. Congenital heart disease epidemiology in the United States. Circulation 2016; 134: 110–113. 2. Tsilimigras DI, Oikonomou EK, Moris D, et al. Stem cell therapy for congenital heart disease. Circulation 2017; 136: 2373–2385. 3. Saxena A, Mehta A, Sharma M, et al. Birth prevalence of congenital heart disease: a cross-sectional observational study from North India. Ann Pediatr Cardiol 2016; 9: 205–209. 4. Liu X, Nie Z, Chen J, et al. Does maternal environmental tobacco smoke interact with social-demographics and environmental factors on congenital heart defects? Environ Pollut 2018; 234: 214–222. 5. Wang T, Chen L, Yang T, et al. Congenital heart disease and risk of cardiovascular disease: a meta-analysis of cohort studies. J Am Heart Assoc 2019; 8: e12030. 6. Liu Y, Chen S, Zuhlke L, et al. Global birth prevalence of congenital heart defects 1970-2017: updated systematic review and meta-analysis of 260 studies. Int J Epidemiol 2019; 48: 455–463. 7. Wang C, Xie L, Zhou K, et al. Increased risk for con- genital heart defects in children carrying the ABCB1 Gene C3435T polymorphism and maternal periconcep- tional toxicants exposure. PLoS One 2013; 8: e68807. 8. Liu S, Liu J, Tang J, et al. Environmental risk factors for congenital heart disease in the Shandong Peninsula, China: a hospital-based case–control study. J Epidemiol 2009; 19: 122–130. 9. Hoyme HE, May PA, Kalberg WO, et al. A practical clinical approach to diagnosis of fetal alcohol spectrum disorders: clarification of the 1996 institute of medicine criteria. Pediatrics 2005; 115: 39–47. 10. Burd L, Deal E, Rios R, et al. Congenital heart defects and fetal alcohol spectrum disorders. Congenit Heart Dis 2007; 2: 250–255. 11. Feng Y, Cai J, Tong X, et al. Non-inheritable risk factors during pregnancy for congenital heart defects in off- spring: a matched case-control study. Int J Cardiol 2018; 264: 45–52. 12. Xu X, Qi G, Lu L, et al. Influencing factors of congenital heart disease in plateau region: a case-control study. Chin Prev Med 2018; 19: 1–4. 13. Stingone JA, Luben TJ, Carmichael SL, et al. Maternal exposure to nitrogen dioxide, intake of methyl nutrients, and congenital heart defects in offspring. Am J Epidemiol 2017; 186: 719–729. 14. Xiang O. Case control study of congenital heart disease related factors in perinatal infants in Wenzhou. Dis Surveillance 2017; 32: 504–508. 15. Guo Y, Liu J, Zheng L, et al. Analysis of risk factors of congenital heart disease in Xi’an and Xianyang area from 2011 to 2014. Clin Misdiagn and Misther 2016; 29: 80–83. 16. Ou Y, Mai J, Zhuang J, et al. Risk factors of different congenital heart defects in Guangdong, China. Pediatr Res 2016; 79: 549–558. 17. Li J and Li Y. Influencing factors analysis on 151 cases of congenital heart disease children. Chin J Clin (electronic version) 2016; 10: 641–644. 18. Liu X, Qiu X, Liu W, et al. Analysis of influencing fac- tors on perinatal congenital heart disease in Guangxi. Chin J Birth Health and Hered 2016; 24: 88–91. 19. Lv G, Chen Z and Xu Z. High risk factors of fetal con- genital heart diseases: a case-control analysis. Matern and Child Health Care of Chin 2016; 31: 3818–3820. 20. Yang J, Qiu H, Qu P, et al. Prenatal alcohol exposure and congenital heart defects: a meta-analysis. PLoS One 2015; 10: e130681. 21. Sun J, Chen X, Chen H, et al. Maternal alcohol consump- tion before and during pregnancy and the risks of con- genital heart defects in offspring: a systematic review and meta-analysis. Congenit Heart Dis 2015; 10: E216–E224. 22. Wen Z, Yu D, Zhang W, et al. Association between alco- hol consumption during pregnancy and risks of congeni- tal heart defects in offspring: meta-analysis of epidemiological observational studies. Ital J Pediatr 2016; 42: 1–12. Zhang et al. 11
- 12. 23. Moher D, Liberati A, Tetzlaff J, et al. Preferred reporting items for systematic reviews and meta-analyses: the PRISMA statement. Int J Surg 2010; 8: 336–341. 24. Baardman ME, Kerstjens-Frederikse WS, Corpeleijn E, et al. Combined adverse effects of maternal smoking and high body mass index on heart development in offspring: evidence for interaction? Heart 2012; 98: 474–479. 25. Williams LJ, Correa A and Rasmussen S. Maternal lifestyle factors and risk for ventricular septal defects. Birth Defects Res A Clin Mol Teratol 2004; 70: 59–64. 26. Wells GA, Shea B, O’Connell D, et al. The Newcastle-Ottawa scale (NOS) for assessing the quality if non-randomized studies in meta-analysis, http://www. ohri.ca/programs/clinical_epidemiology/oxford.asp (2011, accessed 24 July 2019). 27. Higgins JP, Thompson SG, Deeks JJ, et al. Measuring inconsistency in meta-analyses. BMJ 2003; 327: 557–560. 28. Bax L, Ikeda N, Fukui N, et al. More than numbers: the power of graphs in meta-analysis. Am J Epidemiol 2008; 169: 249–255. 29. Egger M, Davey SG, Schneider M, et al. Bias in meta- analysis detected by a simple, graphical test. BMJ 1997; 315: 629–634. 30. Greenland S and Longnecker MP. Methods for trend estimation from summarized dose-response data, with applications to meta-analysis. Am J Epidemiol 1992; 135: 1301–1309. 31. Patra J, Bakker R, Irving H, et al. Dose-response rela- tionship between alcohol consumption before and during pregnancy and the risks of low birthweight, preterm birth and small for gestational age (SGA)-a systematic review and meta-analyses. BJOG 2011; 118: 1411–1421. 32. World Health Organization. Global status report on alcohol and health 2018 (Geneva), https://www.who.int/ substance_abuse/publications/global_alcohol_report/en/ (2018, accessed 24 July 2019). 33. Burd L, Deal E, Rios R, et al. Congenital heart defects and fetal alcohol spectrum disorders. Congenit Heart Dis 2007; 2: 250–255. 34. Grewal J, Carmichael SL, Ma C, et al. Maternal pericon- ceptional smoking and alcohol consumption and risk for select congenital anomalies. Birth Defects Res A Clin Mol Teratol 2008; 82: 519–526. 35. Serrano M, Han M, Brinez P, et al. Fetal alcohol syn- drome: cardiac birth defects in mice and prevention with folate. Am J Obstet Gynecol 2010; 203: 75–77. 36. Shi J, Zhao W, Pan B, et al. Alcohol exposure causes overexpression of heart development-related genes by affecting the histone H3 acetylation via BMP signaling pathway in cardiomyoblast cells. Alcohol Clin Exp Res 2017; 41: 87–95. 37. Krauss RS and Hong M. Gene-environment interactions and the etiology of birth defects. Curr Top Dev Biol 2016; 116: 569. 38. Strandberg-Larsen K, Skov-Ettrup LS, Grønbaek M, et al. Maternal alcohol drinking pattern during preg- nancy and the risk for an offspring with an isolated con- genital heart defect and in particular a ventricular septal defect or an atrial septal defect. Birth Defects Res A Clin Mol Teratol 2011; 91: 616–622. 39. Carmichael SL, Shaw GM, Yang W, et al. Maternal peri- conceptional alcohol consumption and risk for conotrun- cal heart defects. Birth Defects Res A Clin Mol Teratol 2003; 67: 875–878. 40. Day J, Savani S, Krempley BD, et al. Influence of pater- nal preconception exposures on their offspring: through epigenetics to phenotype. Am J Stem Cells 2016; 5: 11–18. 41. Abel E. Paternal contribution to fetal alcohol syndrome. Addict Biol 2004; 9: 127–133, 135–136. 42. Mahnke AH, Salem NA, Tseng AM, et al. Nonprotein- coding RNAs in fetal alcohol spectrum disorders. Prog Mol Biol Transl Sci 2018; 157: 299–342. 12 European Journal of Preventive Cardiology 0(00)