Downloaded 766 times
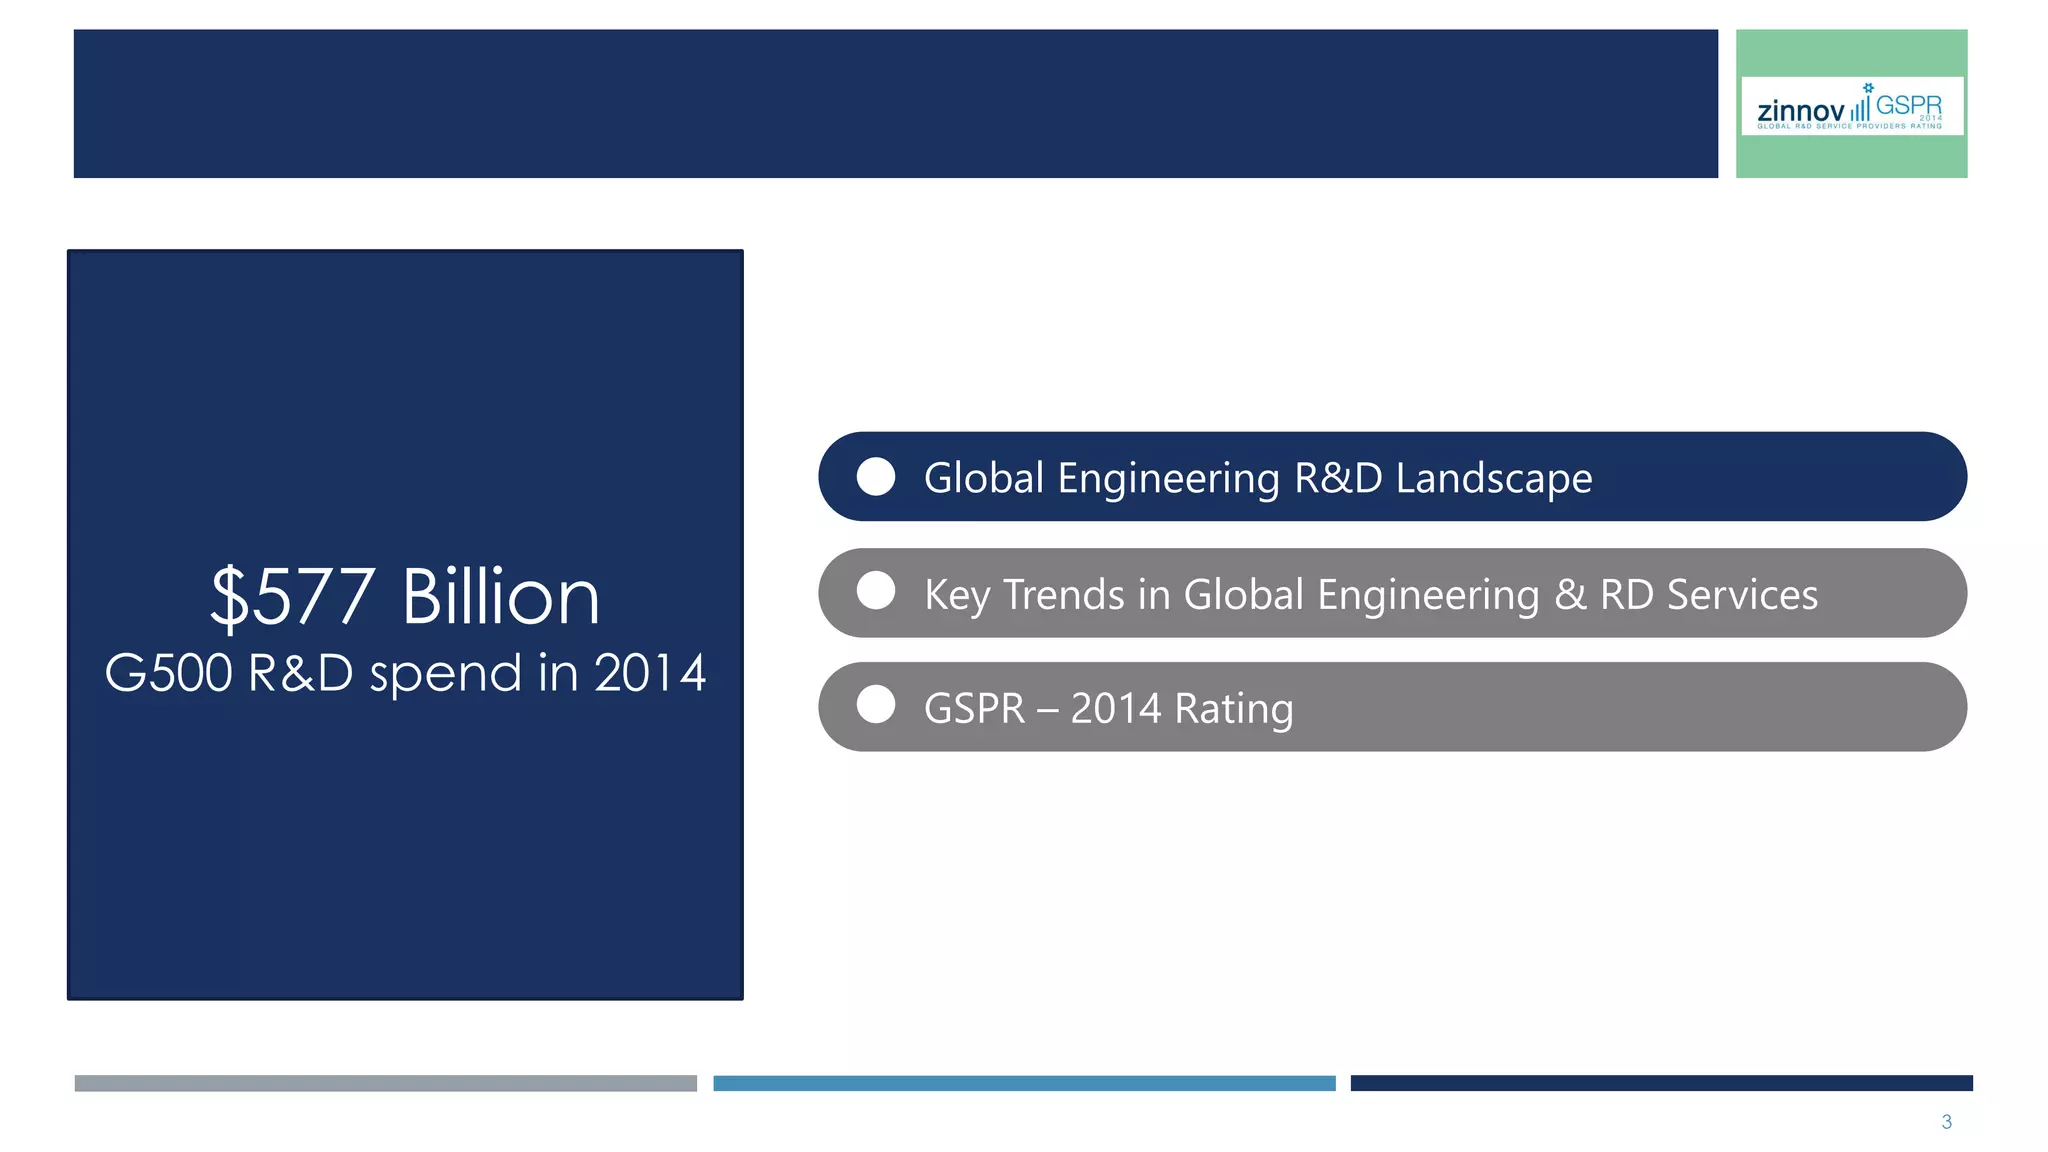
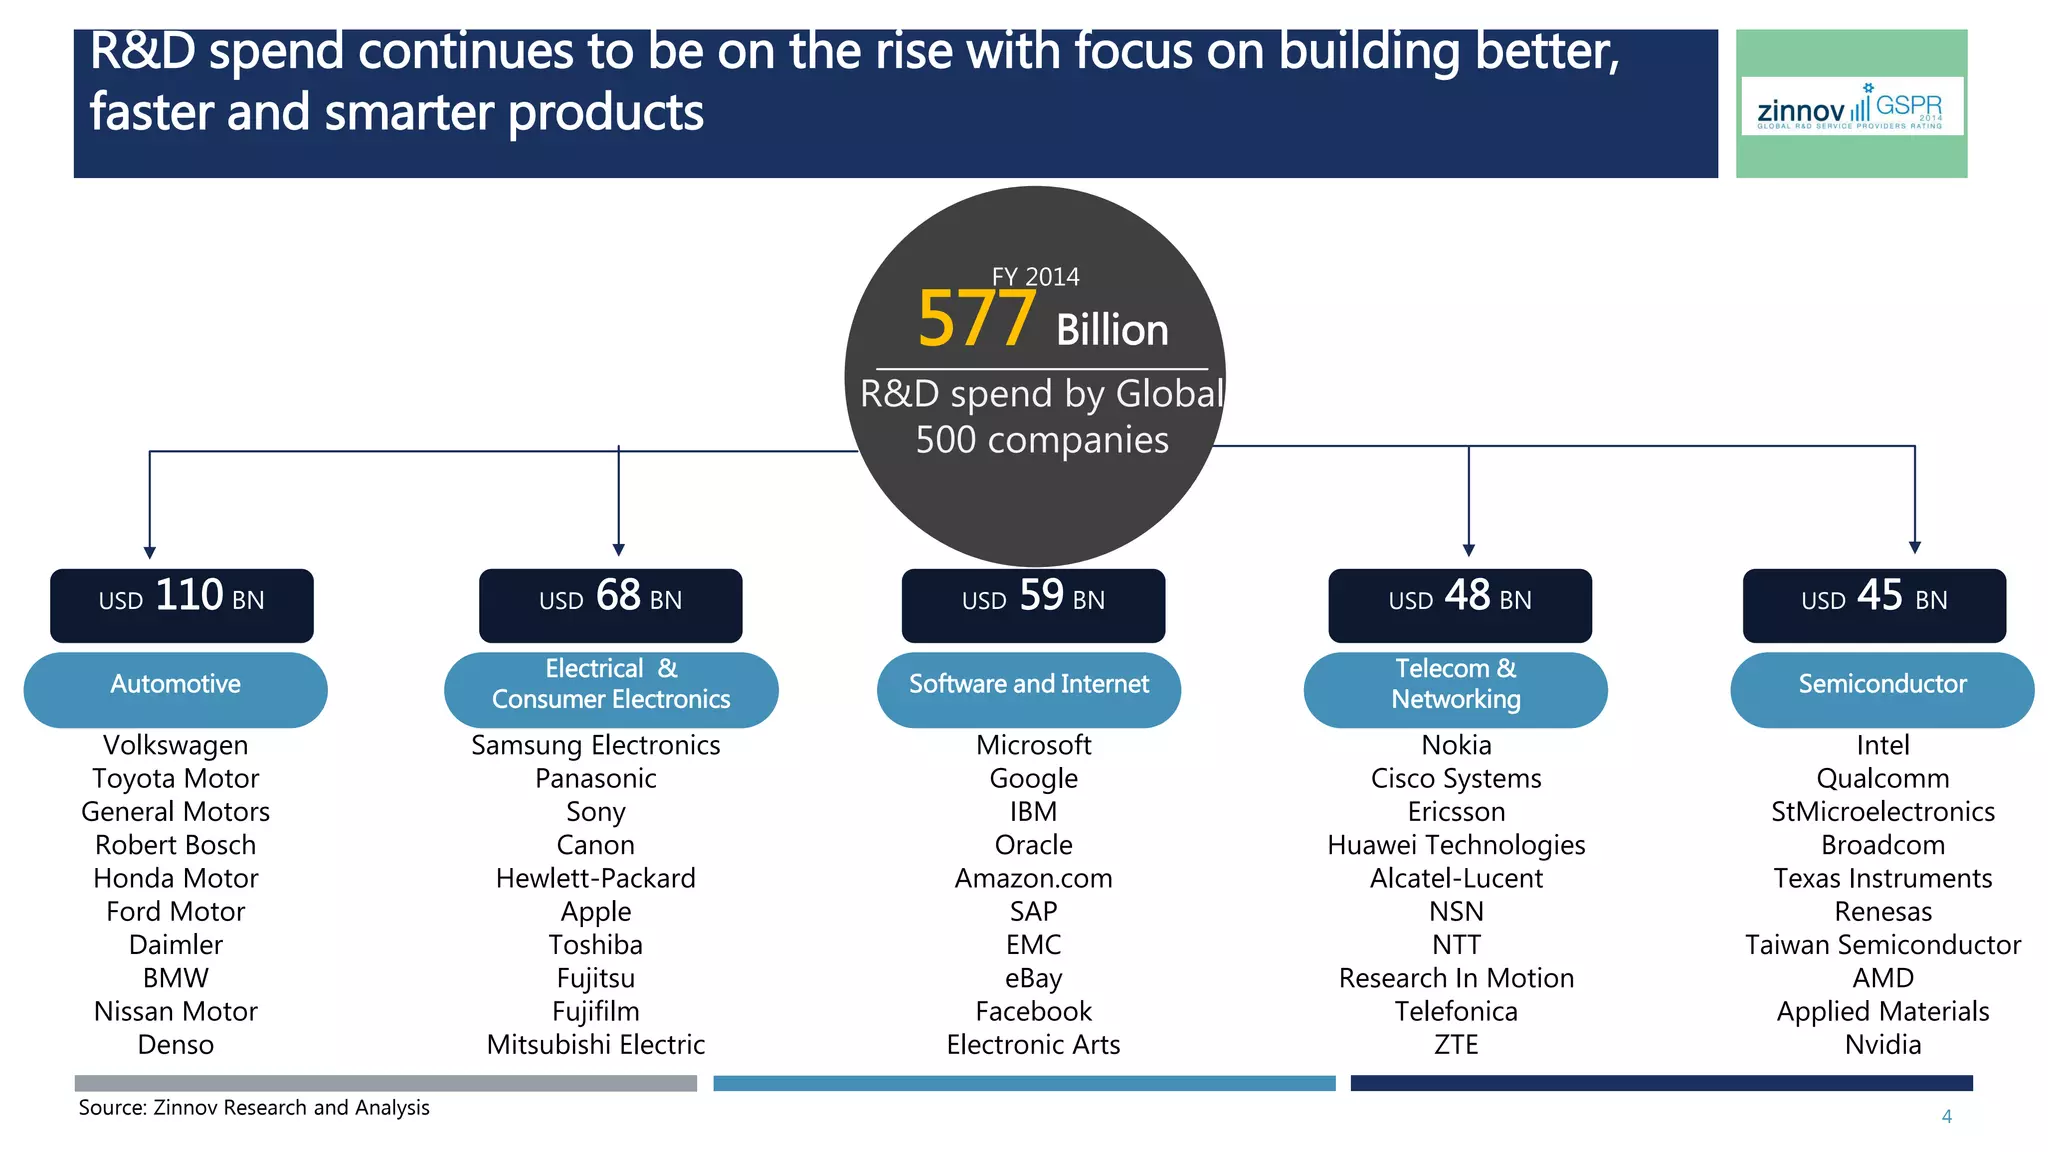
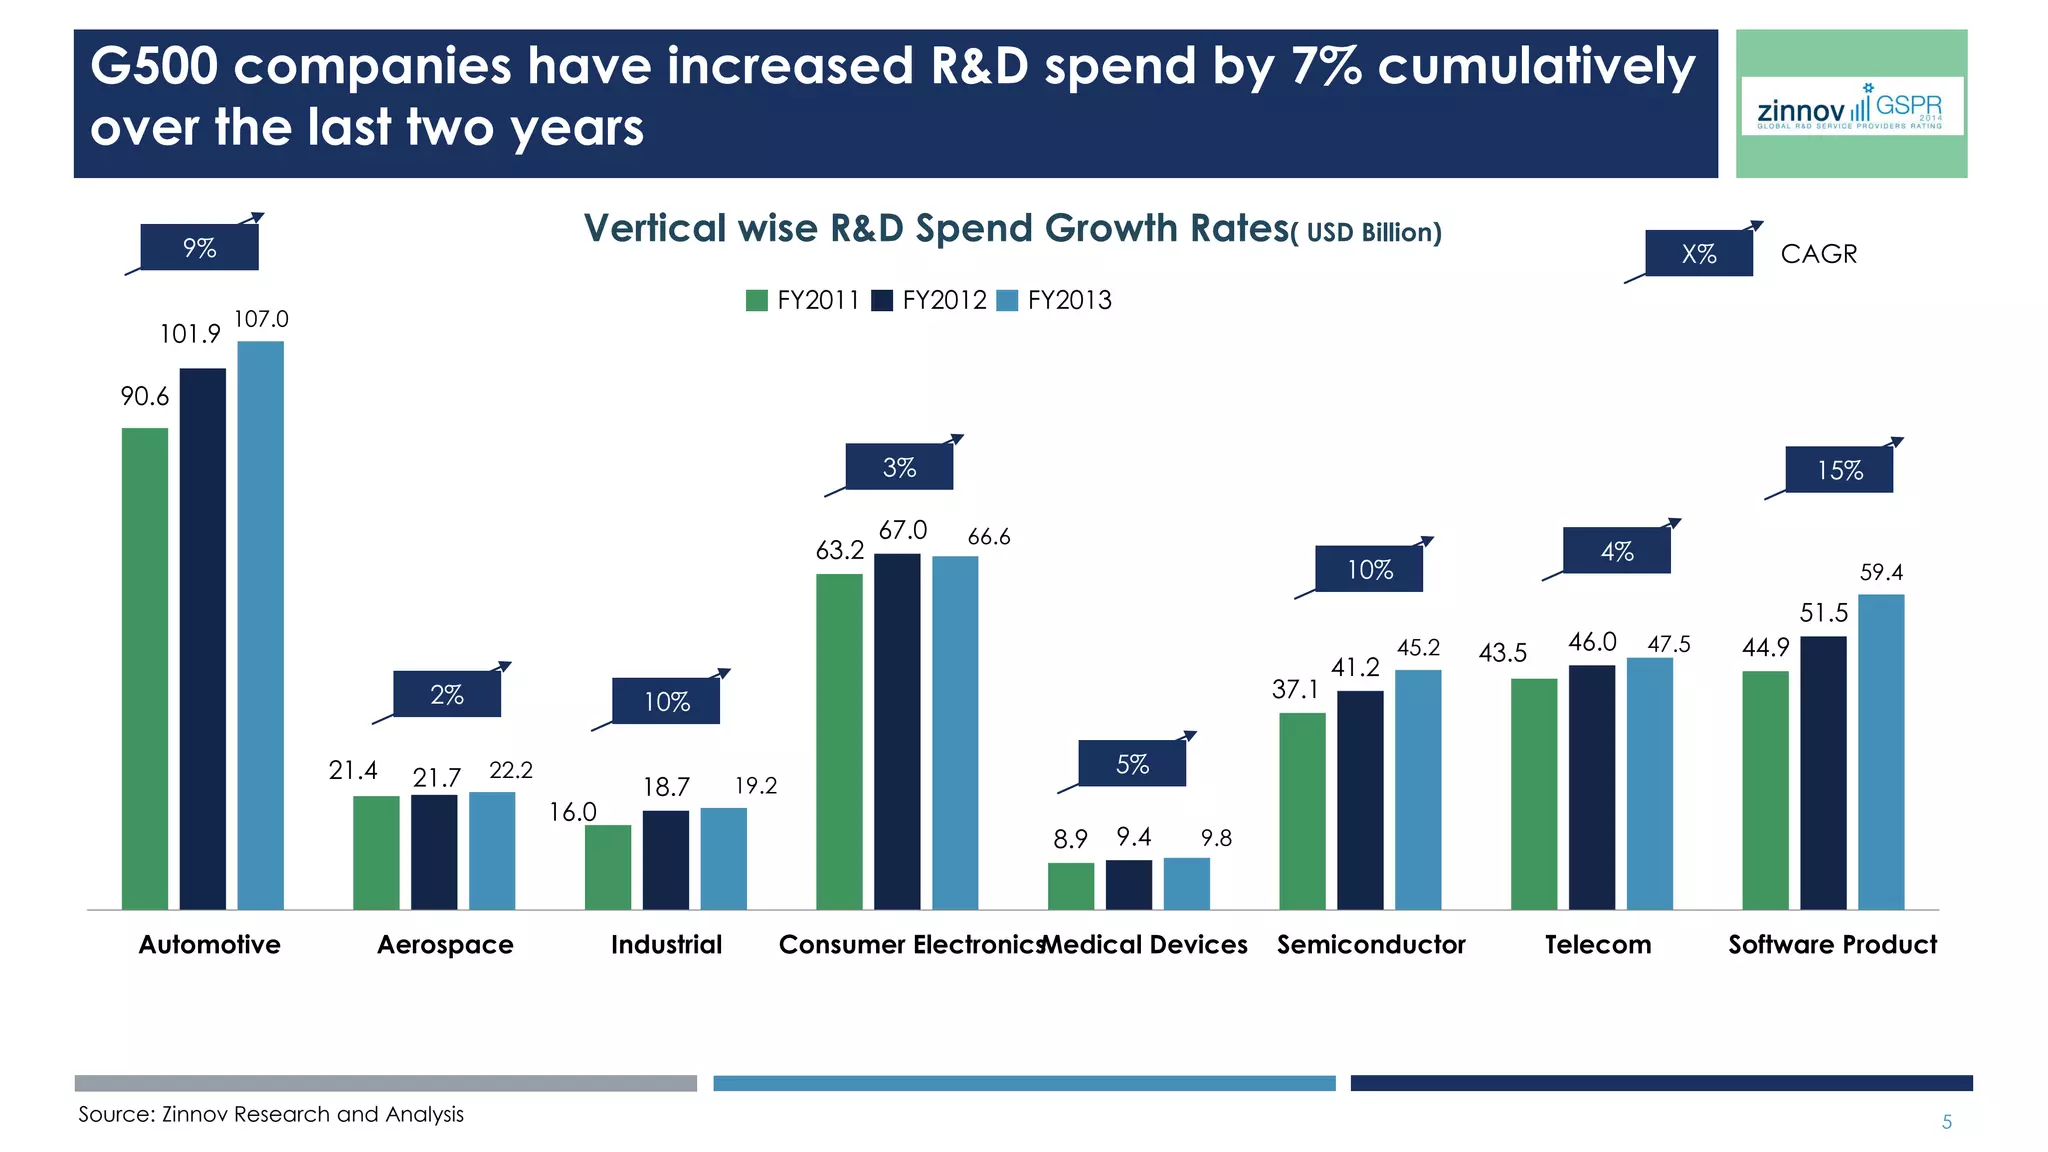
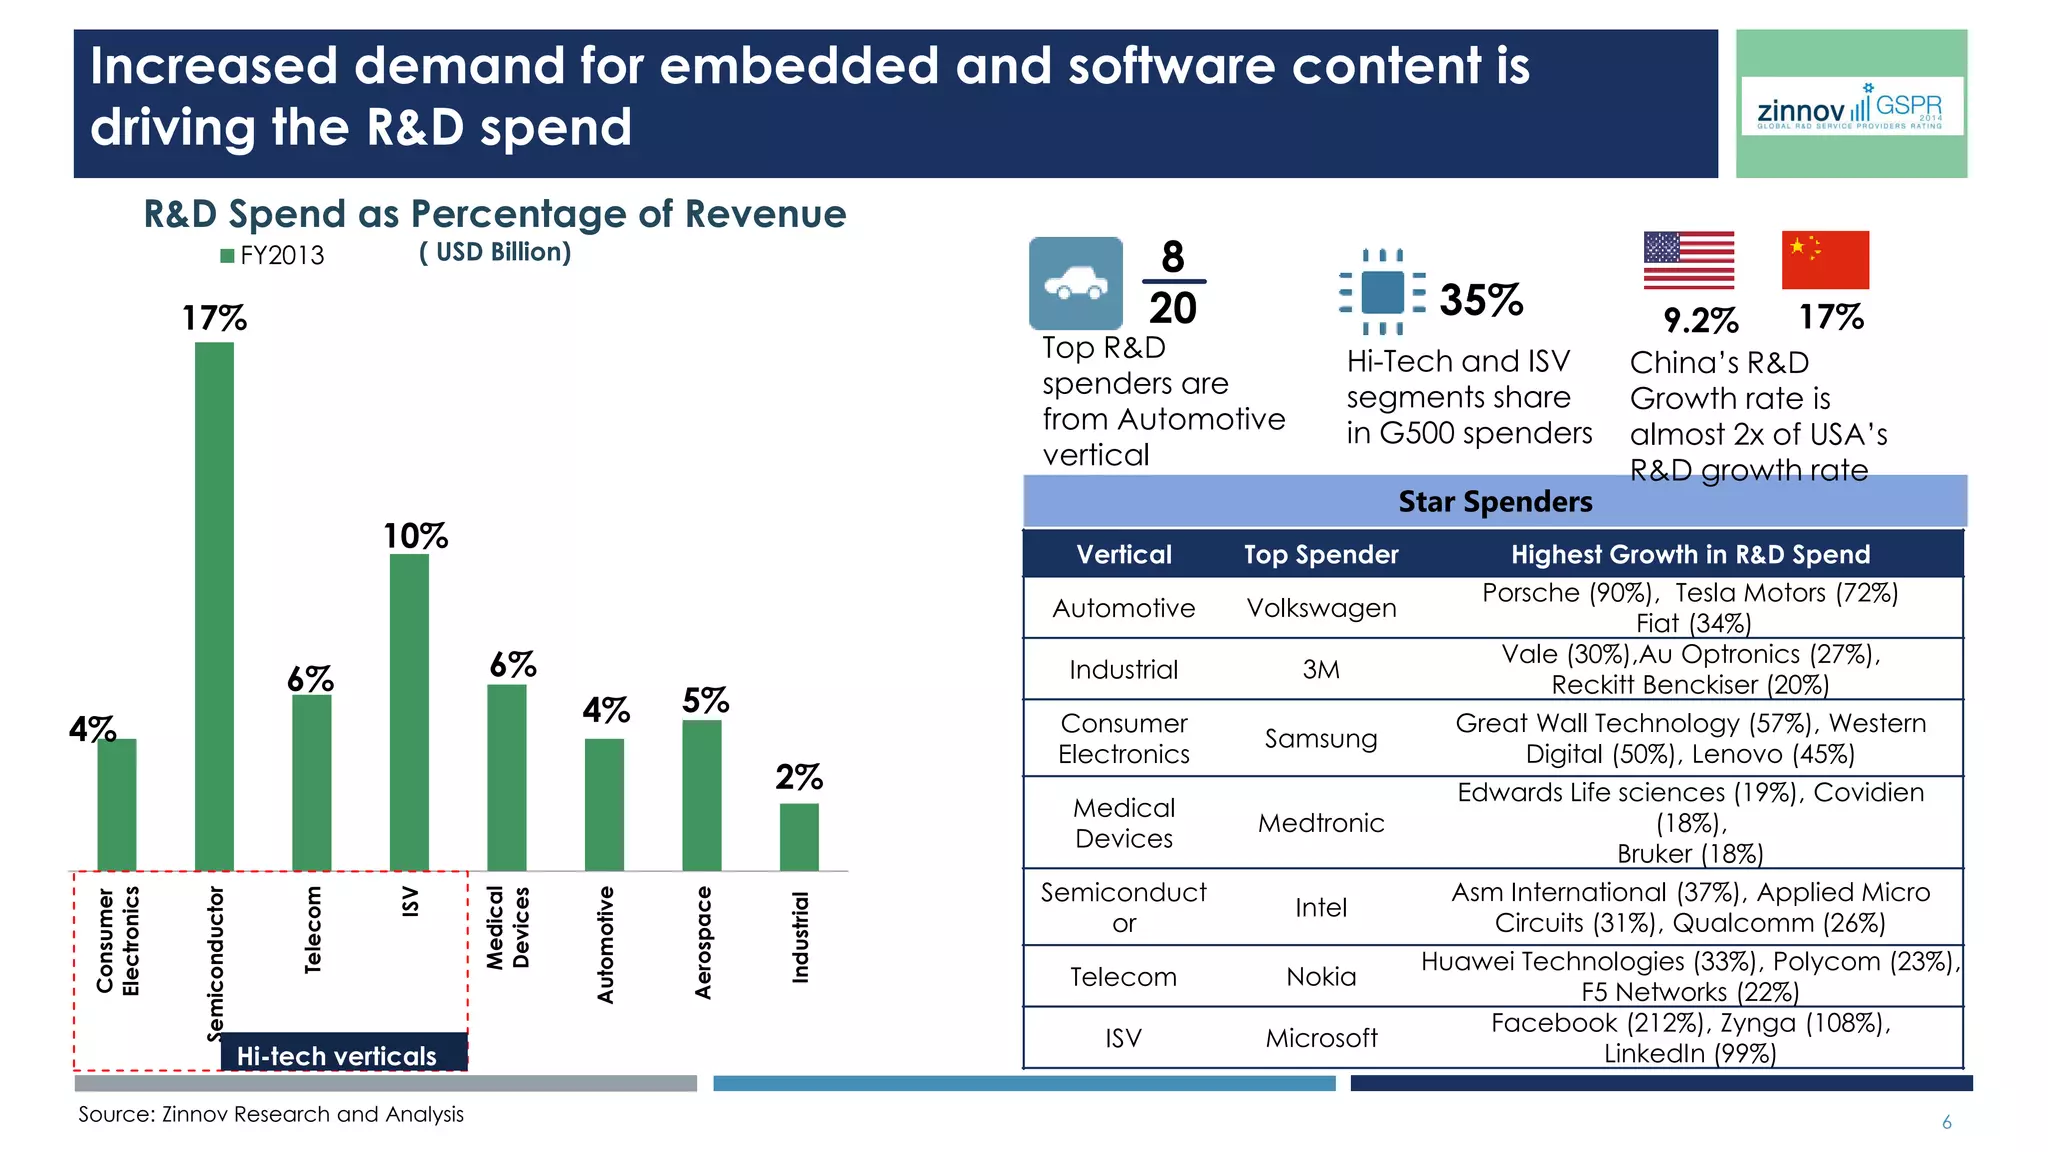
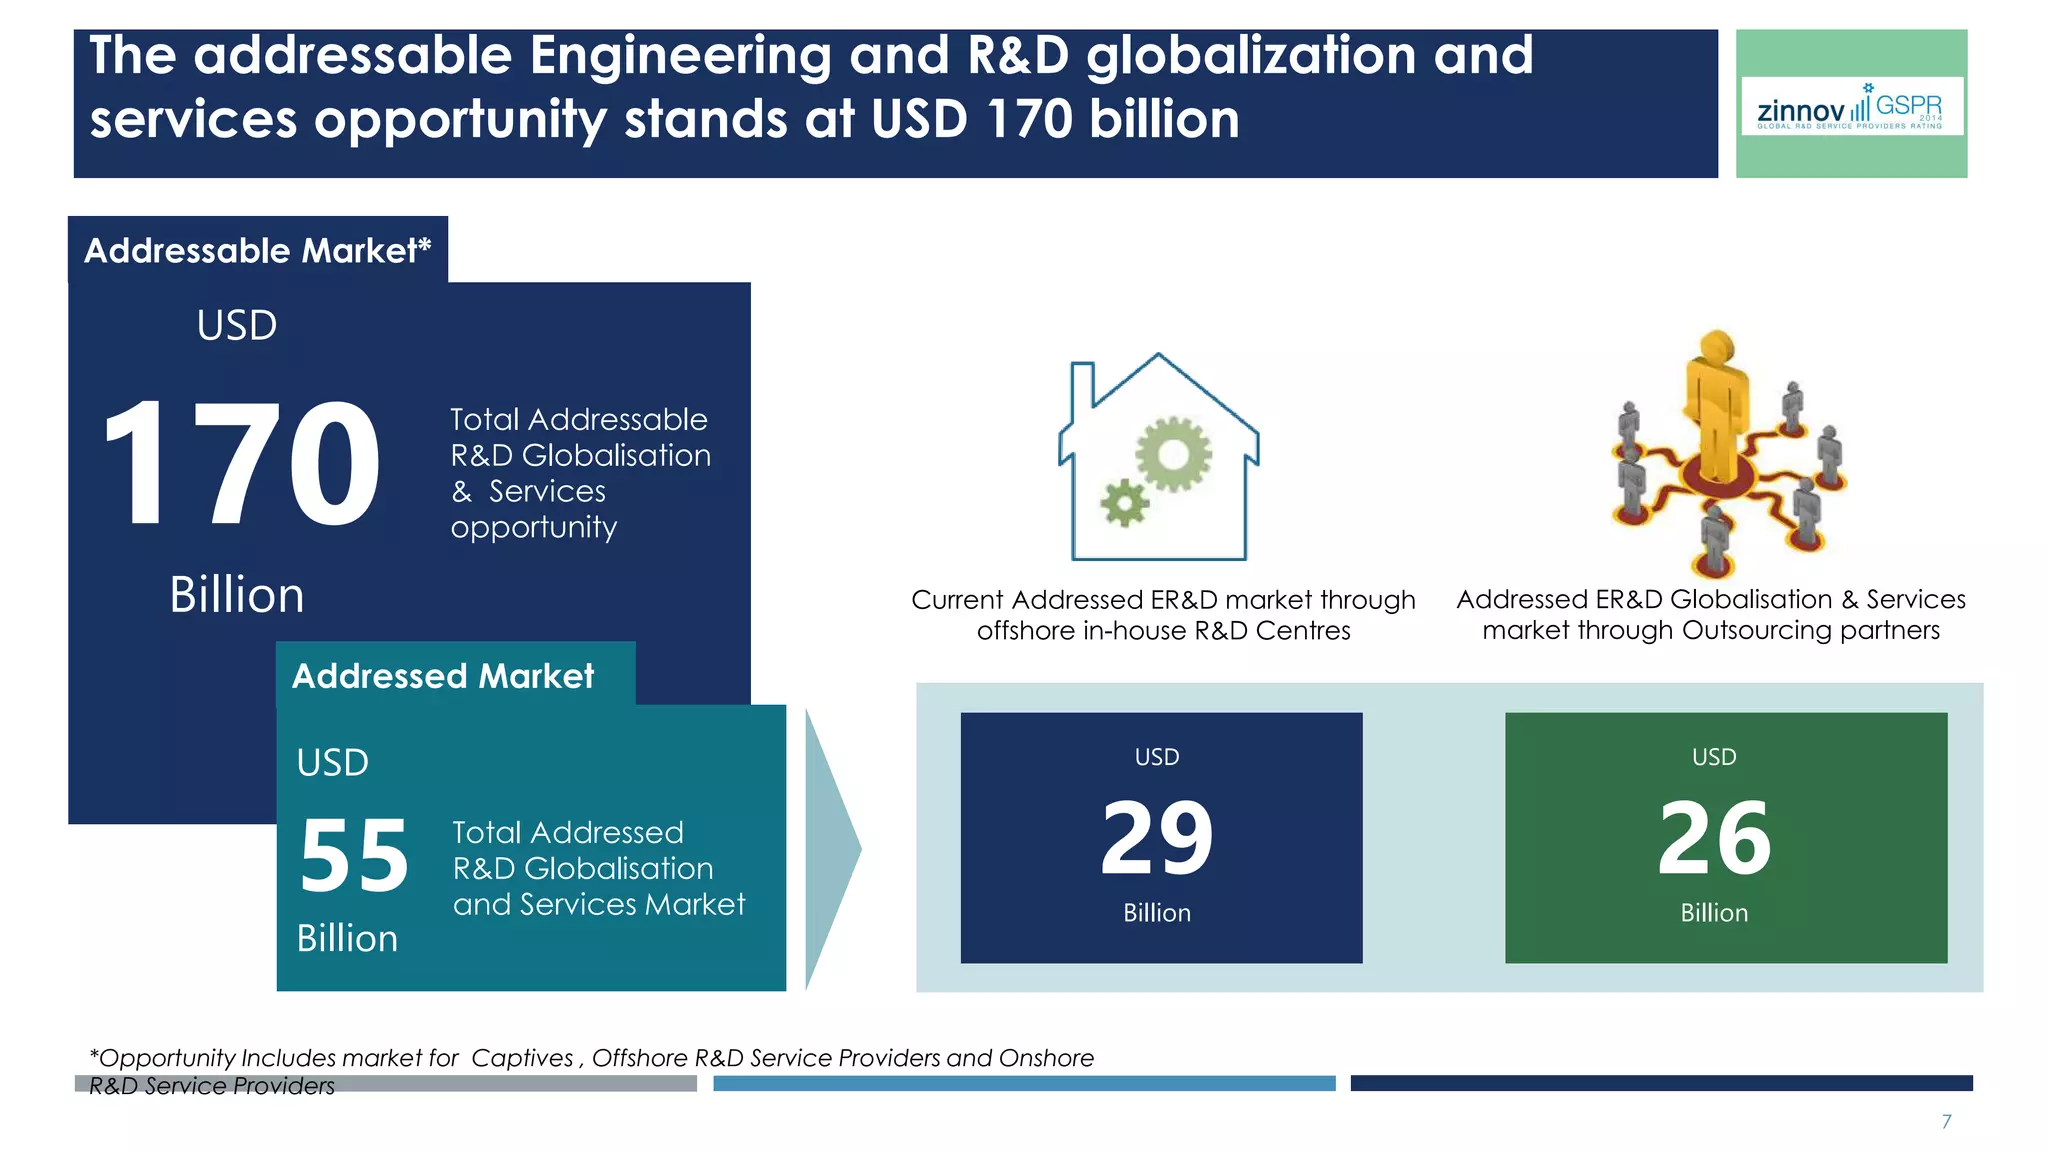
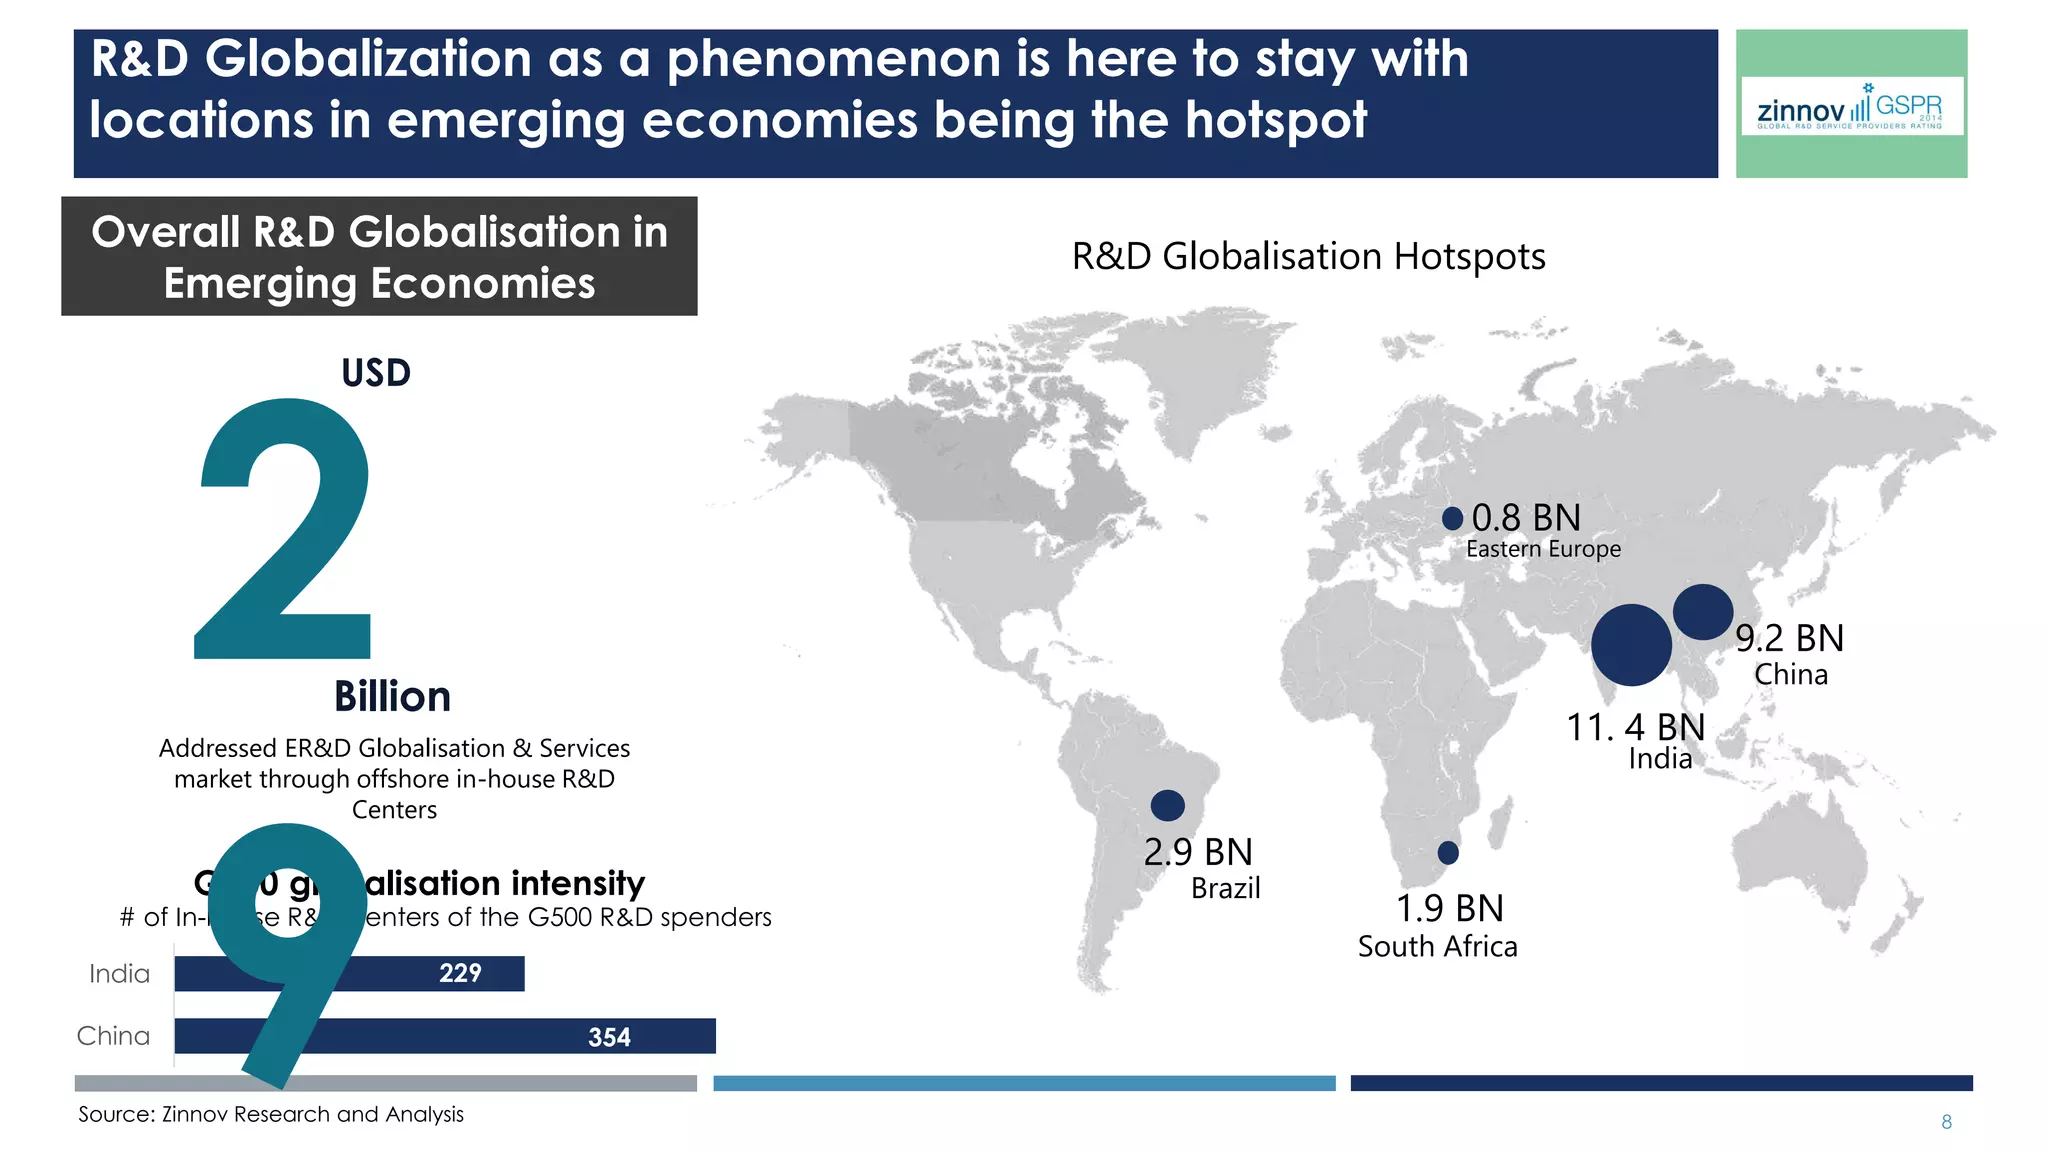
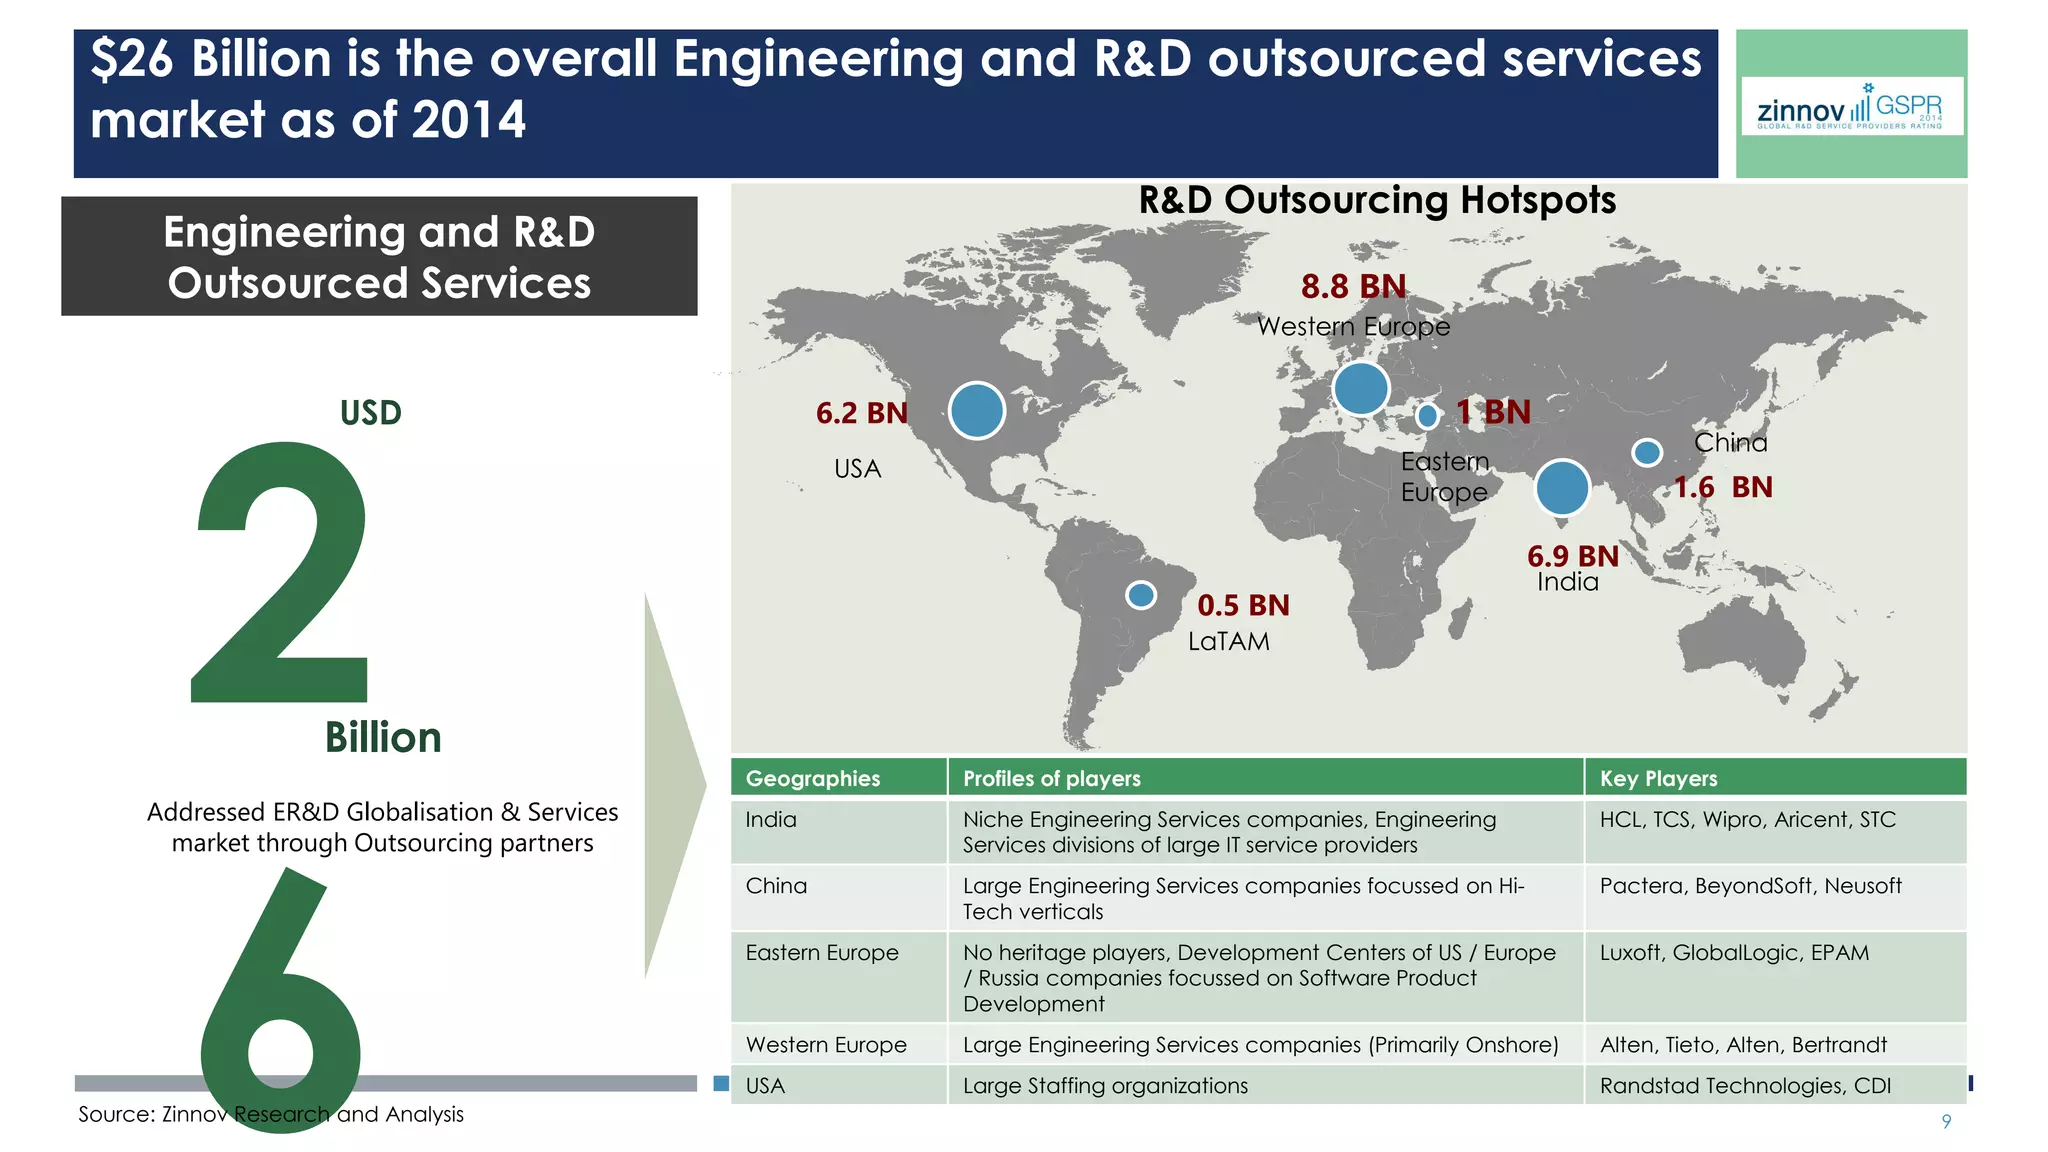
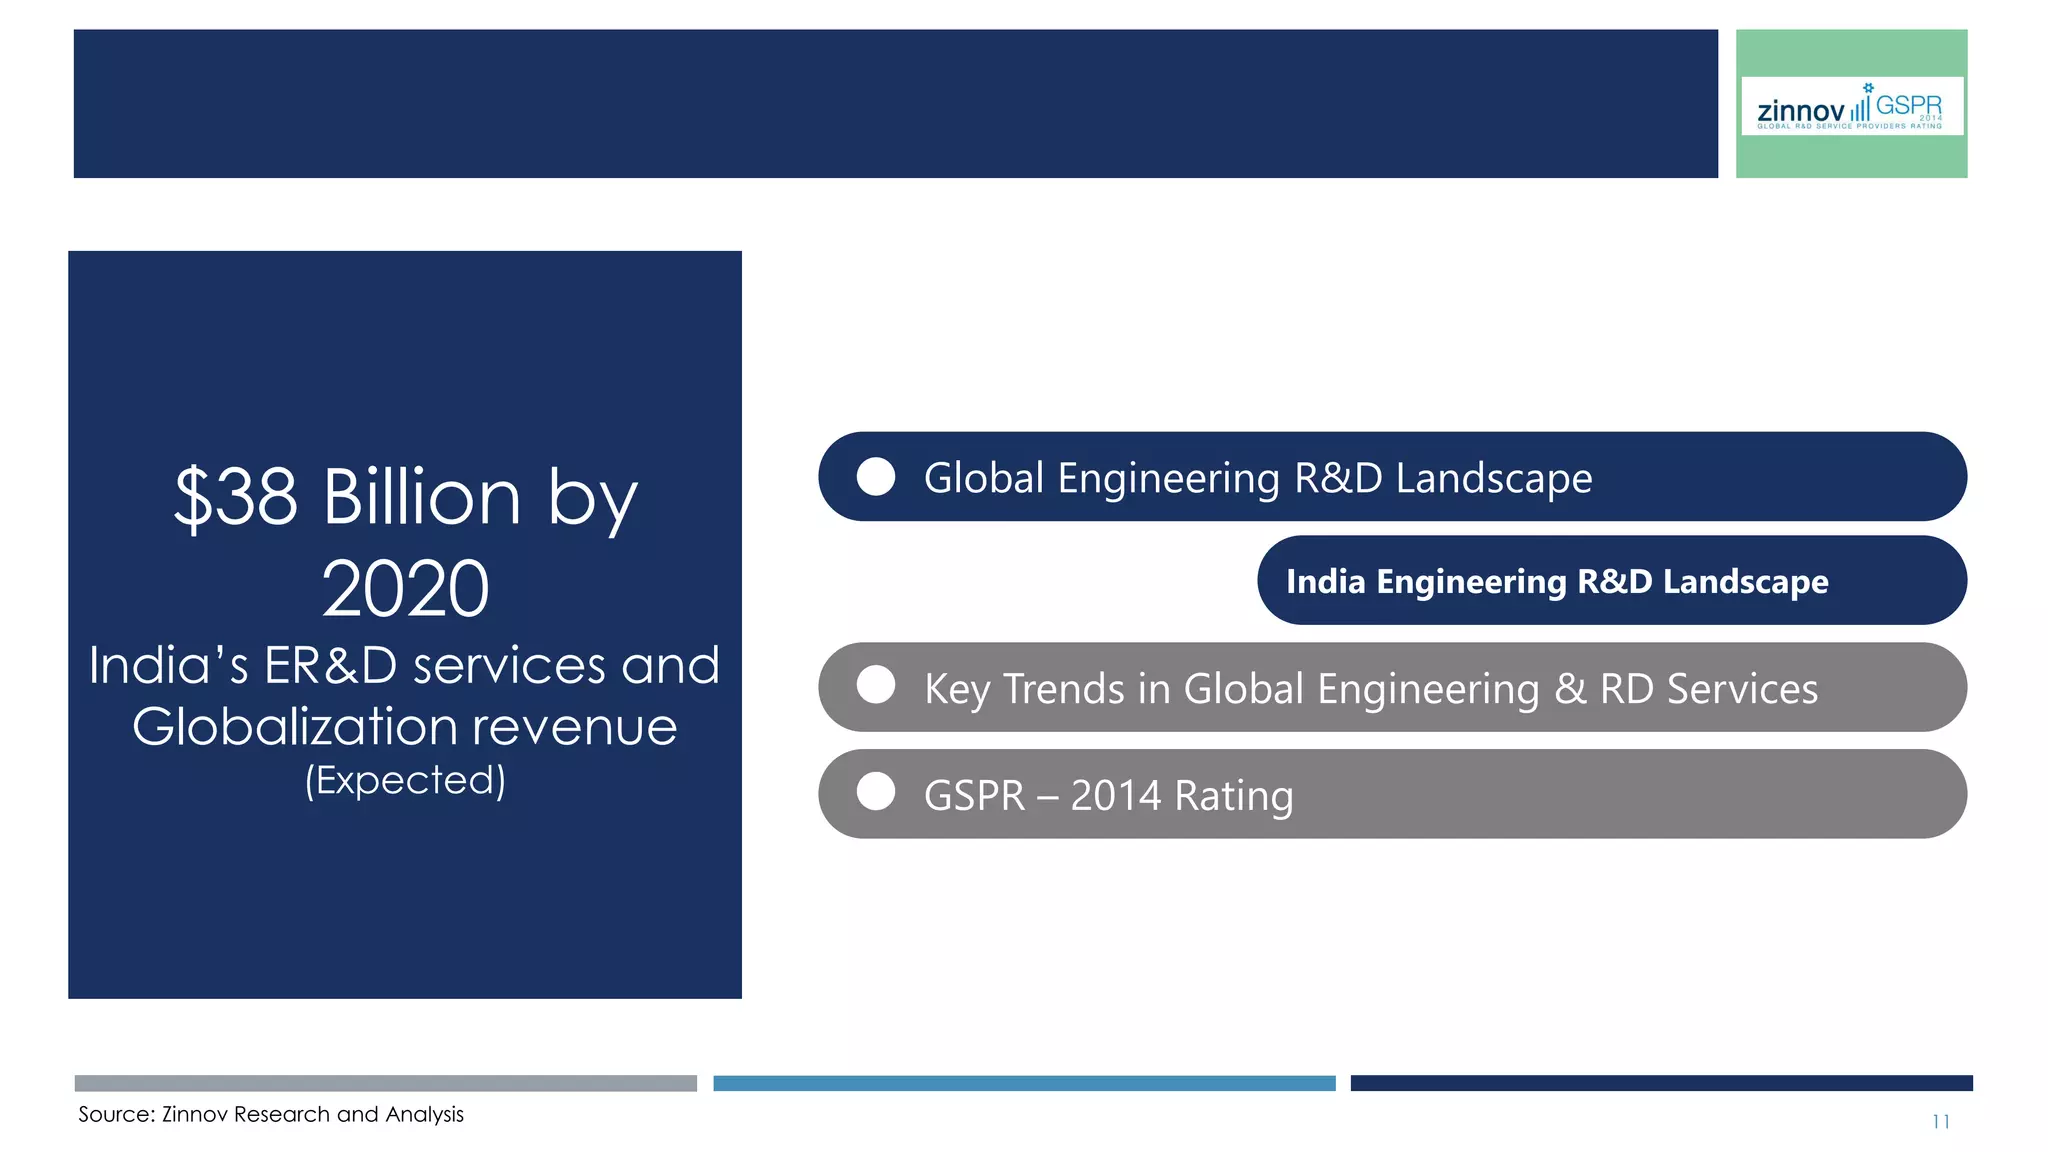
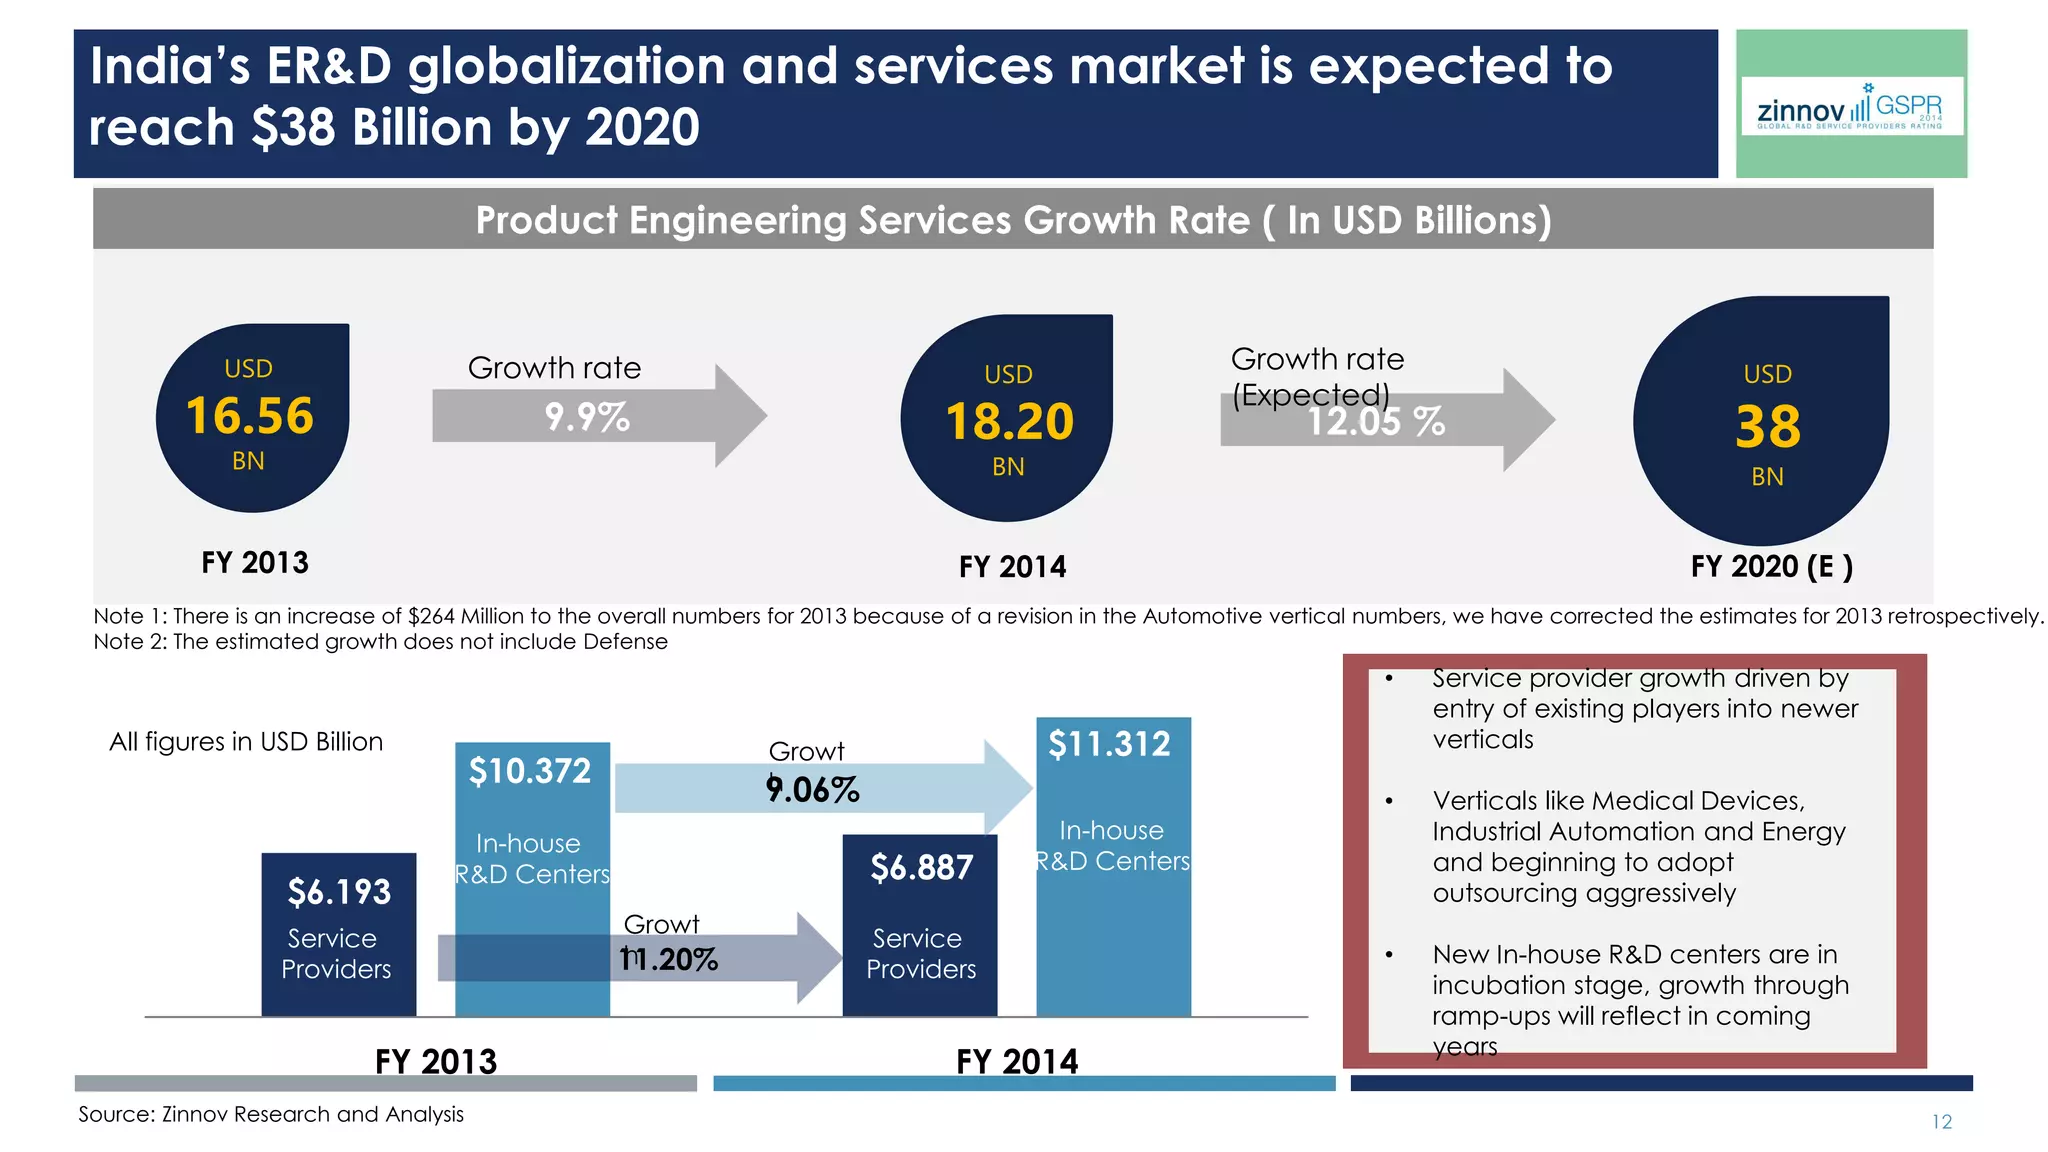
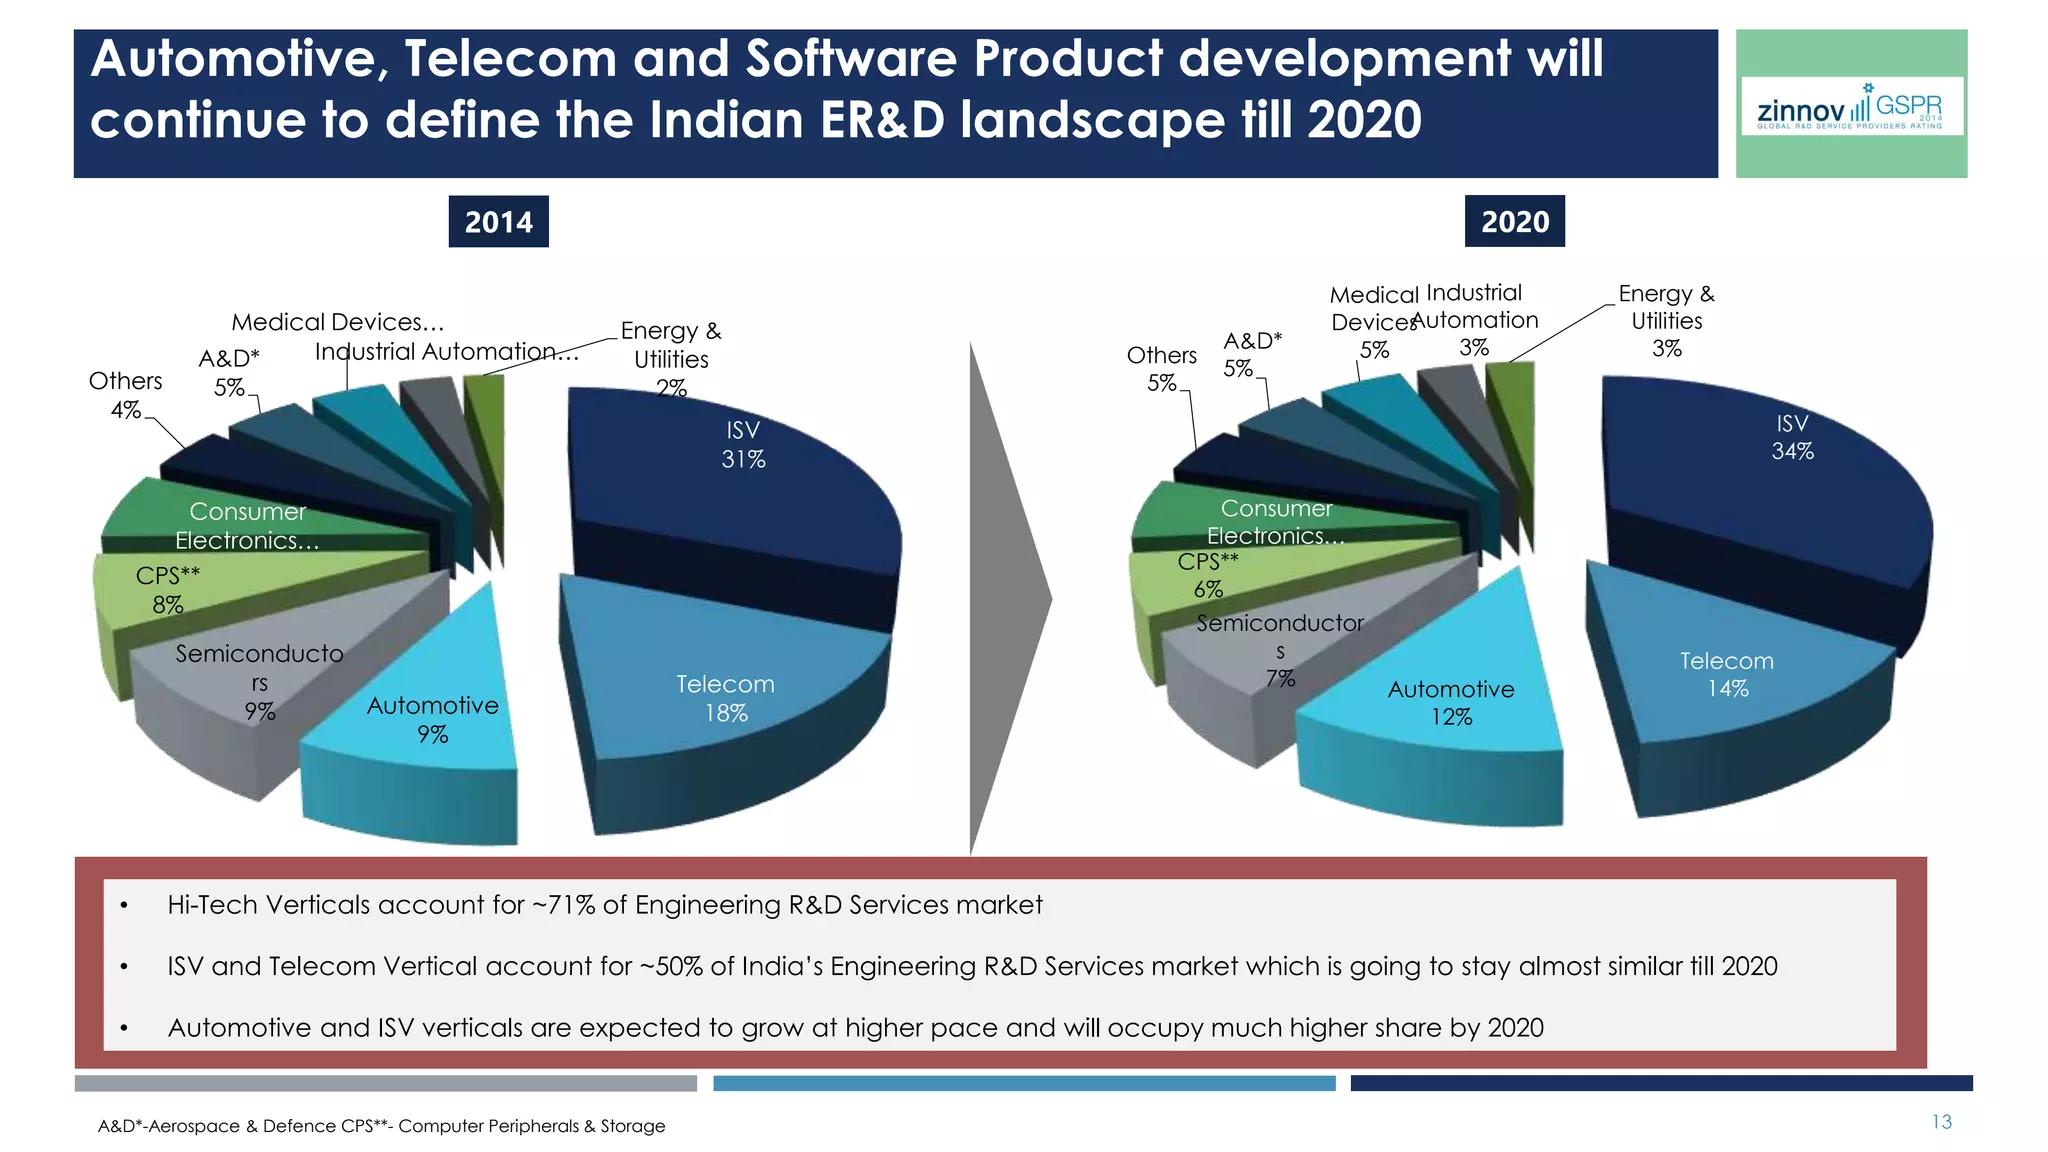
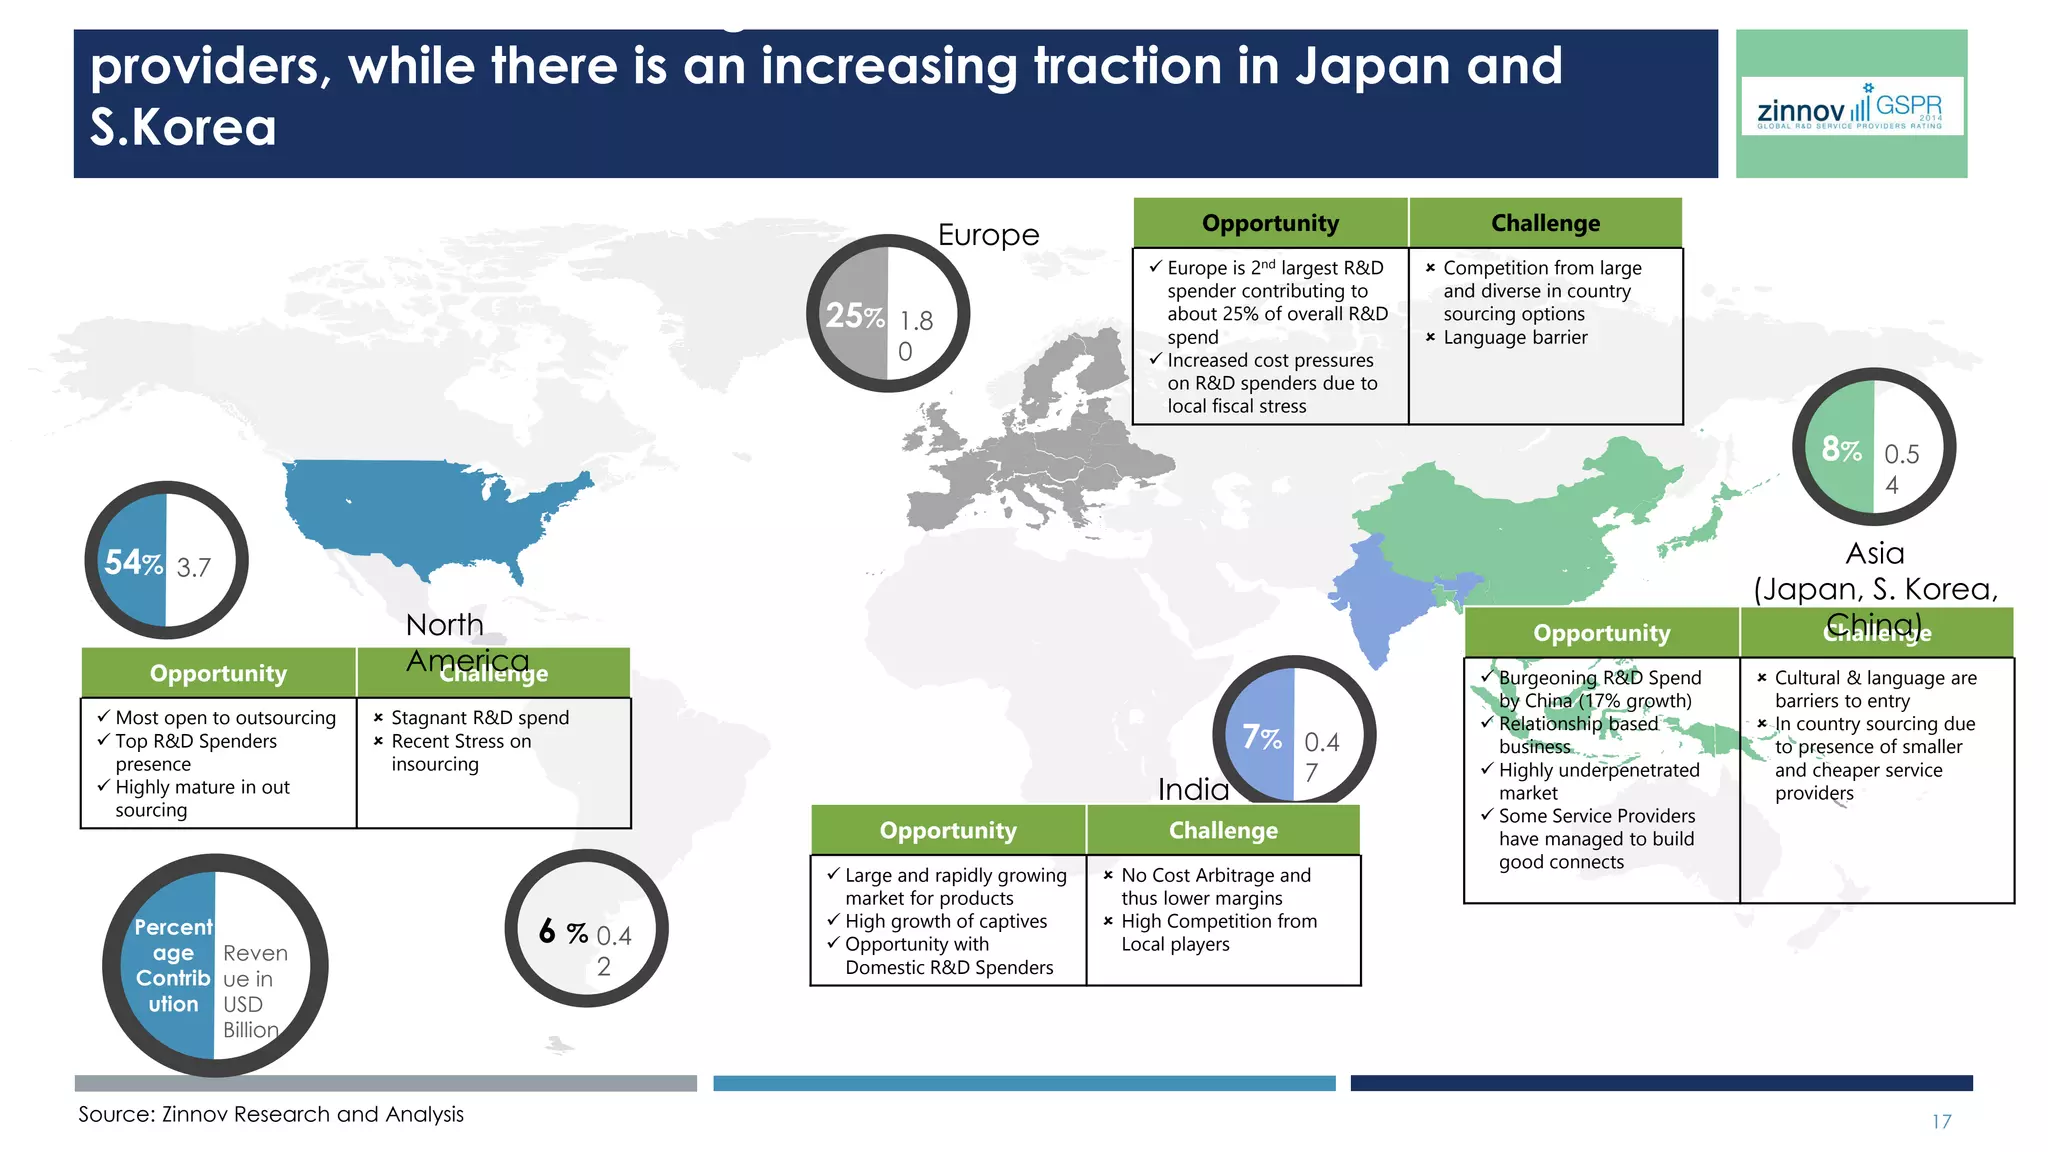
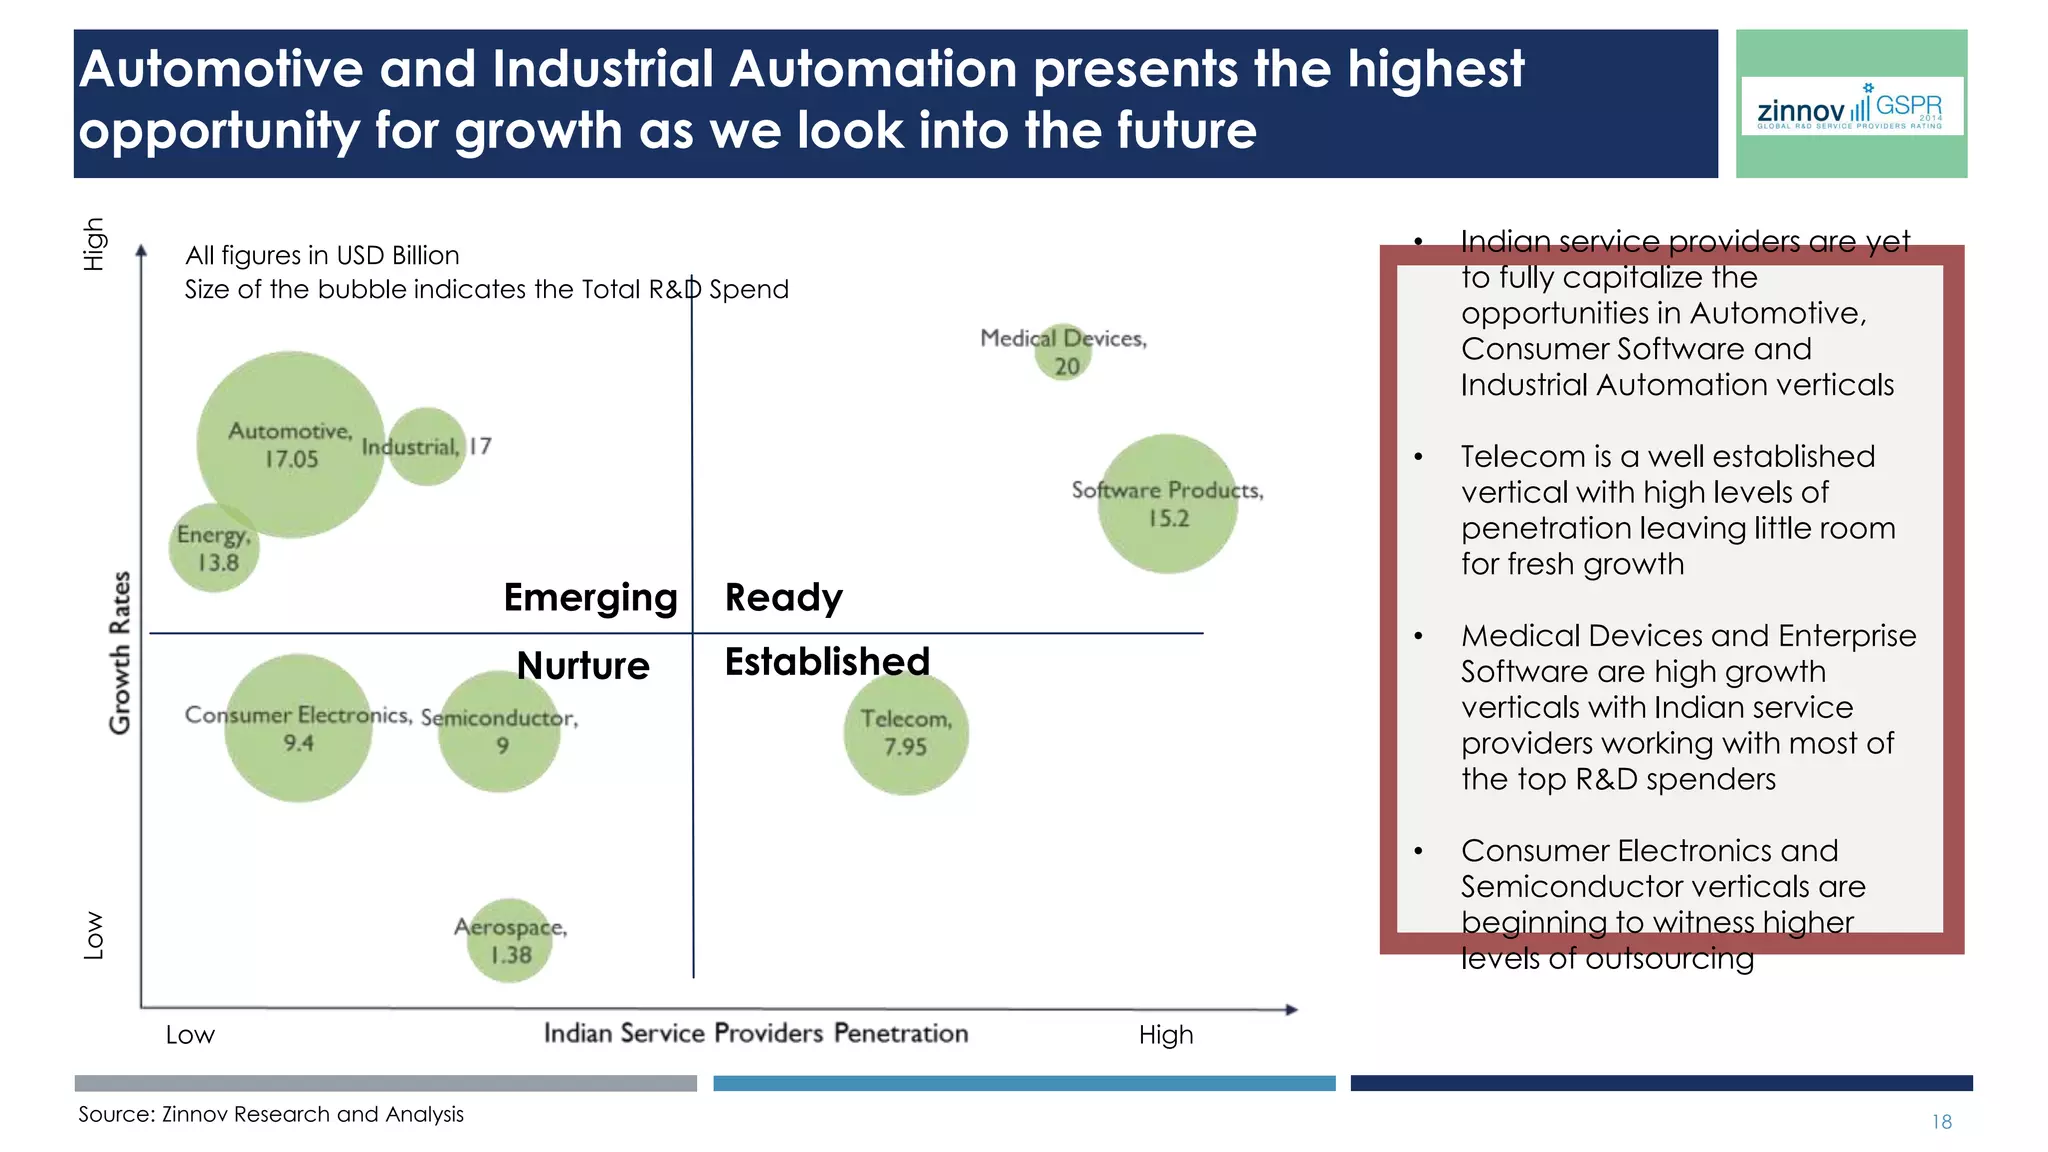
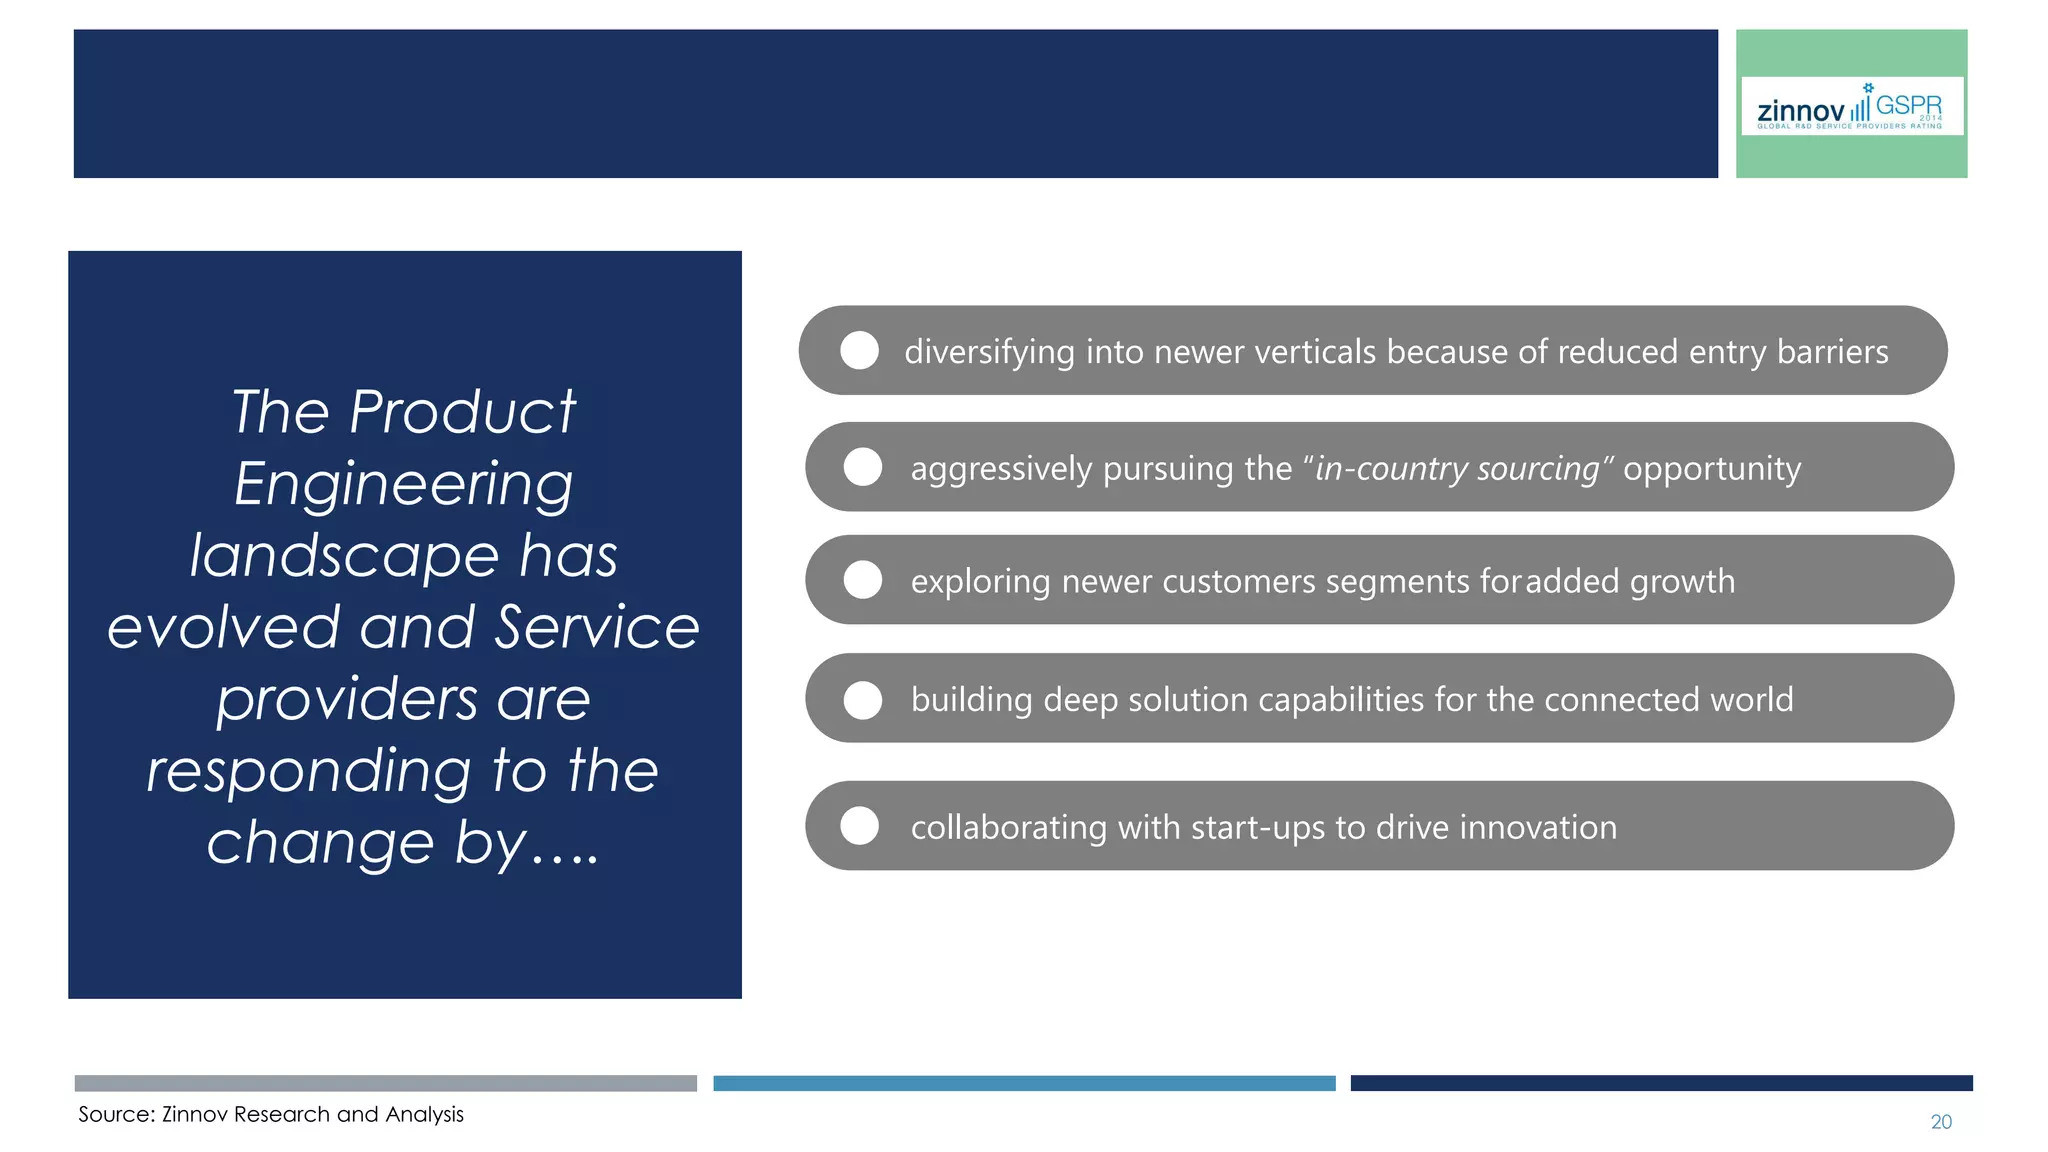
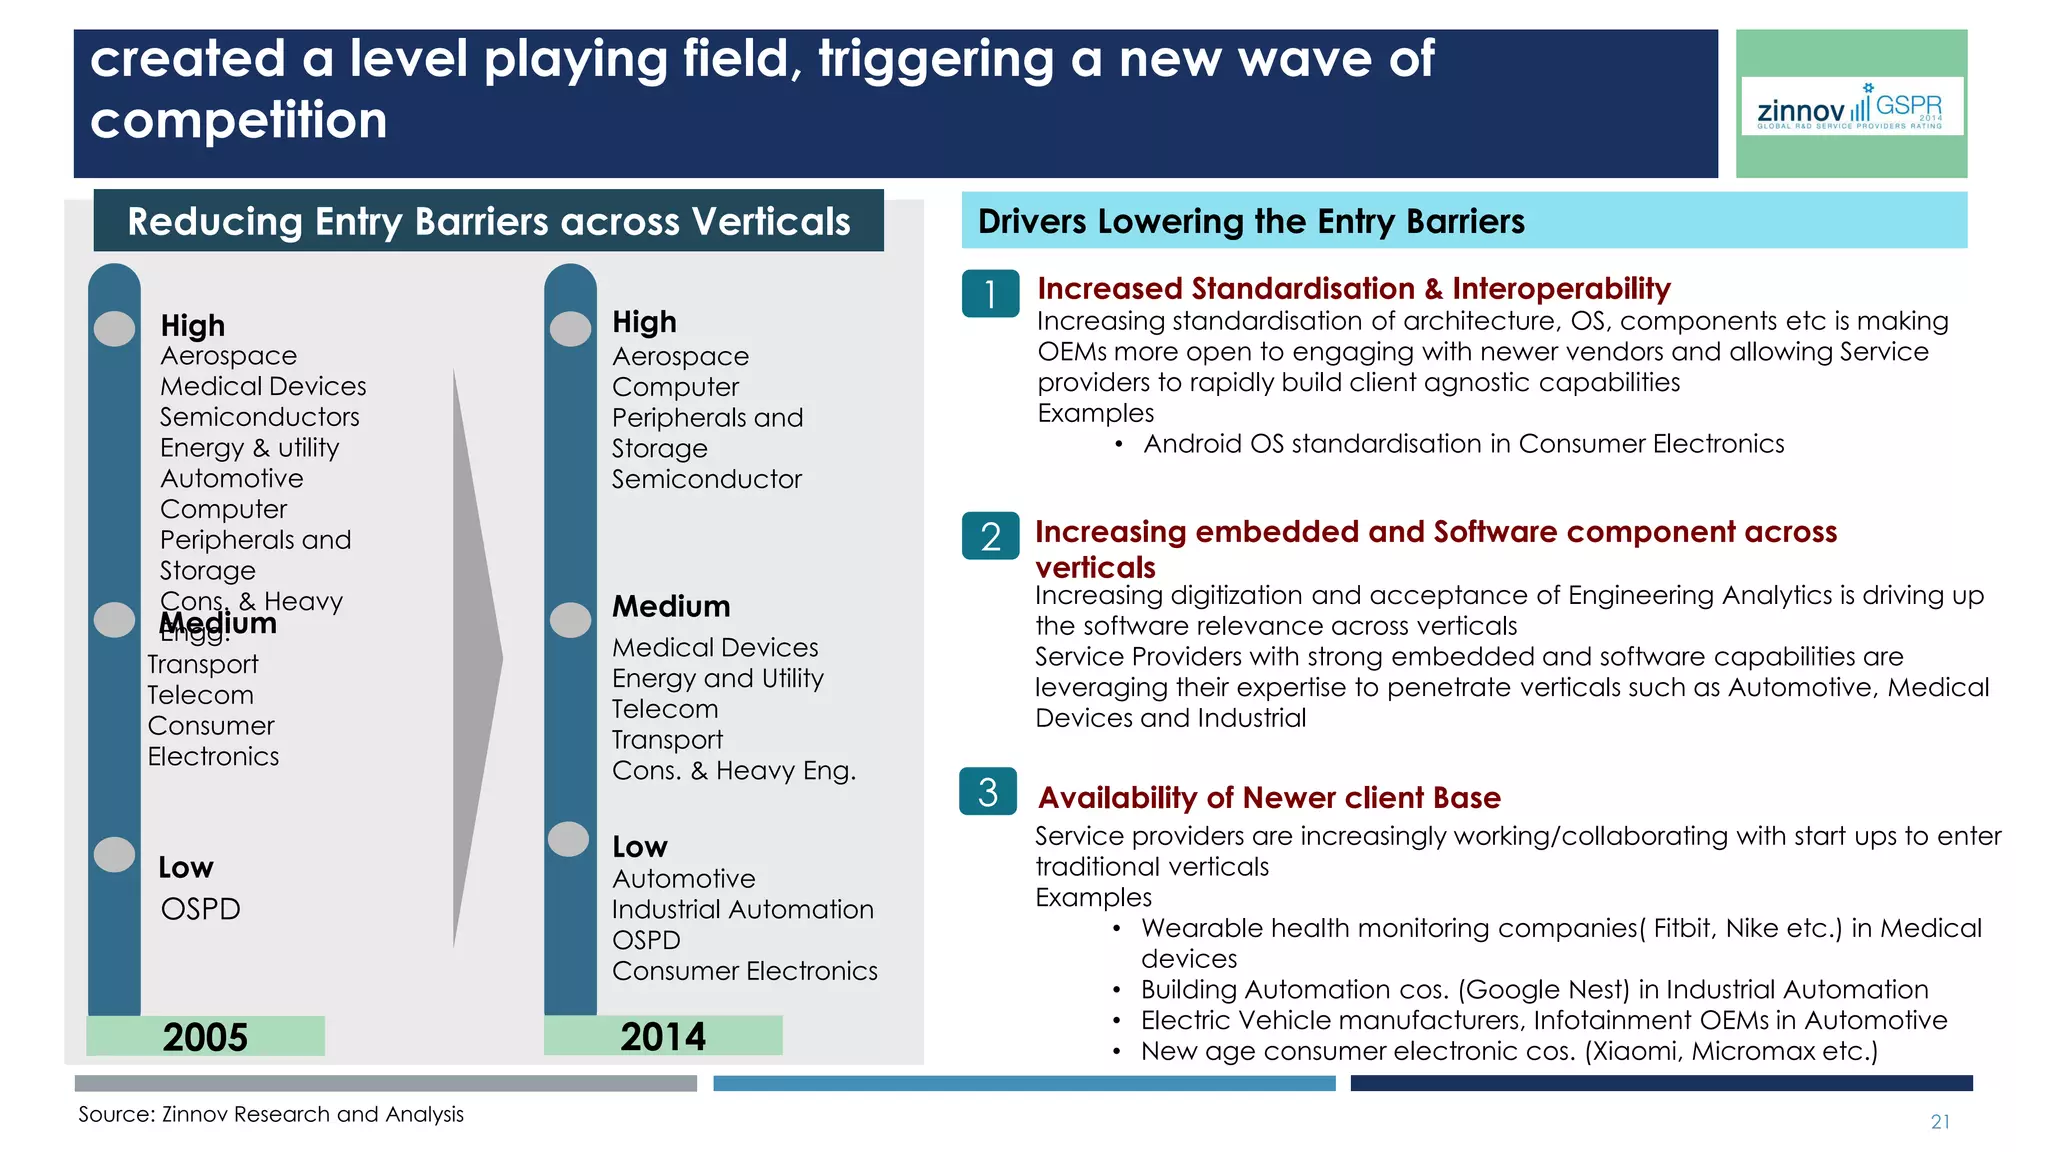

The 2014 Global Service Providers Ratings report highlights a rising trend in global engineering and R&D spending, projecting a total addressable market of $170 billion in R&D globalization and services, with India's market expected to reach $38 billion by 2020. Key service providers are diversifying into new verticals such as medical devices and industrial automation, while utilizing strategic partnerships and innovation to meet client needs. The report evaluates companies based on their capabilities, financial stability, and overall service delivery in a competitive landscape.


