Download to read offline


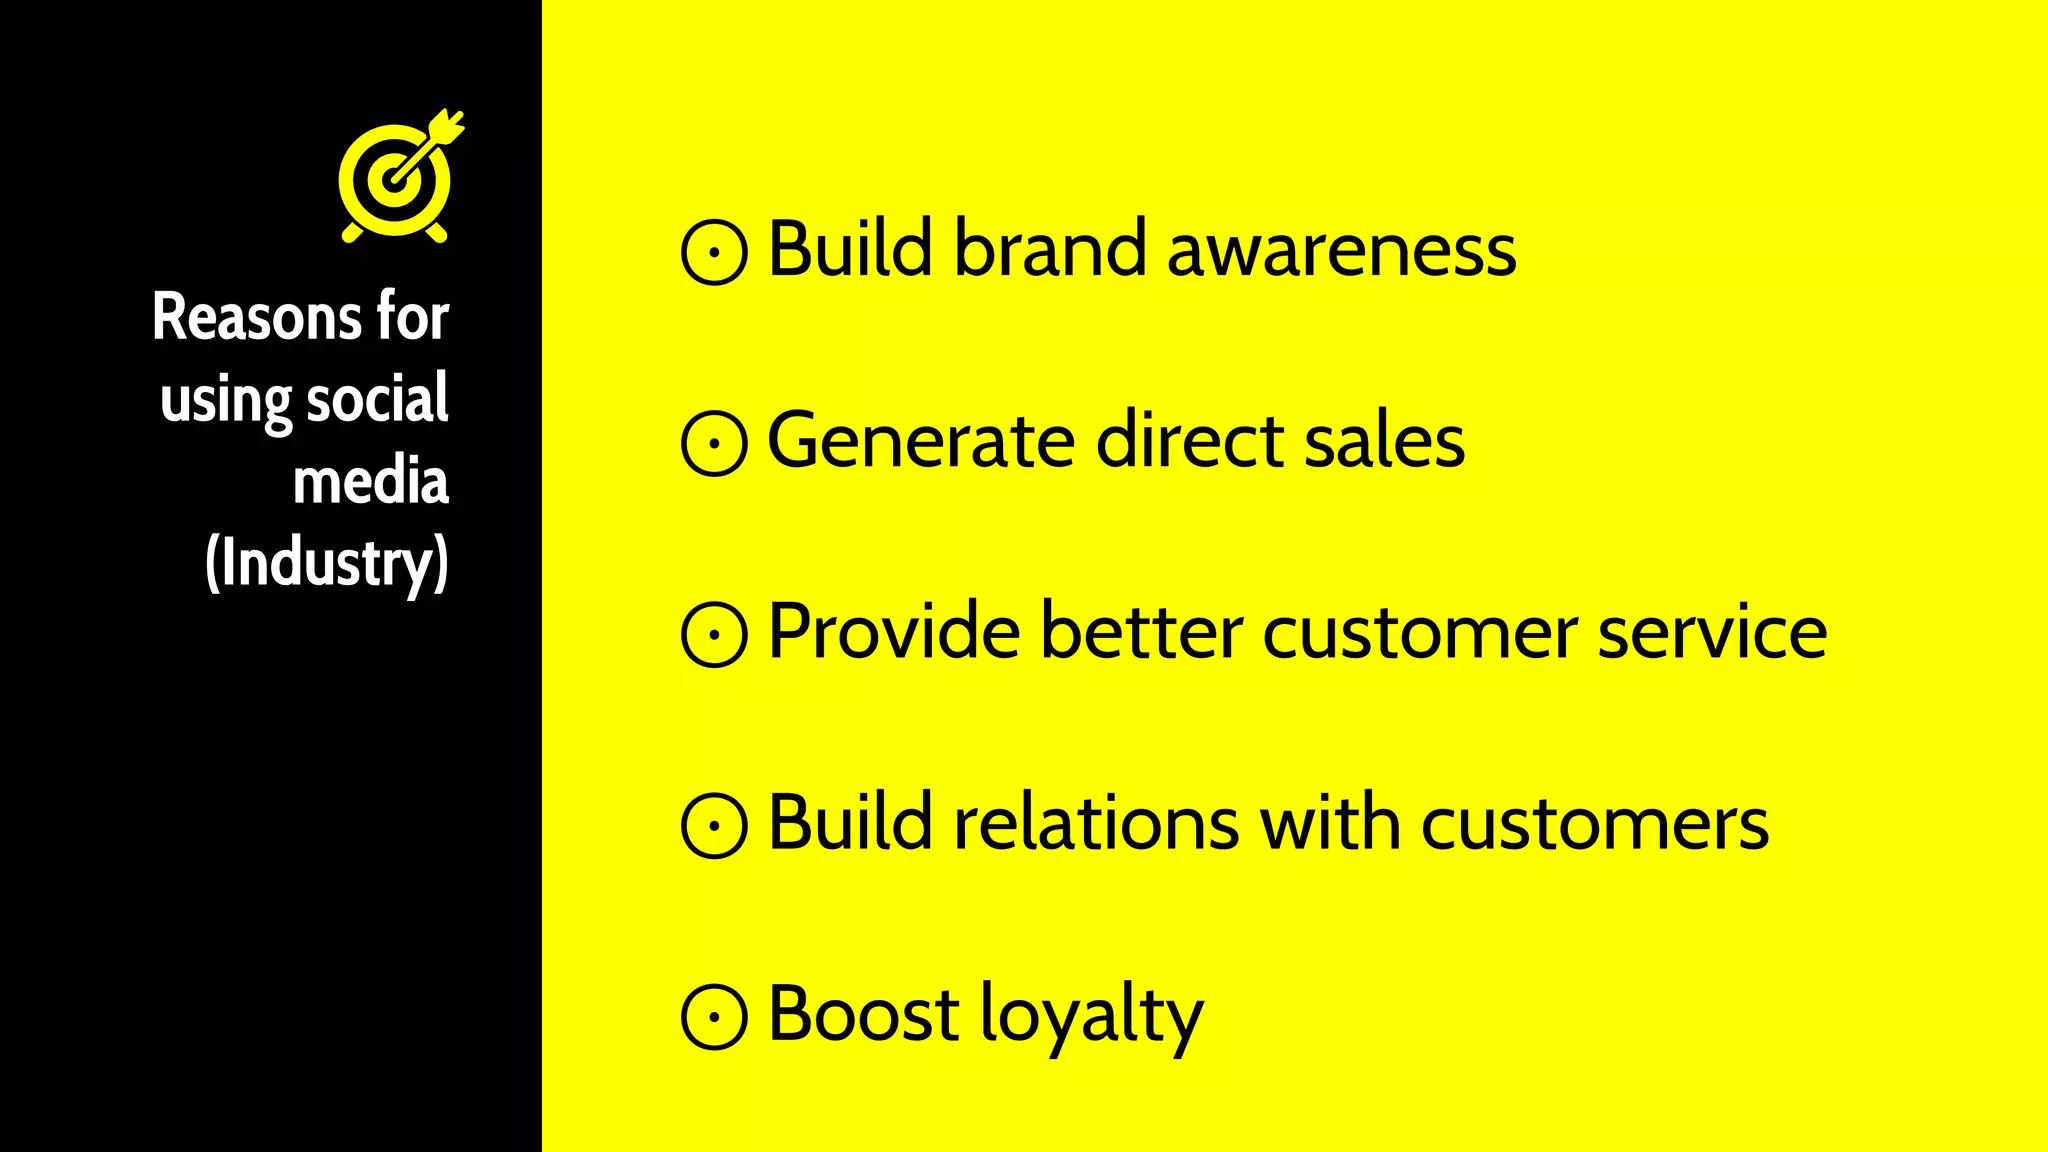


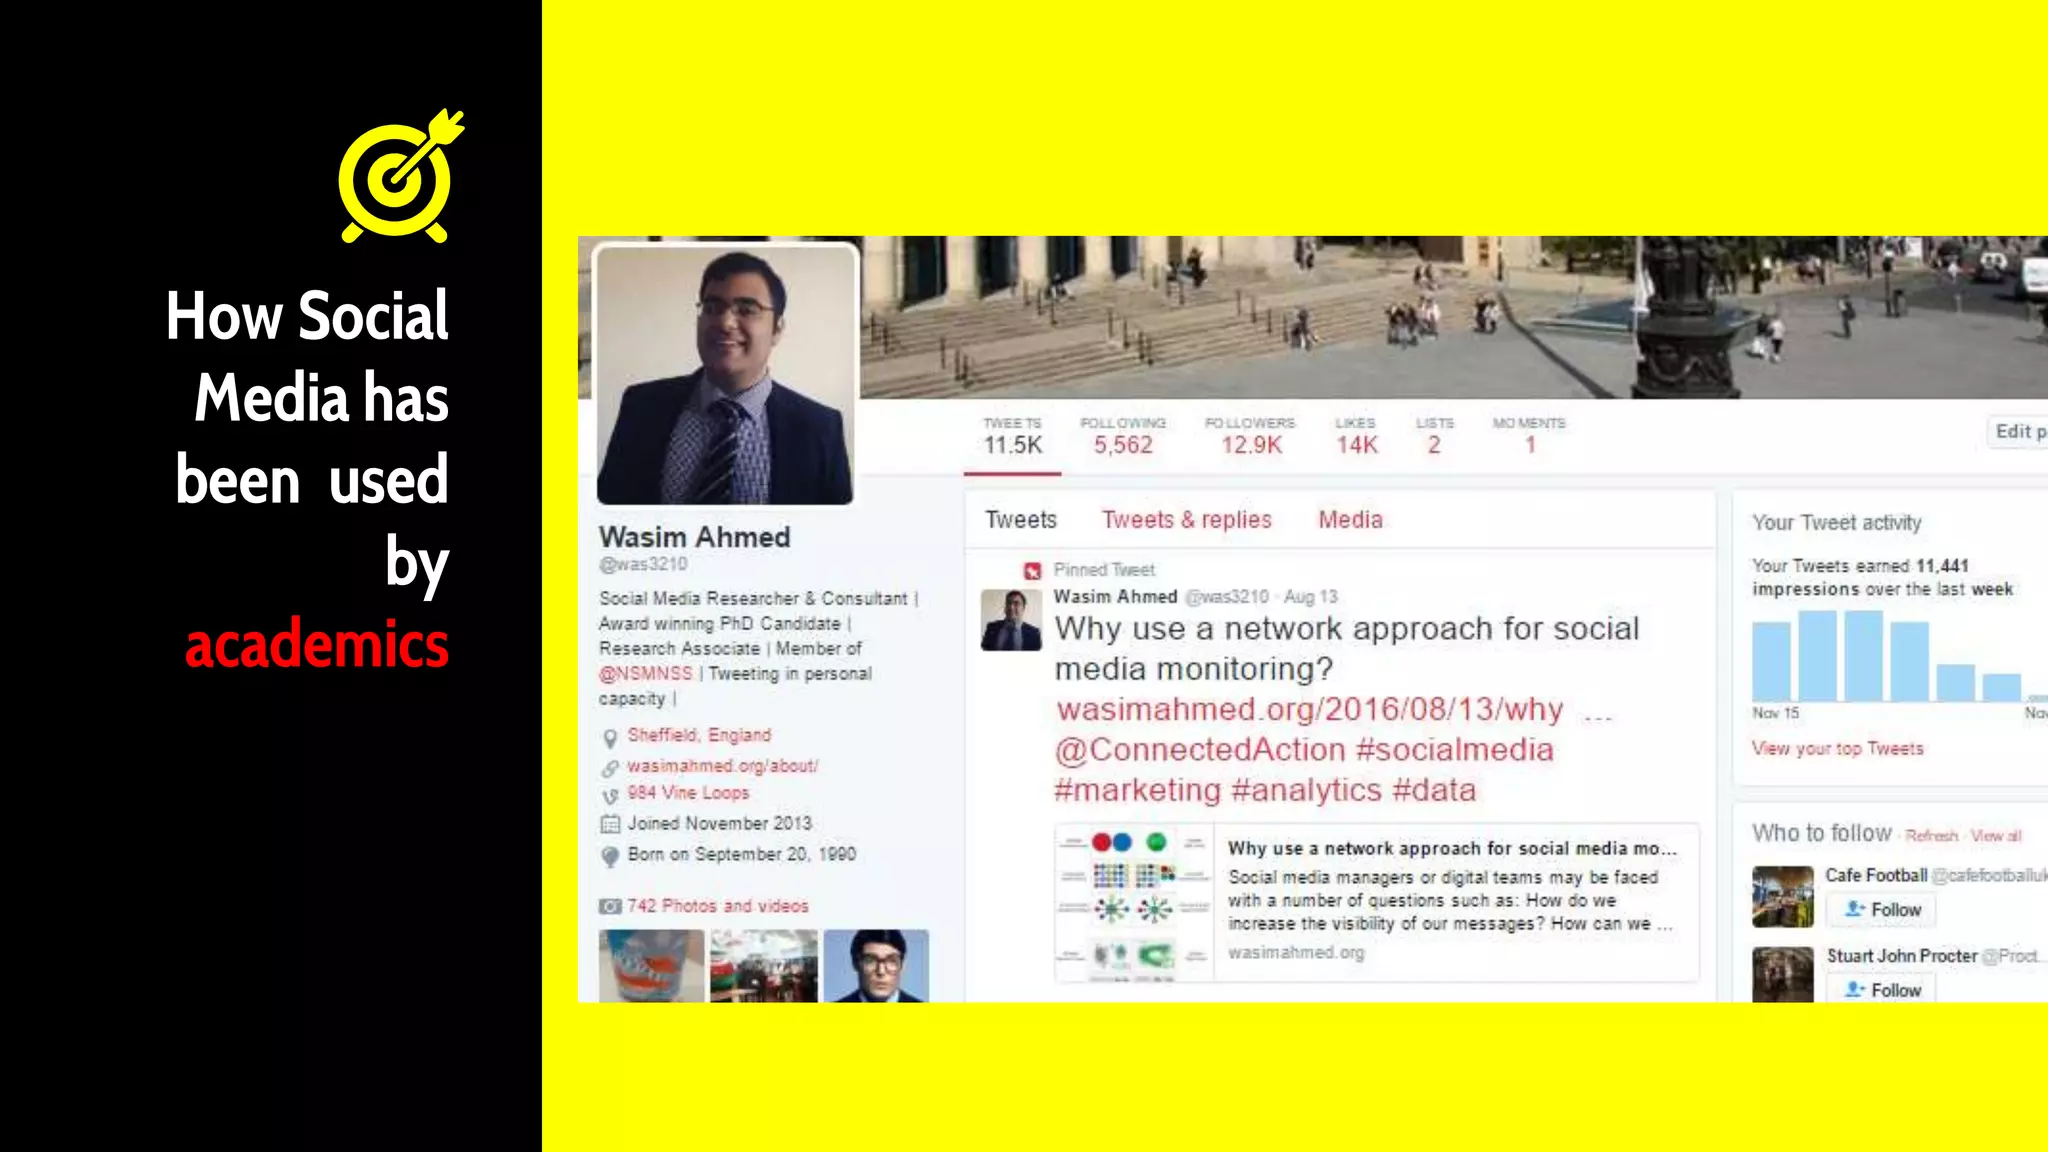


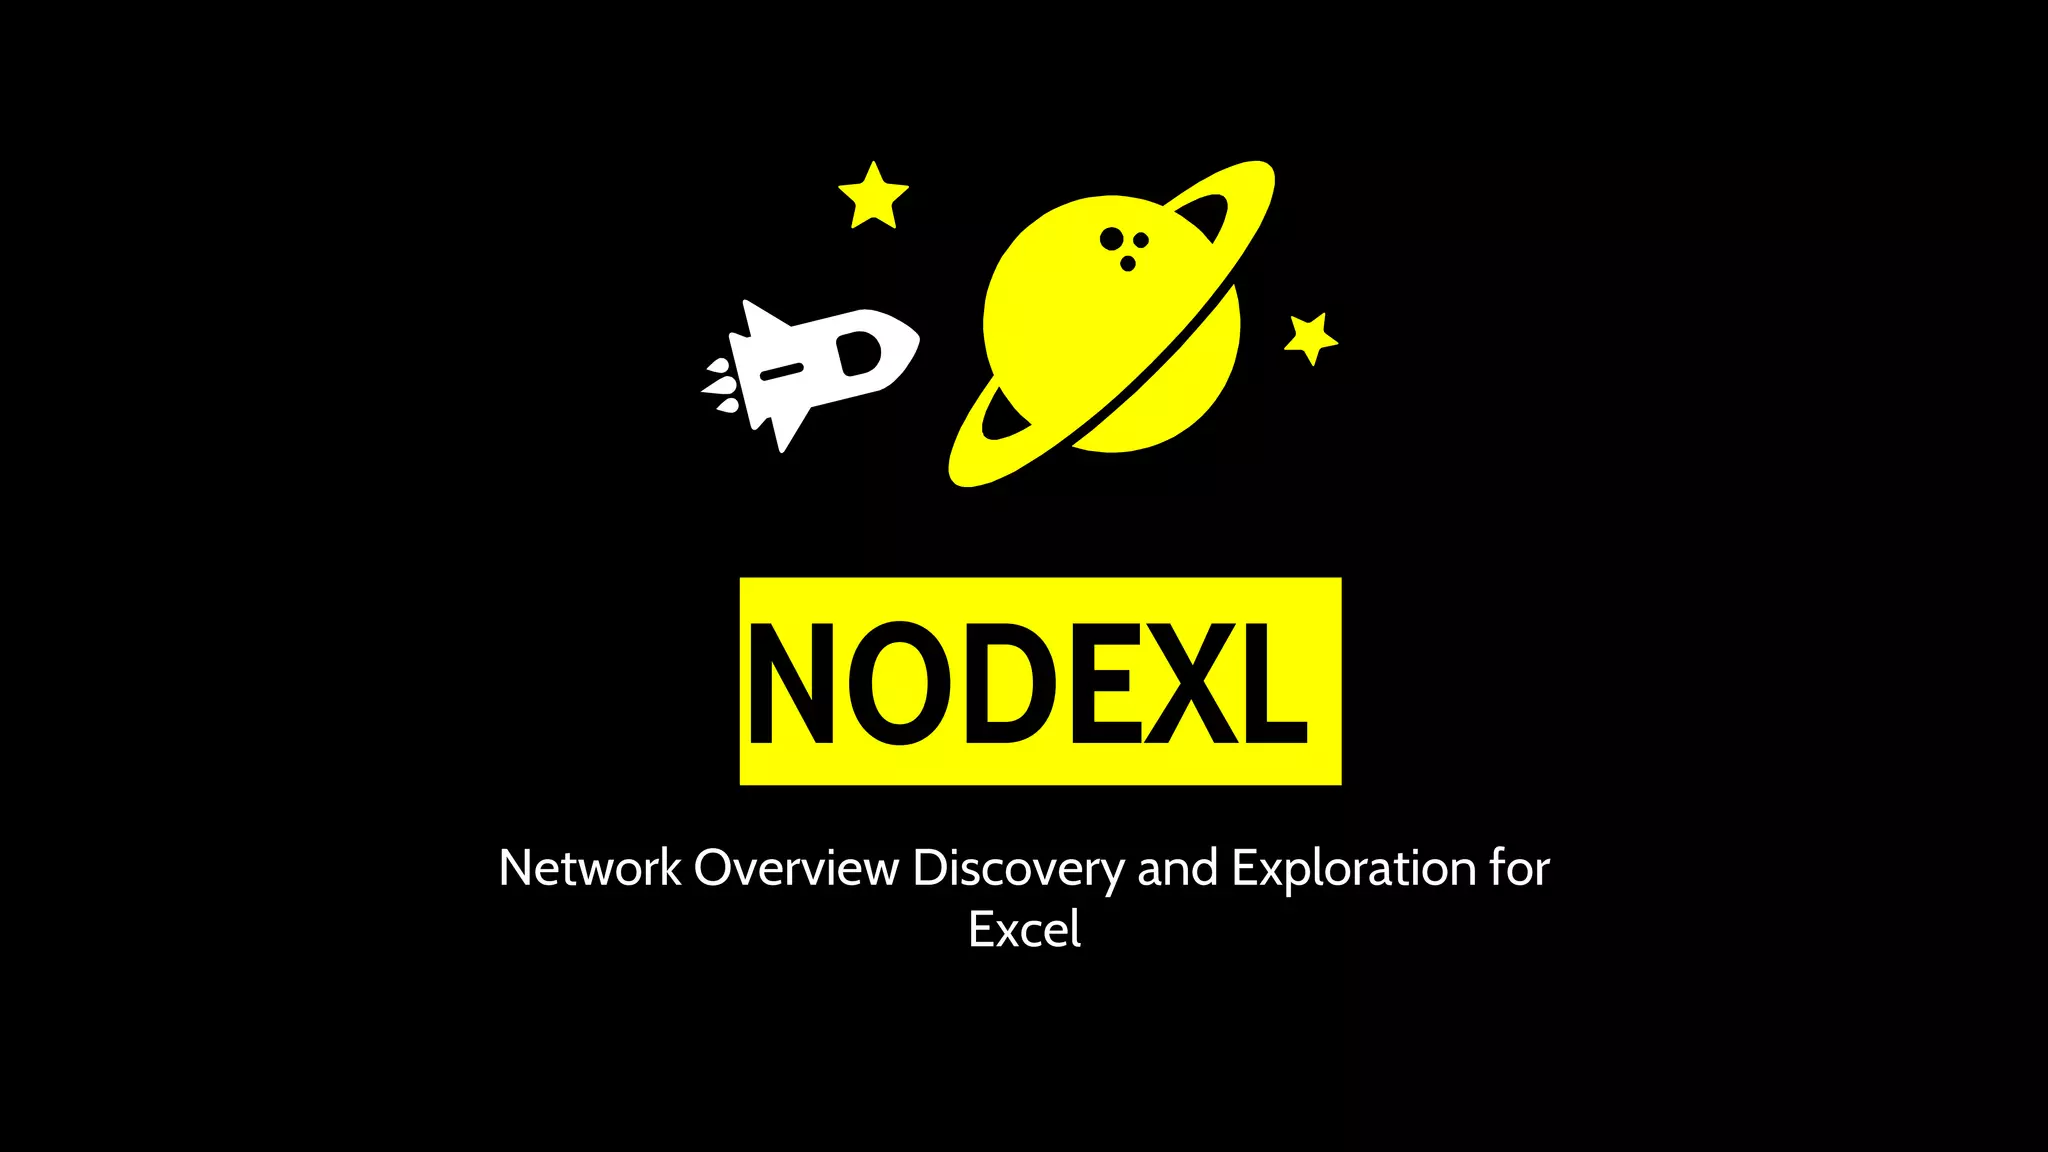


Wasim Ahmed's presentation discusses the use of social media, particularly Twitter, in research and industry, highlighting its potential for brand awareness, customer engagement, and public health communication. He emphasizes Twitter's advantages for researchers, such as its accessible data and community engagement features, and introduces tools like NodeXL for analyzing social media networks. The presentation also showcases case studies illustrating how brands have navigated crises through effective social media strategies.


![SEO Strategy Guide [2019]](https://cdn.slidesharecdn.com/ss_thumbnails/0-190123120920-thumbnail.jpg?width=640&height=640&fit=bounds)


