Data response on the brazilian economy
•
3 likes•6,753 views

A suggested answer to an EdExcel June 2013 macro data response question

Recommended
Recommended
More Related Content
What's hot
What's hot (20)
Viewers also liked
Viewers also liked (14)
Similar to Data response on the brazilian economy
Similar to Data response on the brazilian economy (20)
More from tutor2u
More from tutor2u (20)
Recently uploaded
Recently uploaded (20)
Data response on the brazilian economy
- 1. A2 Macro Data Response on Brazilian Economy (June 2013)
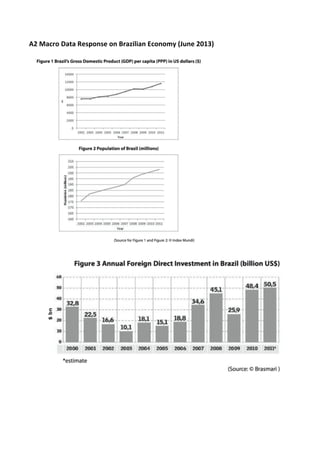
- 2. a) With reference to Figures 1 and 2, what might be inferred about the change in Brazil’s GDP between 2002 and 2011? (5 marks) • Define: GDP is the monetary value of the output of goods and services • Application • Figure 1 shows a rise in GDP per capita from $7,800 in 2002 to $11,700 in 2011 • Figure 2 shows the Brazilian population growing from 176m in 2002 to 203m in 2011 • GDP = GDP per capita x population • Therefore, GDP has risen from approx. $1.78 trillion in 2002 to approx. $2.73 trillion in 2011 – calculate a percentage change = 53%
- 4. b) With reference to Extract 1, analyse two reasons why the value of the Real, Brazil’s currency, has appreciated. (8 marks) Define appreciation – a rise in the external value of a currency within a floating exchange rate system. In a managed floating system the value of a currency is mainly determined by market forces. Two key causes of a 40% appreciation in the Brazilian Real might be: i) Brazil has relatively high interest rates. This leads to a strong net inflow of hot money into the Brazilian banking system, leading to an outward shift of currency demand for the real, thereby causing an appreciation. The effect could be amplified by strong speculative demand for the Real if market speculators expect the Real to continue appreciating in value. ii) Extract 1 mentions a significant increase in the value of Brazilian exports of soft commodities such as soya beans, beef and sugar cane. This increase in exports has contributed towards an increased current account surplus for Brazil which is a net injection of currency into their economy, ceteris paribus, leading to an increase in the external value of the Real of nearly 40% since 2008. My analysis diagram shows the impact of an increase in currency demand on the Brazilian real Only two points needed for analysis – but could also talk about the effects of quantitative easing QE) in the USA which can caused outflow of US $s and an inflow into higher-‐yielding countries including Brazil.
- 5. c) Examine the likely effects of the appreciation of the real, Brazil’s currency, on its Balance of Payments accounts. (10 marks) • Define appreciation: Rise in external value of the currency, Extract 1 suggests a significant appreciation of nearly 40% since 2008. • Define balance of payments: A record of all international financial transactions, comprising current and capital account and financing account. Then analyse the possible impact on the Brazilian current account: Imports Appreciation causes lower import prices for Brazil – people give up less Real for every $1. Cheaper imports will help lower inflation and also reduce the cost of importing technologies and components used in Brazilian manufacturing. This should lead to an outward shift of short run aggregate supply and perhaps an improvement in the current account depending on the price elasticity of demand for imports. Exports Appreciation will also lead to a rise in the foreign price of Brazilian exports including soya beans, iron ore and cars assembled in Brazil. This might lead to a contraction in export demand and a worsening of the Brazilian current account. However, this depends on the price elasticity of demand for Brazilian products; for example, essential products such as iron ore might have a low PED (limiting the effect) whereas global demand for cars has a higher PED for example intensive competition with Mexico could hurt Brazilian car exporters. Current account In the short run, the Brazilian current account may actually improve if the currency appreciates – this would be an example of a reverse J curve effect until the Marshall Lerner effect takes hold. (Could use an analysis diagram at this point). Don’t forget the capital account! An appreciation can also affect capital flows. For example, high interest rates and expectations of a further appreciation of the Real might lead to substantial inflows of short term banking flows. On the other hand, a strong Real might dissuade some FDI into Brazil perhaps due to the higher cost of purchasing land. Some FDI in manufacturing might shift from Brazil to Mexico or other lower labour cost countries resulting in less capital inflows. Extra: Scale length of currency appreciation; e.g. time at which Real is over-‐valued on a PPP basis e.g. using the Big Mac Index – will the Real fall eventually? E.g. as US QE unwinds.
- 6. d) Assess the potential problems associated with primary product dependency for a country such as Brazil. (12 marks) PPD defined Heavy dependence in terms of output, employment, exports, tax revenues from the primary sector which includes commercial agriculture and extractive industries generally including oil and gas. Identify some problems – analyse them i) Risk of corruption associated with extractive industries – having a negative effect on development – resource rents not flowing to poorest communities, lack of inclusive development for the bottom 40% / rising relative poverty in Brazil despite a fall in absolute poverty ii) Macroeconomic volatility – big swings in real GDP, capital investment, real wages associated with changes in world commodity prices. Developing countries are more exposed to external shocks e.g. following the global financial crisis in 2008 and big falls in primary commodity prices. Volatile terms of trade and volatile current account iii) Longer-‐term view – Prebisch Singer Hypothesis – fall in real price of many primary commodities due to low income elasticity of demand. Need for Brazil to industrialize towards higher value-‐added products. iv) Risk of Dutch Disease – rising exports of primary products can cause a currency appreciation, making emerging manufacturing industries less competitive and perhaps causing premature de-‐industrialisation. (Refer here to the extract) Evaluation: i) Policies to avoid PPD include: Sovereign wealth funds / stabilisation funds -‐ build up a fund to promote investment in other industries e.g. for Brazil investment in renewable energy / a more diversified industrial base / growth of tourism perhaps built around the 2014 World Cup and the 2016 Rio Olympics. ii) With a floating exchange rate, we would expect the real to depreciate if primary commodity prices fall. Floating currencies more appropriate for developing countries? Floating rates provide a degree of automatic stabilisation for an economy iii) To address corruption – political reforms needed – extract 1 discusses this! (2013!) I.e. more transparency in how resource rents are used. Transparency International.
- 7. e) Evaluate the benefits of inward foreign direct investment for a country such as Brazil. (15 marks) You can talk about other countries but probably best to focus your answer on Brazil • Define inward investment e.g. inward FDI into farming, manufacturing, services • Some of FDI is physical capacity (i.e. building factories) some might be mergers and takeovers / commercial joint ventures, land purchases • Must reference Figure 3: Trend rise in FDI, peaking at $50.5 bn in 2011, GDP was $2.37 trillion, therefore inward FDI was 2.1% of Brazilian GDP – is this a high or low figure? Key benefits • Infrastructure accelerator effects – a rise in investment/GDP ratio – use the Solow diagram! Higher capital intensity / capital deepening i.e. more capital per worker • Better training for local workers from TNCs – improved human capital -‐ Lift in the level of labour productivity which increases GNI per capita • Grows a country’s export capacity (e.g. special economic zones) + Technology & know-‐how transfer / diversification of the Brazilian economy • More competition / contestability in domestic markets which then reduces consumer prices – important for lower income Brazilian households • Creates new jobs – higher incomes and household savings (refer to Harrod Domar model) – FDI helps to overcome the savings gap, makes Brazil less dependent on aid … in fact Brazil is now an aid donor – have offered conditional debt relief to African countries • Inward FDI is a capital inflow which is a help if the Brazilian current account of BoP worsens Must use an analysis diagram Critically evaluate: Reference figure 3 to show the volatility of FDI i) Inequality – profits from FDI are flow disproportionately to powerful elites ii) Land grabs / extractive FDI which generates little extra tax revenues iii) Ethical standards from TNCs may be poor – especially in mining, farming and textiles iv) Volatile / footloose FDI flows – e.g. FDI is more volatile than remittance flows v) Limited job creation effects / small spill-‐over for local content suppliers vi) Monopsony power of TNCs who are able to negotiate favourable prices