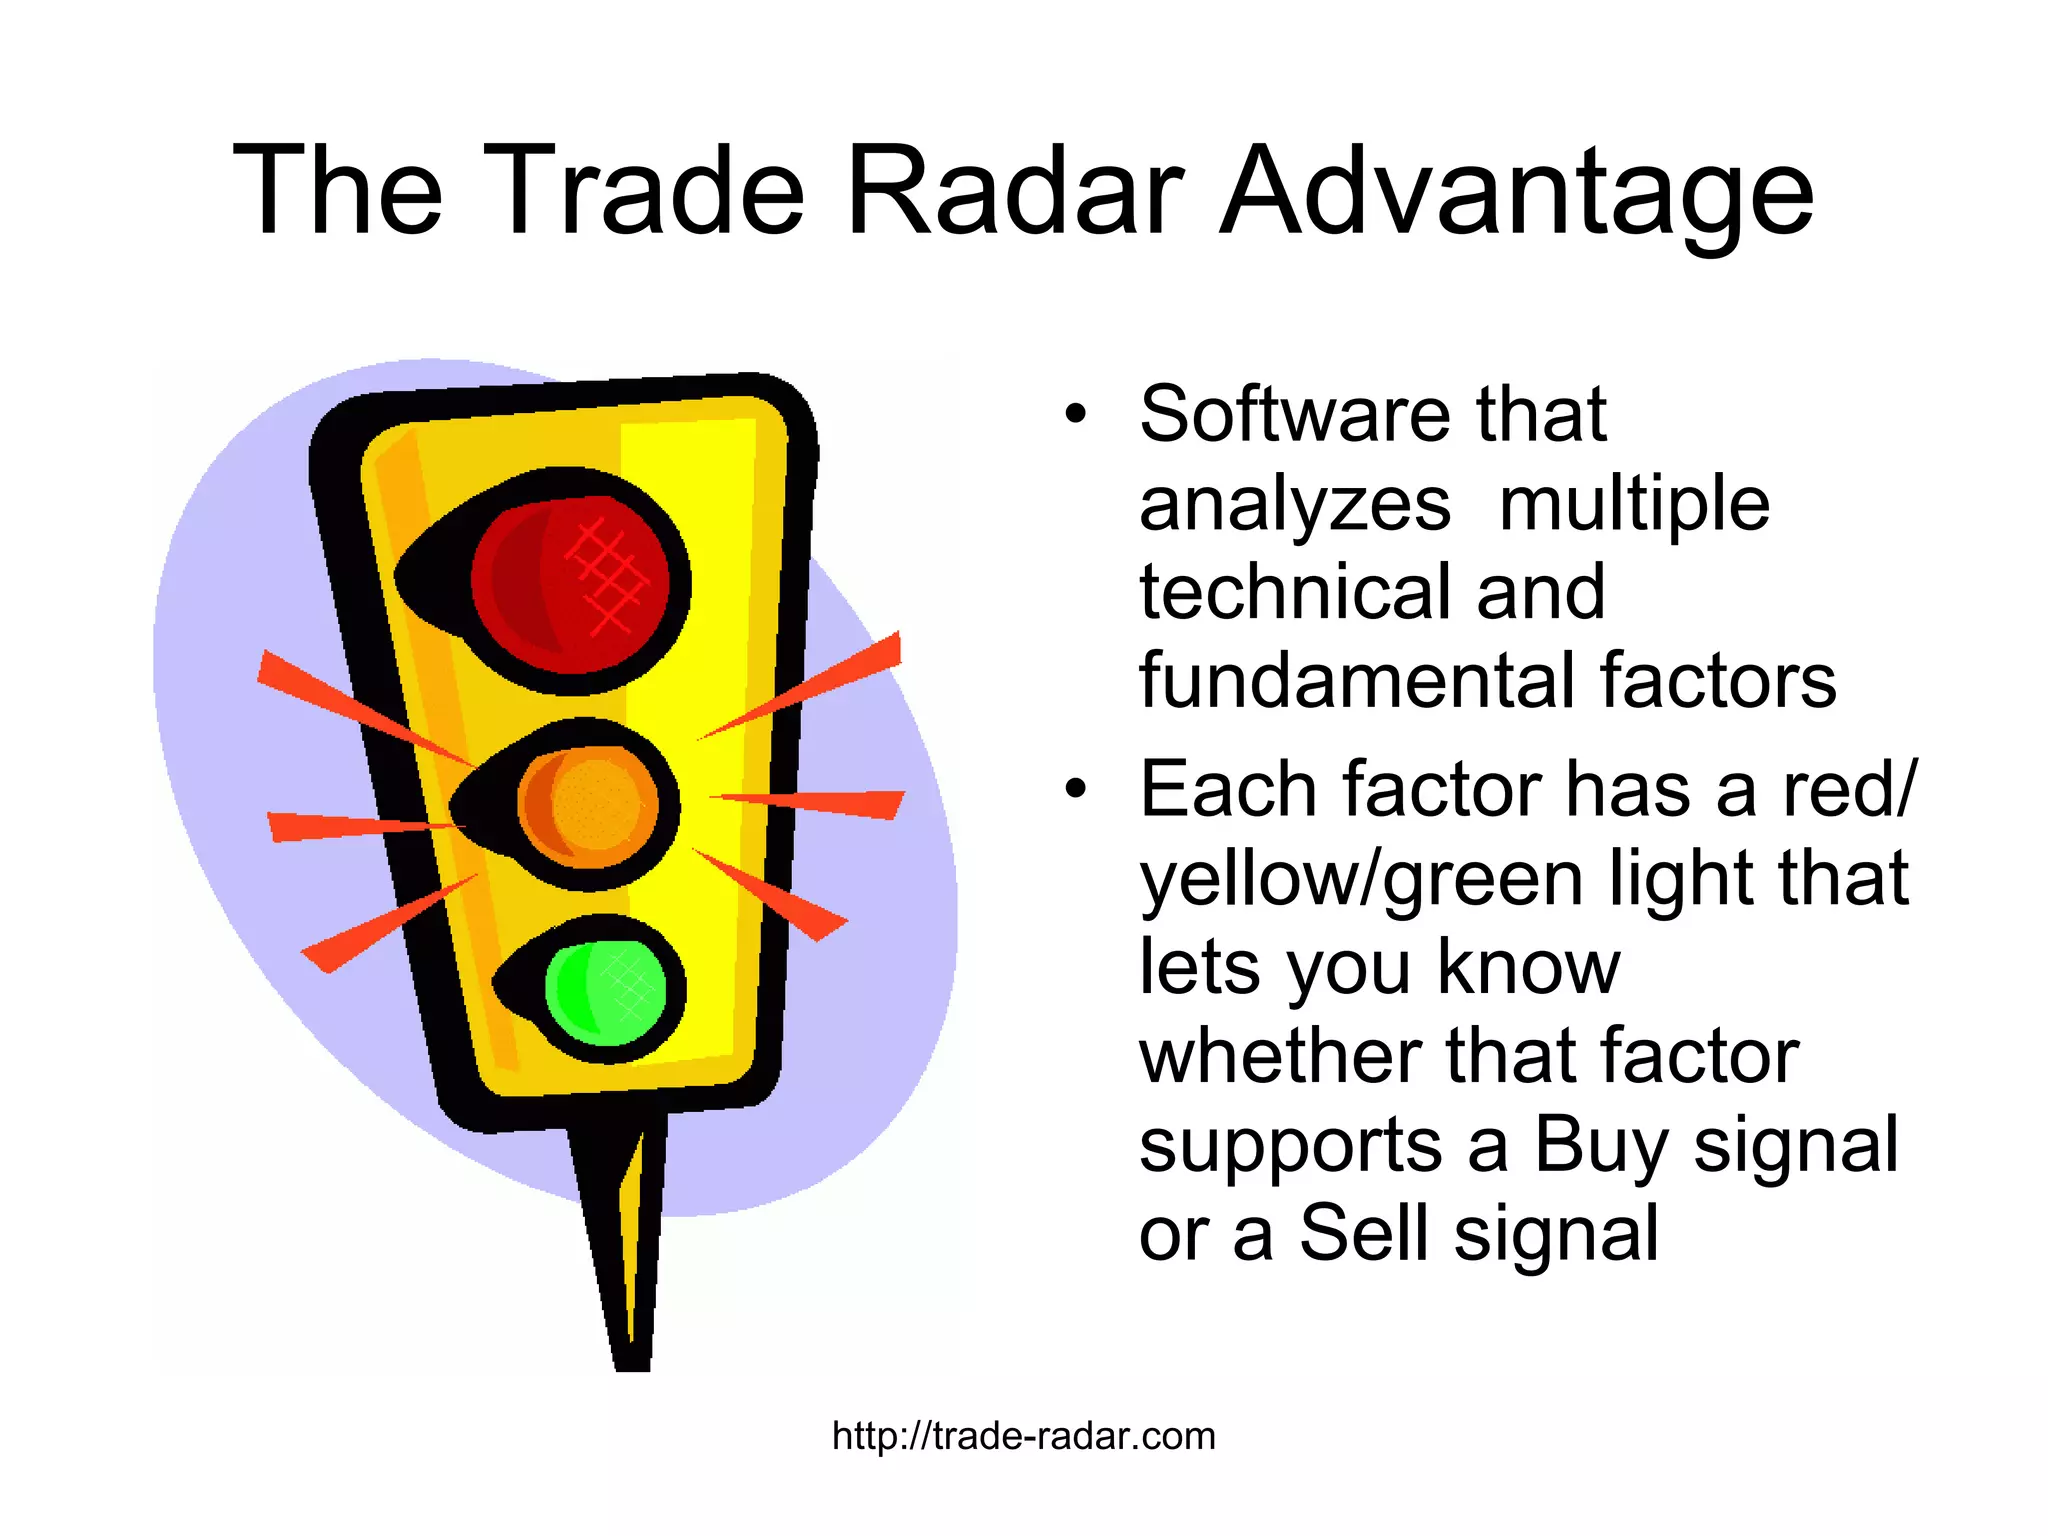
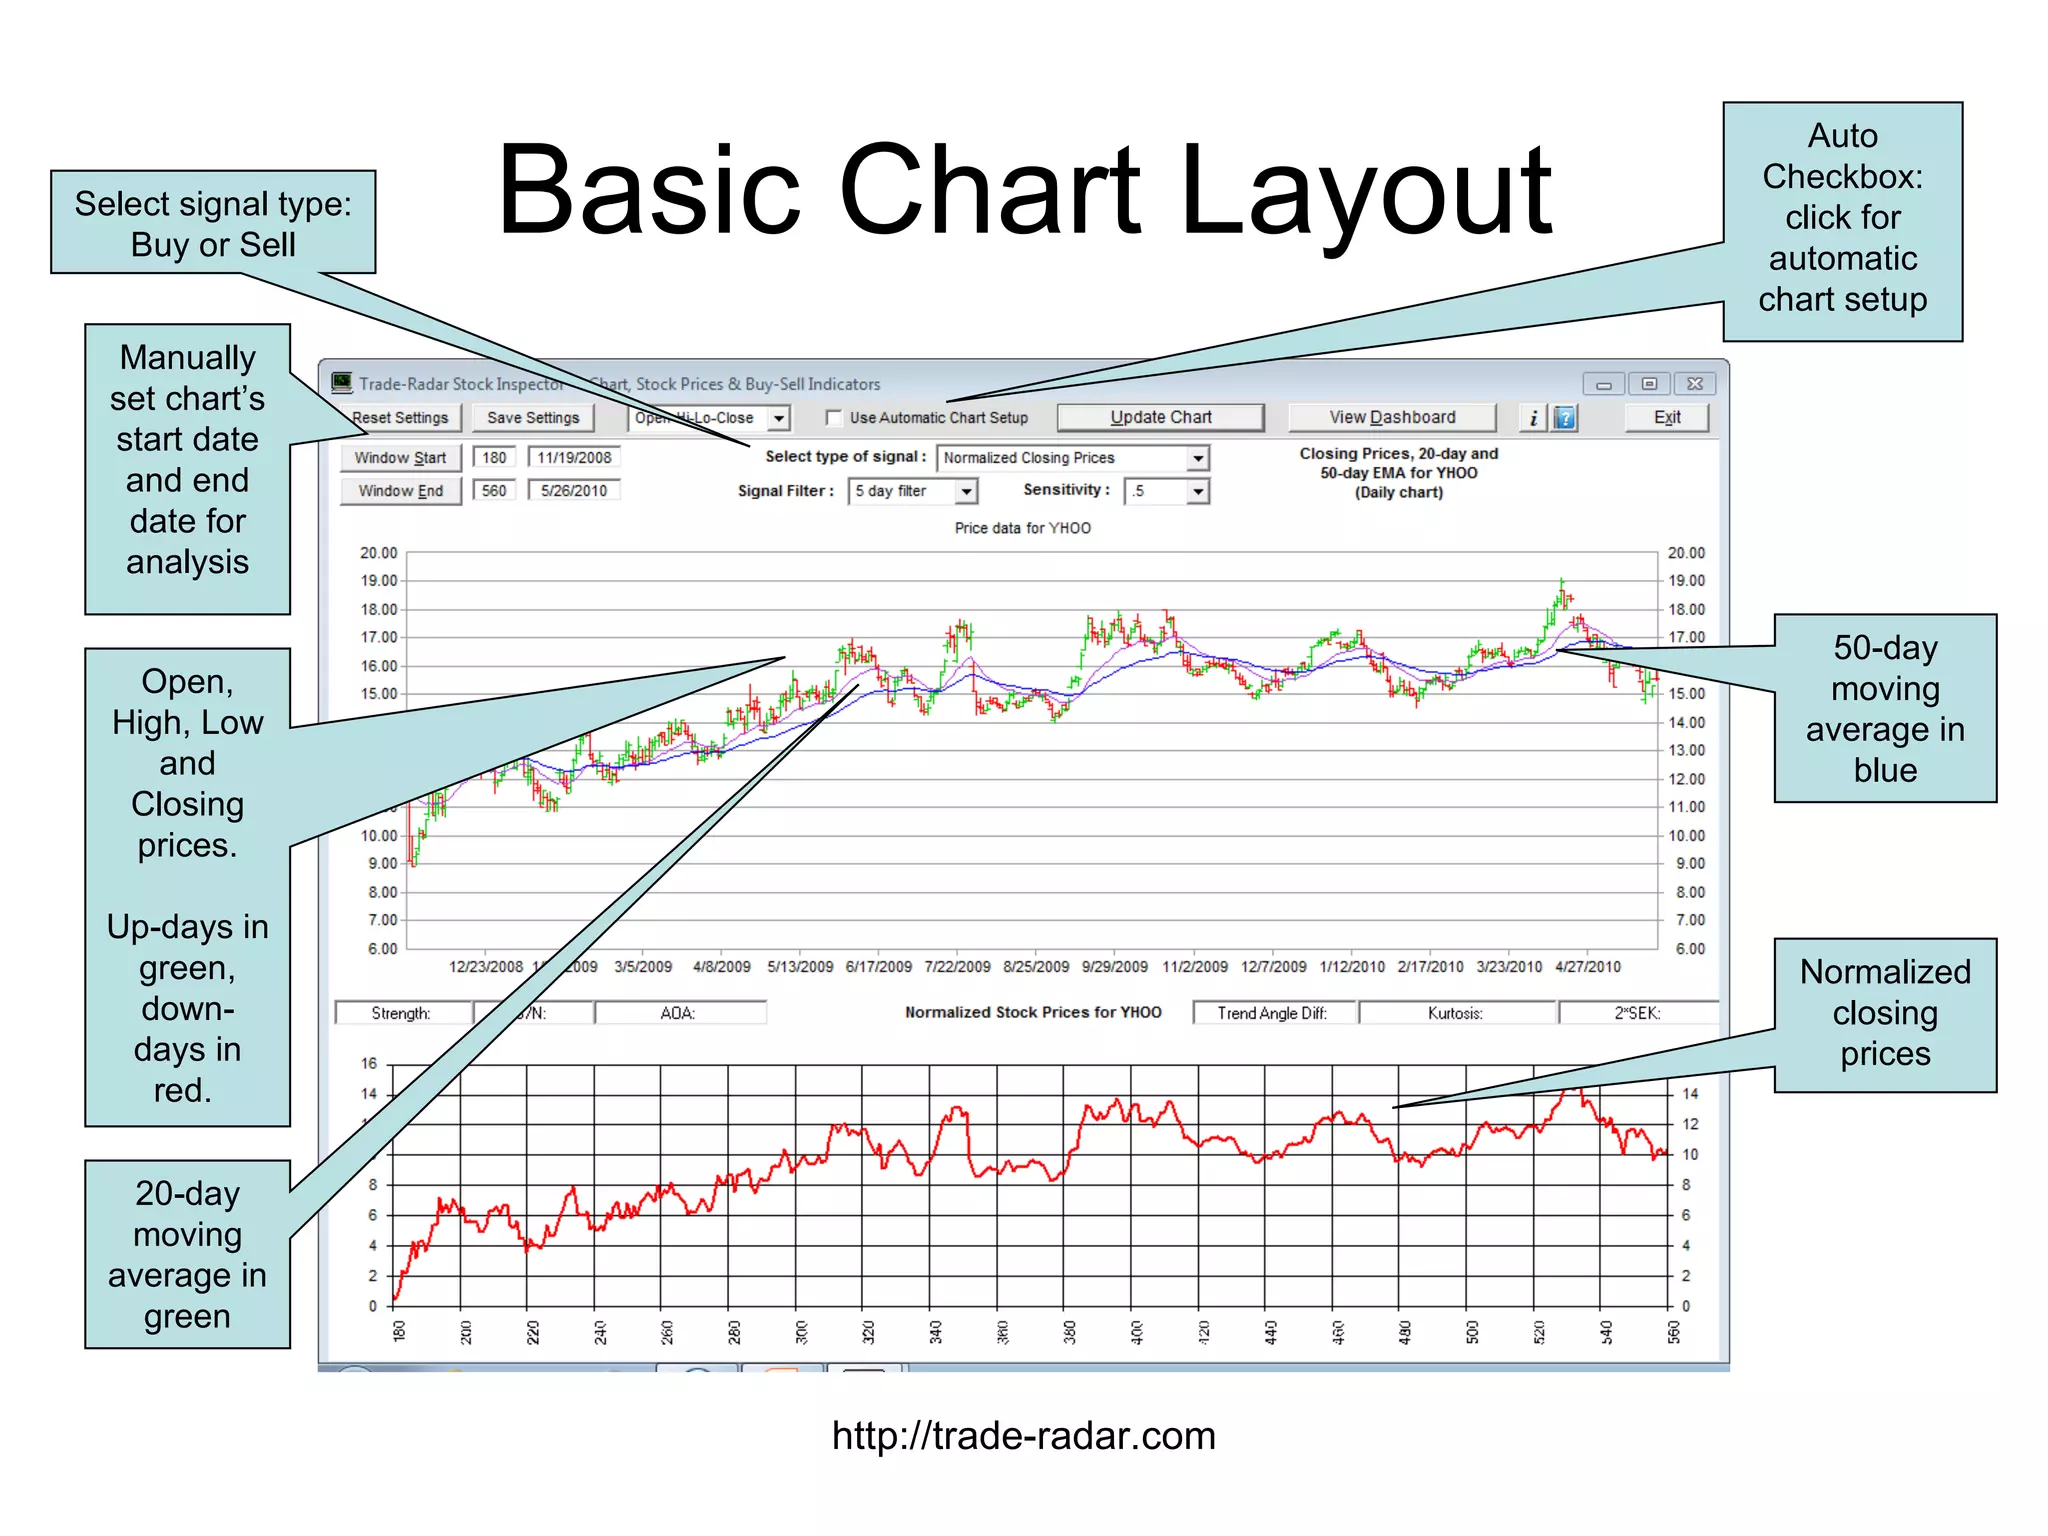
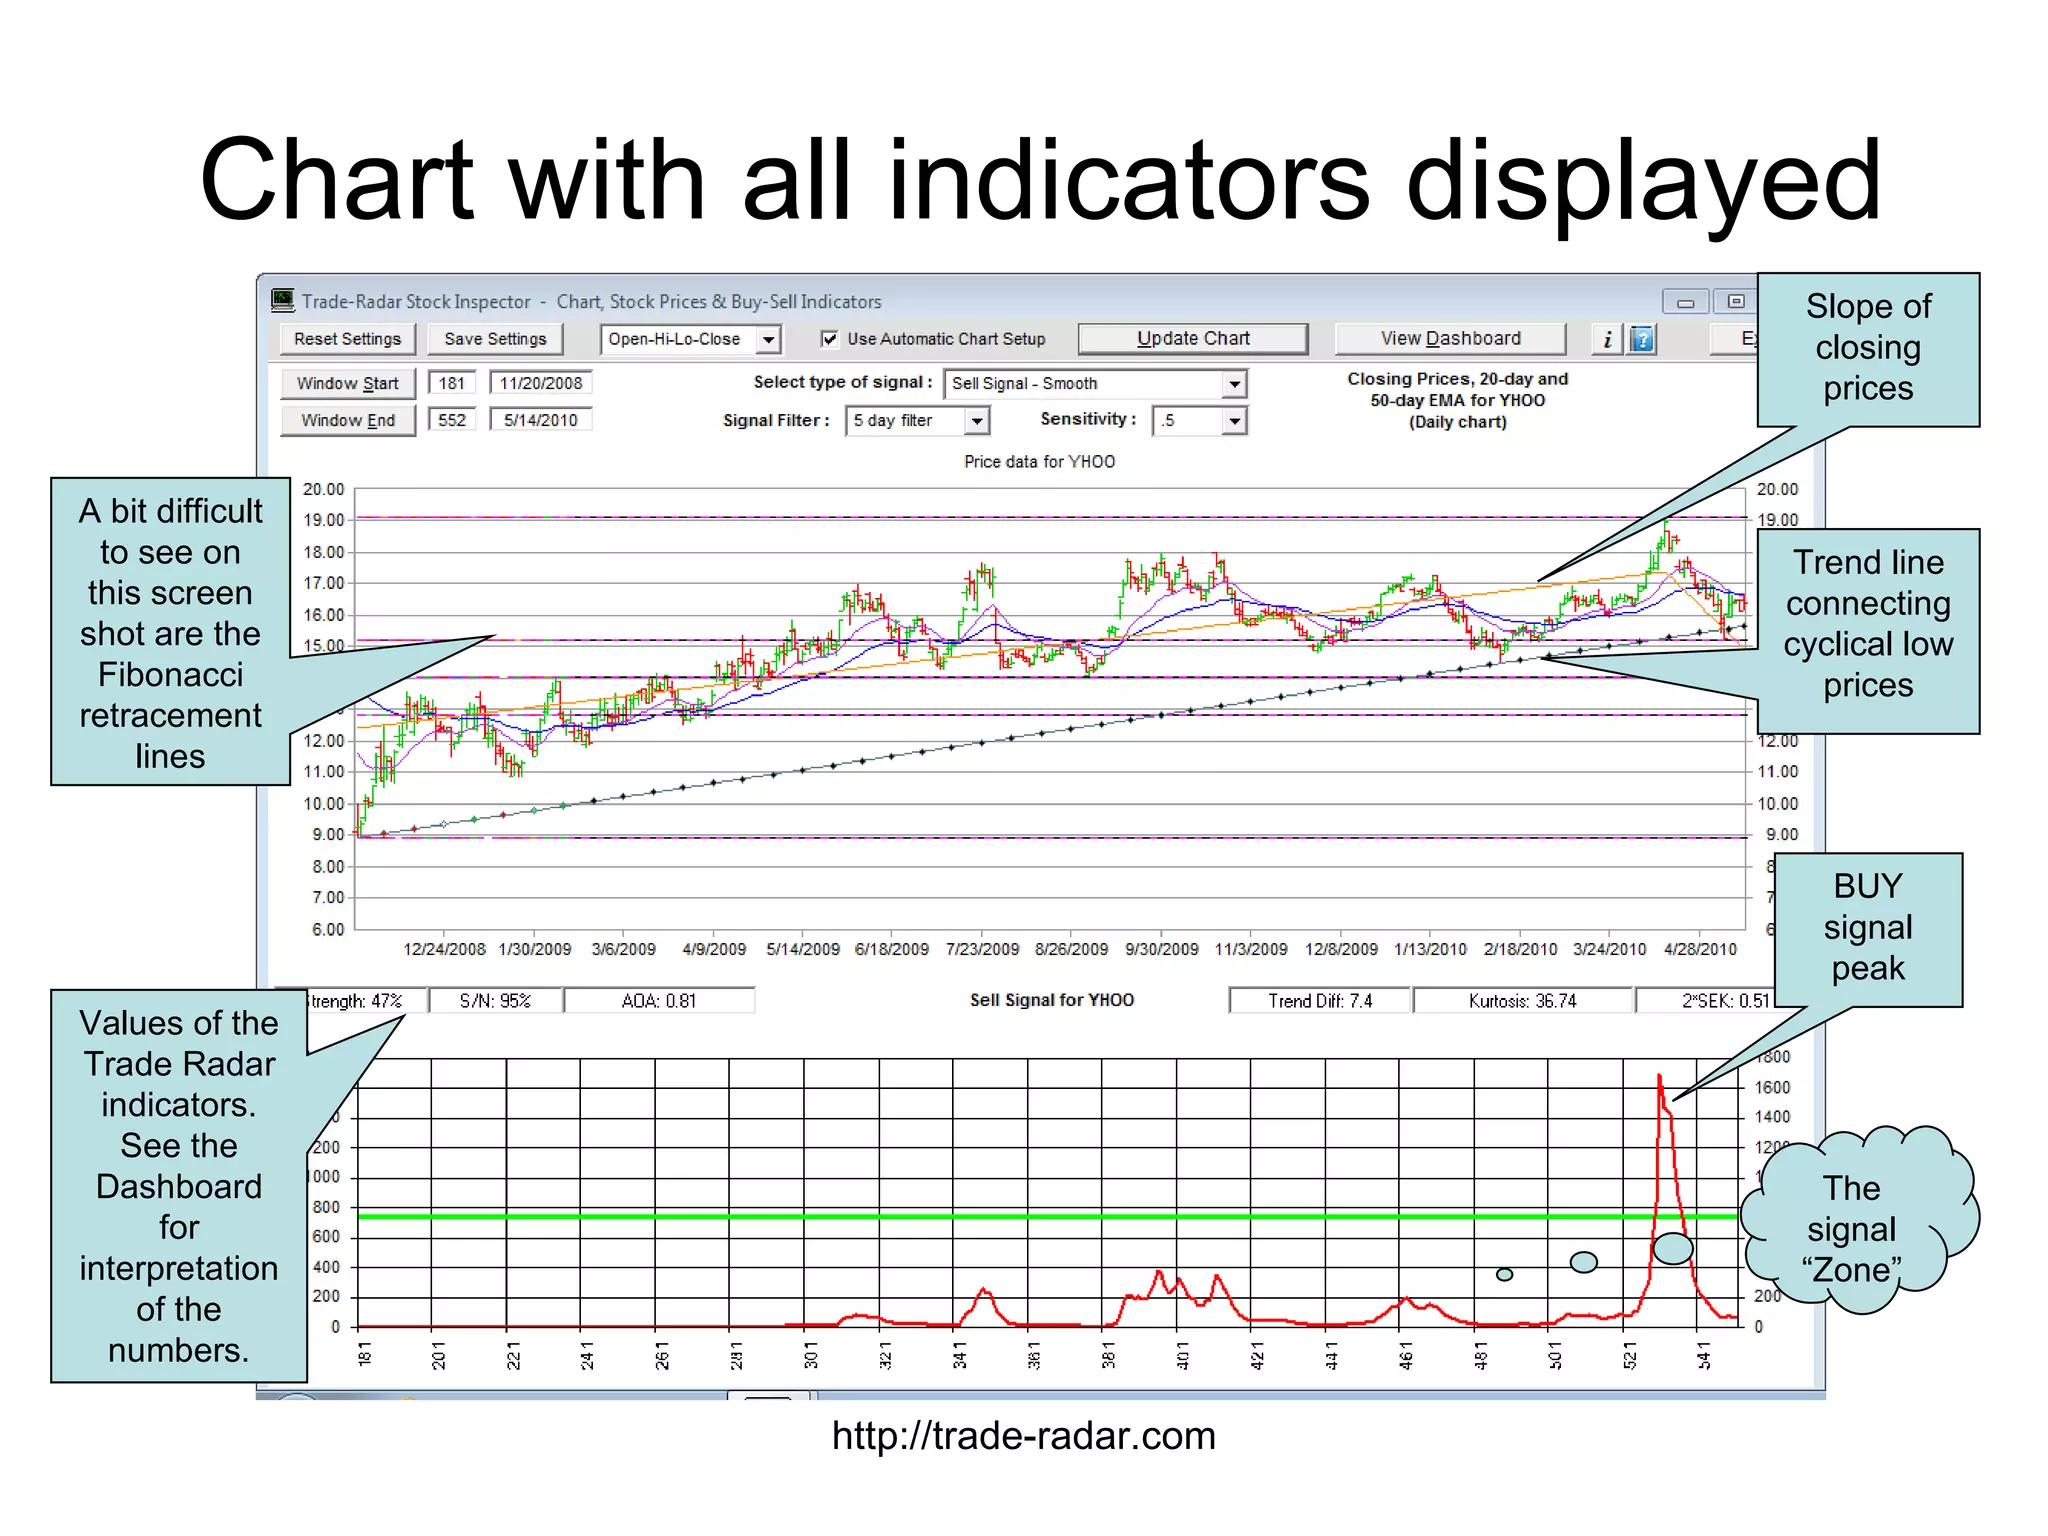
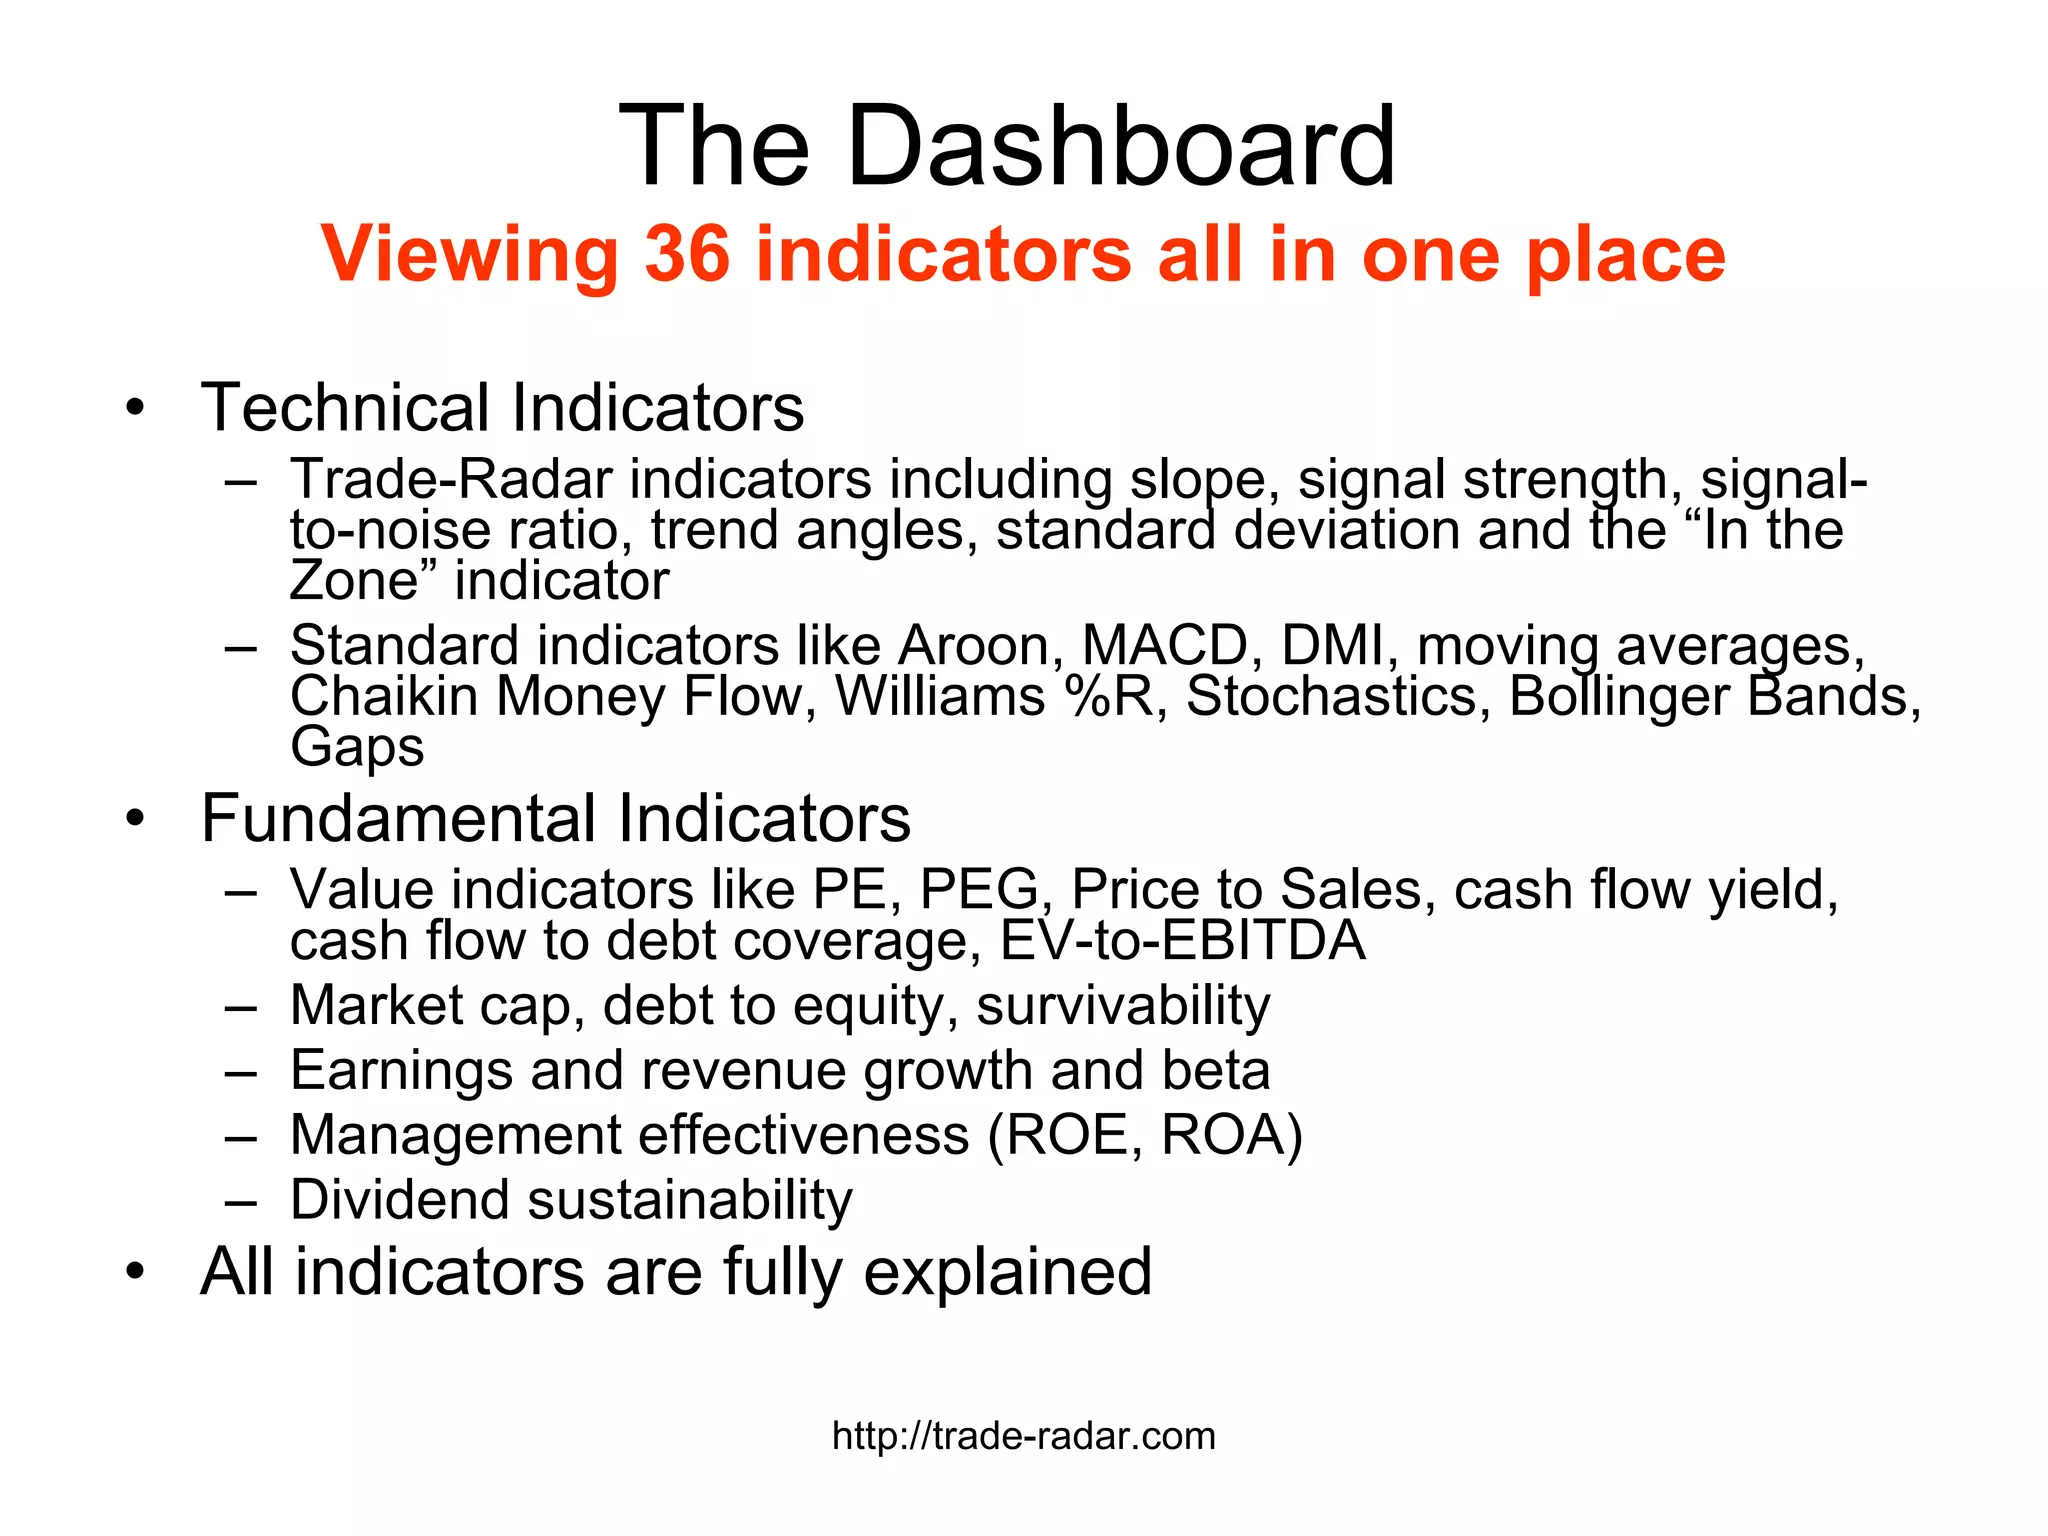
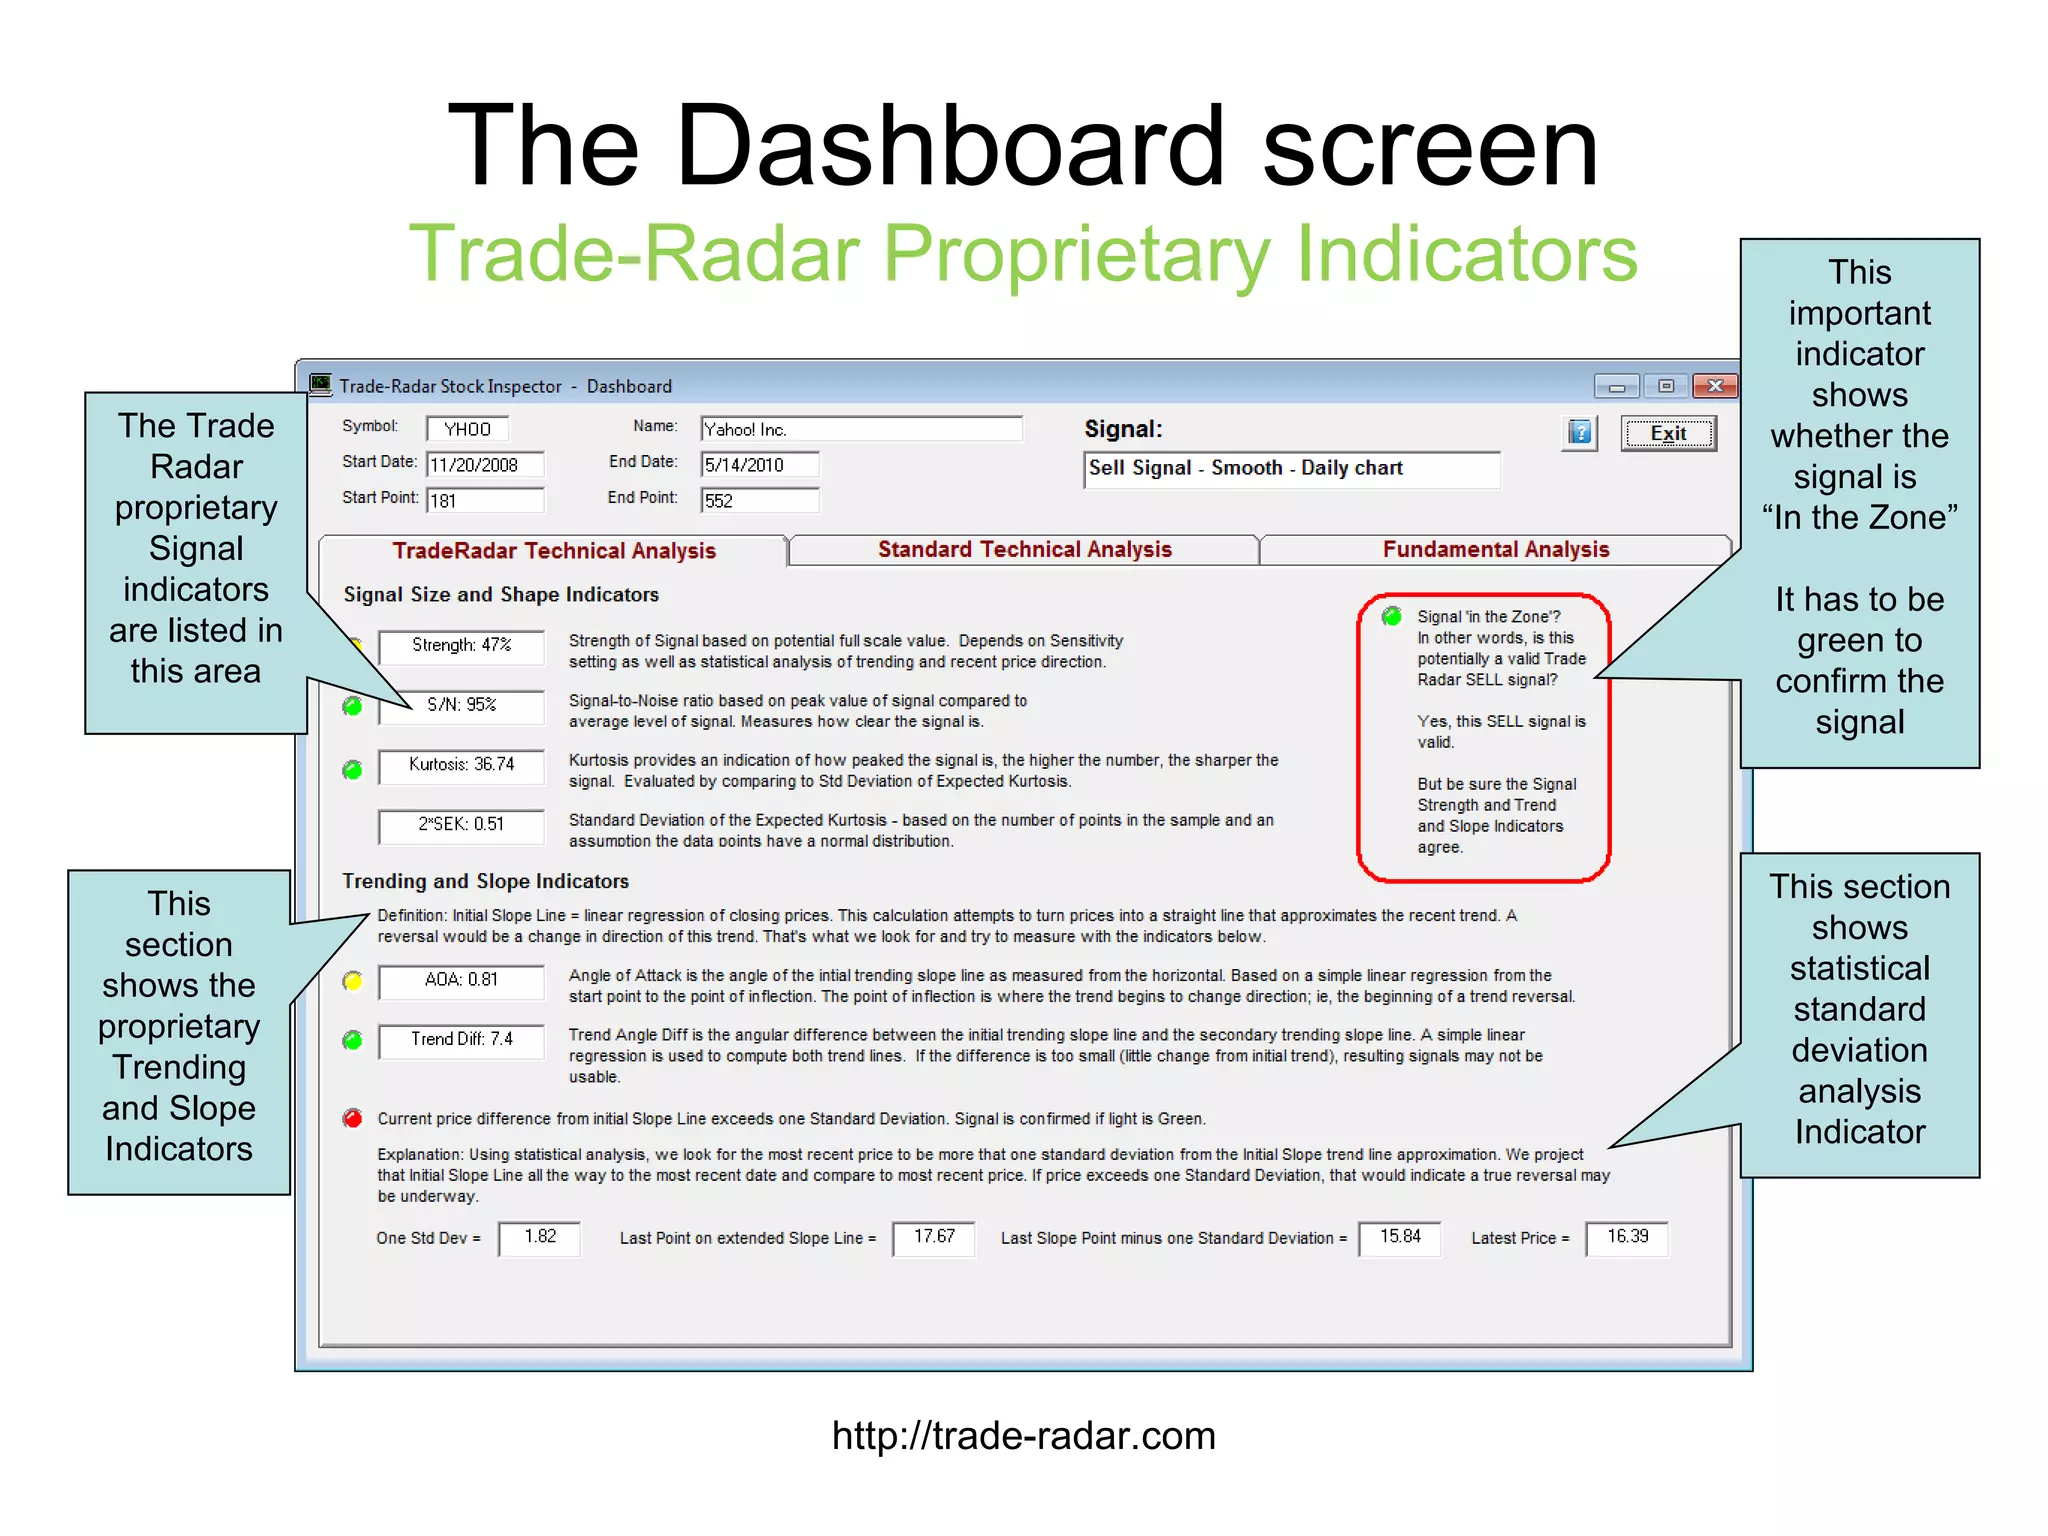
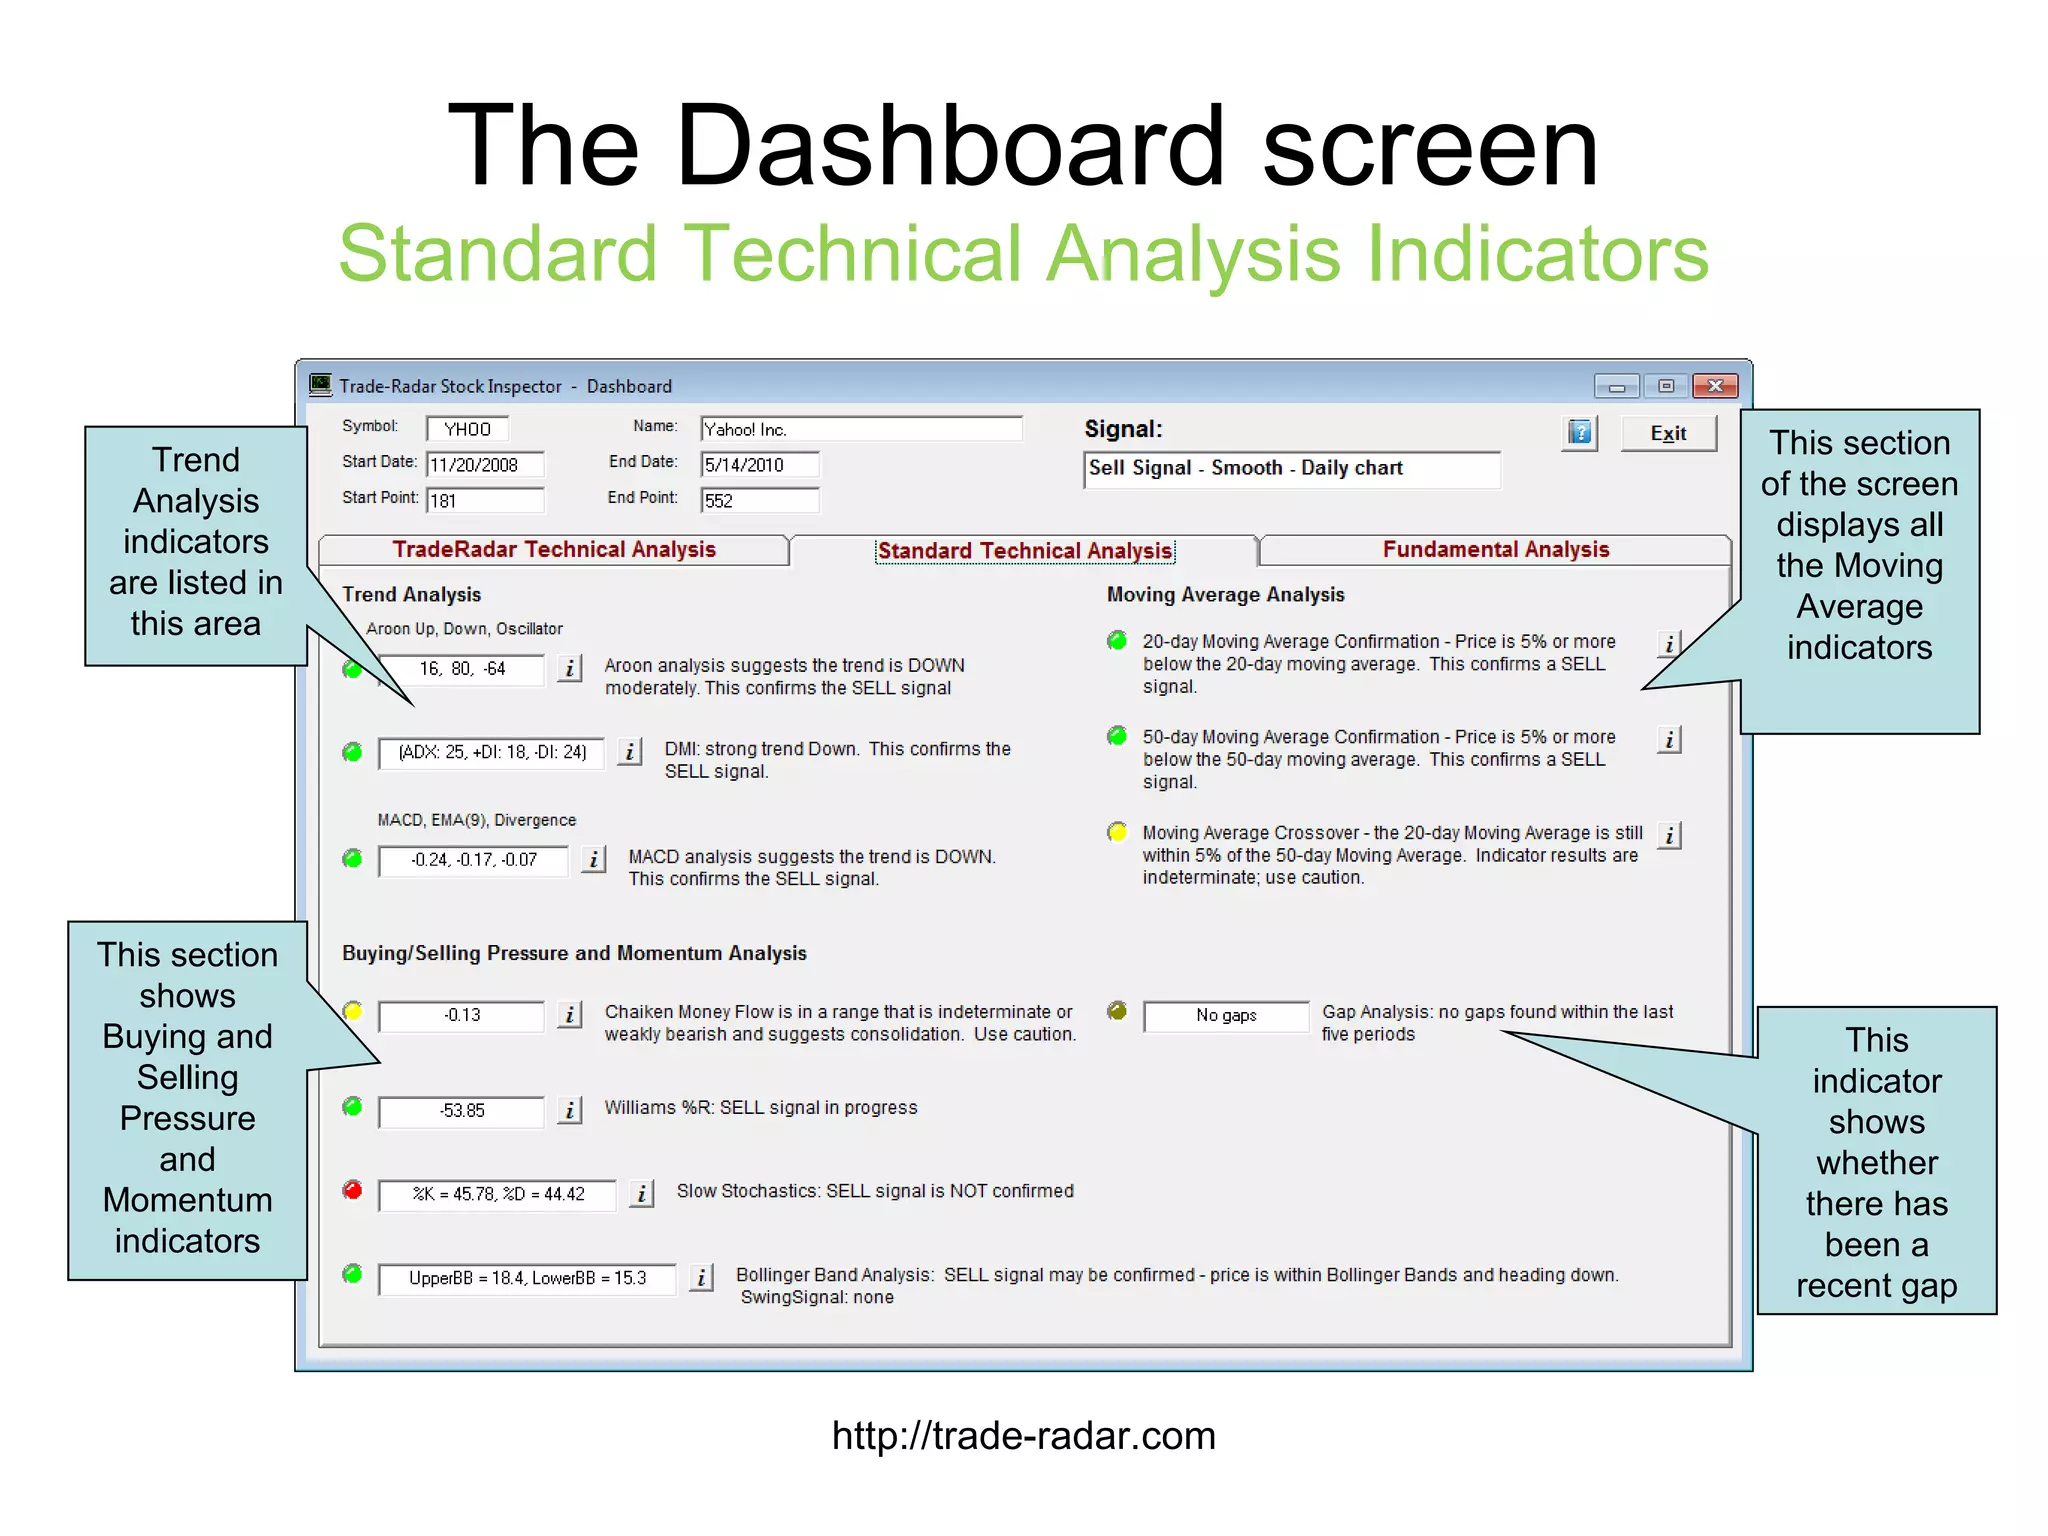
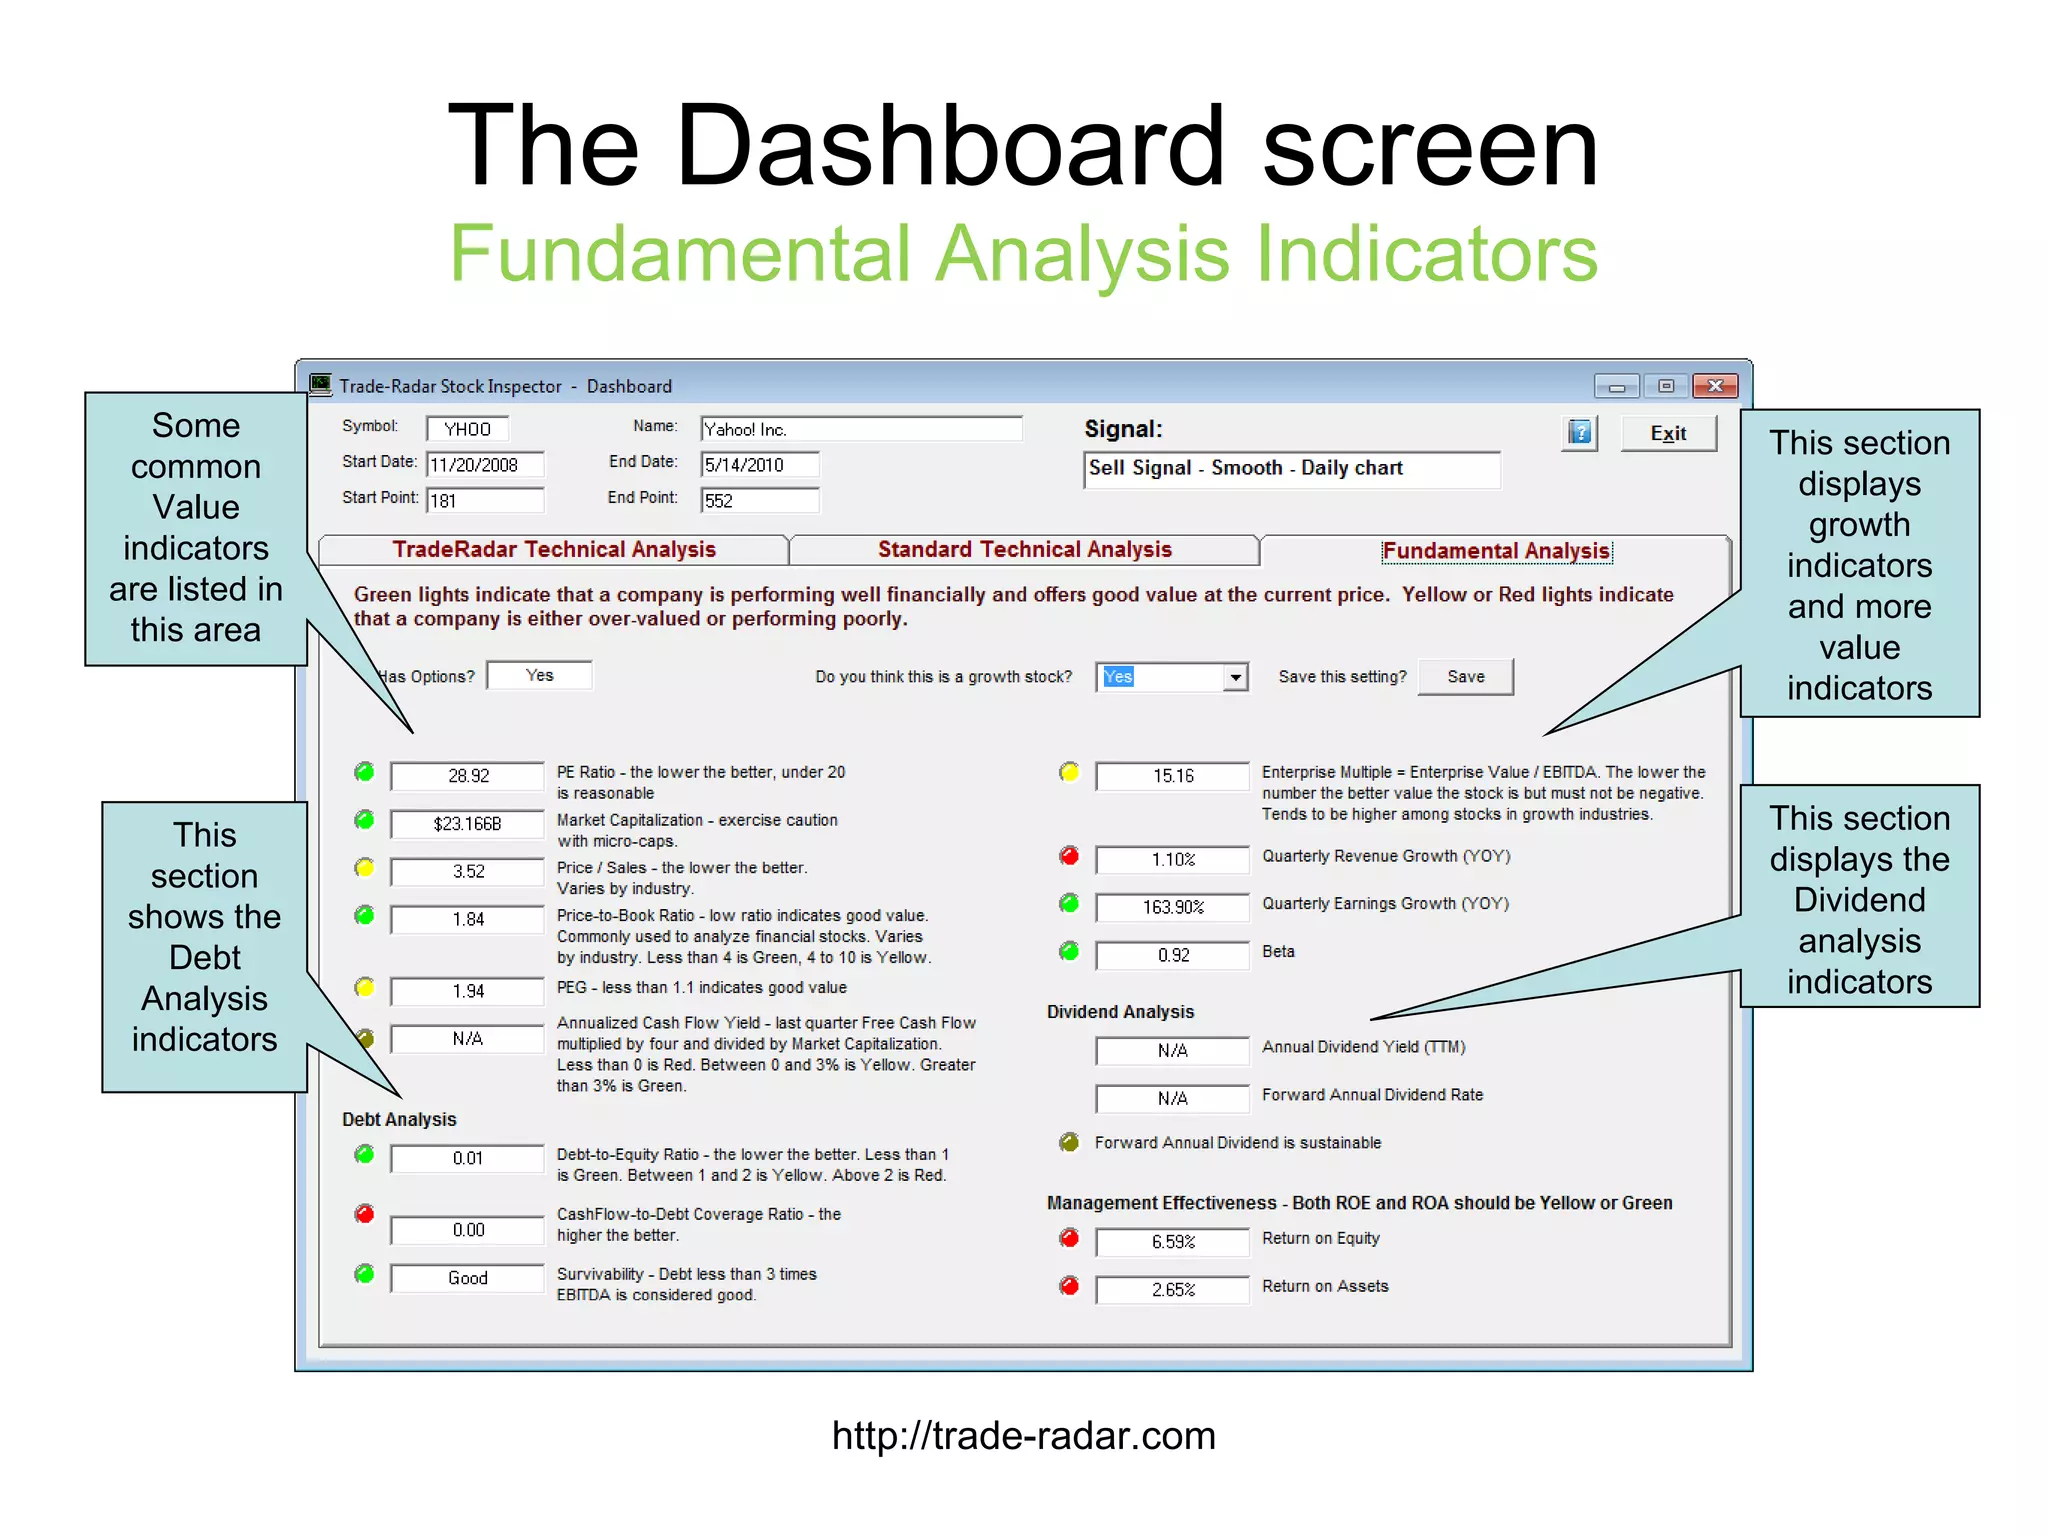
Trade-Radar Stock Inspector Software Finding BUY and SELL signals for stocks and ETFs http://trade-radar.com
The Trade Radar Advantage Software that analyzes  multiple technical and fundamental factors Each factor has a red/yellow/green light that lets you know whether that factor supports a Buy signal or a Sell signal http://trade-radar.com
Basic Chart Layout http://trade-radar.com Open, High, Low and Closing prices. Up-days in green, down-days in red.  50-day moving average in blue 20-day moving average in green Normalized closing prices Auto Checkbox: click for automatic chart setup Select signal type: Buy or Sell Manually set chart’s start date and end date for analysis
To use Automatic setup: Click the Auto checkbox Select a type of signal to look for:  BUY signal – smooth SELL signal – smooth Click the Update Chart button Chart automatically adjusts start date and displays all technical indicators Well, that was easy!  Now see the result on the next slide… Generating Signals Automatically http://trade-radar.com
Chart with all indicators displayed http://trade-radar.com BUY signal peak The signal “Zone” Slope of closing prices Trend line connecting cyclical low prices A bit difficult to see on this screen shot are the Fibonacci retracement lines Values of the Trade Radar indicators. See the Dashboard for interpretation of the numbers.
The Dashboard  Viewing 36 indicators all in one place Technical Indicators Trade-Radar indicators including slope, signal strength, signal-to-noise ratio, trend angles, standard deviation and the “In the Zone” indicator Standard indicators like Aroon, MACD, DMI, moving averages, Chaikin Money Flow, Williams %R, Stochastics, Bollinger Bands, Gaps Fundamental Indicators Value indicators like PE, PEG, Price to Sales, cash flow yield, cash flow to debt coverage, EV-to-EBITDA Market cap, debt to equity, survivability Earnings and revenue growth and beta Management effectiveness (ROE, ROA) Dividend sustainability All indicators are fully explained http://trade-radar.com
Evaluating the indicators Each indicator has an LED that lights up to help you with the evaluation of the signal you are looking for (Buy or Sell) Green: it’s a go! Yellow: use caution Red: it’s a no-go! Fundamental indicators always show company health All green, for example, supports a Buy signal All red or yellow would support a Sell signal http://trade-radar.com
The Dashboard screen Trade-Radar Proprietary Indicators http://trade-radar.com This important indicator shows whether the signal is  “ In the Zone” It has to be green to confirm the signal The Trade Radar proprietary Signal indicators are listed in this area This section shows the proprietary Trending and Slope Indicators This section shows statistical standard deviation analysis Indicator
The Dashboard screen Standard Technical Analysis Indicators http://trade-radar.com This section of the screen displays all the Moving Average indicators Trend Analysis indicators are listed in this area This section shows Buying and Selling Pressure and Momentum indicators This indicator shows whether there has been a recent gap
The Dashboard screen Fundamental Analysis Indicators http://trade-radar.com This section displays growth indicators and more value indicators Some common Value indicators are listed in this area This section shows the Debt Analysis indicators This section displays the Dividend analysis indicators
Making your decision Evaluating a Buy signal: If you are seeing a lot of green lights on the indicators, both technical and fundamental, you can consider the Buy signal to be valid Evaluating a Sell signal: If you are seeing a lot of green lights on the technical indicators it  may  be a valid Sell signal If there are very few green lights on the fundamental indicators, the Sell signal is much more likely to be valid http://trade-radar.com

Trade-Radar Stock Inspector slideshow

  • 1.
    Trade-Radar Stock InspectorSoftware Finding BUY and SELL signals for stocks and ETFs http://trade-radar.com
  • 2.
    The Trade RadarAdvantage Software that analyzes multiple technical and fundamental factors Each factor has a red/yellow/green light that lets you know whether that factor supports a Buy signal or a Sell signal http://trade-radar.com
  • 3.
    Basic Chart Layouthttp://trade-radar.com Open, High, Low and Closing prices. Up-days in green, down-days in red. 50-day moving average in blue 20-day moving average in green Normalized closing prices Auto Checkbox: click for automatic chart setup Select signal type: Buy or Sell Manually set chart’s start date and end date for analysis
  • 4.
    To use Automaticsetup: Click the Auto checkbox Select a type of signal to look for: BUY signal – smooth SELL signal – smooth Click the Update Chart button Chart automatically adjusts start date and displays all technical indicators Well, that was easy! Now see the result on the next slide… Generating Signals Automatically http://trade-radar.com
  • 5.
    Chart with allindicators displayed http://trade-radar.com BUY signal peak The signal “Zone” Slope of closing prices Trend line connecting cyclical low prices A bit difficult to see on this screen shot are the Fibonacci retracement lines Values of the Trade Radar indicators. See the Dashboard for interpretation of the numbers.
  • 6.
    The Dashboard Viewing 36 indicators all in one place Technical Indicators Trade-Radar indicators including slope, signal strength, signal-to-noise ratio, trend angles, standard deviation and the “In the Zone” indicator Standard indicators like Aroon, MACD, DMI, moving averages, Chaikin Money Flow, Williams %R, Stochastics, Bollinger Bands, Gaps Fundamental Indicators Value indicators like PE, PEG, Price to Sales, cash flow yield, cash flow to debt coverage, EV-to-EBITDA Market cap, debt to equity, survivability Earnings and revenue growth and beta Management effectiveness (ROE, ROA) Dividend sustainability All indicators are fully explained http://trade-radar.com
  • 7.
    Evaluating the indicatorsEach indicator has an LED that lights up to help you with the evaluation of the signal you are looking for (Buy or Sell) Green: it’s a go! Yellow: use caution Red: it’s a no-go! Fundamental indicators always show company health All green, for example, supports a Buy signal All red or yellow would support a Sell signal http://trade-radar.com
  • 8.
    The Dashboard screenTrade-Radar Proprietary Indicators http://trade-radar.com This important indicator shows whether the signal is “ In the Zone” It has to be green to confirm the signal The Trade Radar proprietary Signal indicators are listed in this area This section shows the proprietary Trending and Slope Indicators This section shows statistical standard deviation analysis Indicator
  • 9.
    The Dashboard screenStandard Technical Analysis Indicators http://trade-radar.com This section of the screen displays all the Moving Average indicators Trend Analysis indicators are listed in this area This section shows Buying and Selling Pressure and Momentum indicators This indicator shows whether there has been a recent gap
  • 10.
    The Dashboard screenFundamental Analysis Indicators http://trade-radar.com This section displays growth indicators and more value indicators Some common Value indicators are listed in this area This section shows the Debt Analysis indicators This section displays the Dividend analysis indicators
  • 11.
    Making your decisionEvaluating a Buy signal: If you are seeing a lot of green lights on the indicators, both technical and fundamental, you can consider the Buy signal to be valid Evaluating a Sell signal: If you are seeing a lot of green lights on the technical indicators it may be a valid Sell signal If there are very few green lights on the fundamental indicators, the Sell signal is much more likely to be valid http://trade-radar.com