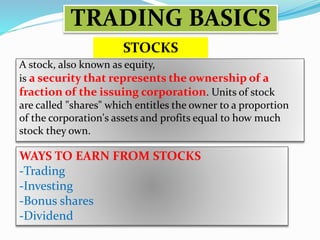
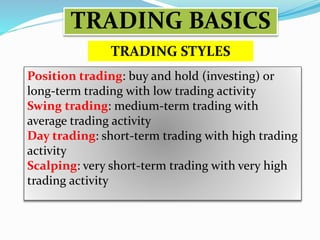
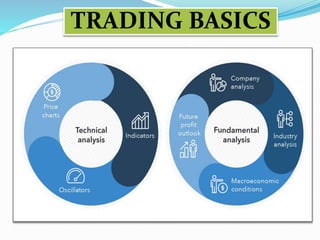
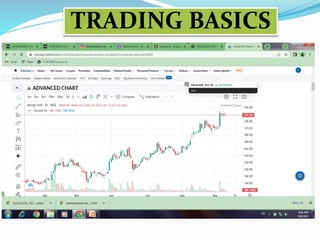
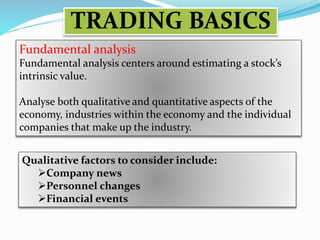
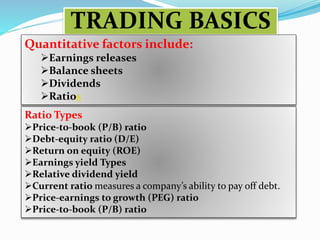
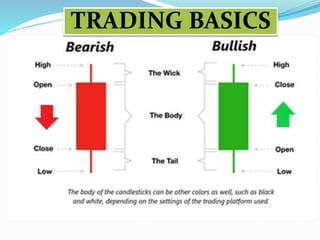
Presented by: Arshad Waseem Khan
TRADING BASICS
A stock, also known as equity,
is a security that represents the ownership of a
fraction of the issuing corporation. Units of stock
are called "shares" which entitles the owner to a proportion
of the corporation's assets and profits equal to how much
stock they own.
STOCKS
WAYS TO EARN FROM STOCKS
-Trading
-Investing
-Bonus shares
-Dividend
TRADING BASICS
1. Determine your investing goals
2. Find companies you understand
3. Determine whether a company has a competitive
advantage
4. Determine a fair price for the stock
5. Buy a stock with a margin of safety
HOW TO CHOOSE GOOD STOCKS
TRADING BASICS
TRADING STYLES
Position trading: buy and hold (investing) or
long-term trading with low trading activity
Swing trading: medium-term trading with
average trading activity
Day trading: short-term trading with high trading
activity
Scalping: very short-term trading with very high
trading activity
TRADING BASICS
TRADING BASICS
TRADING BASICS
Technical analysis focus on
Stock’s price data
movements.
Trends
Patterns
There are wide range of technical indicators
that can be utilized when conducting technical
analysis.
Selection of Technical indicators depends
trading style.
TRADING BASICS
Moving average (MA) is used to identify the direction of a
price trend, without the interference of short-term price spikes
Exponential moving average (EMA) can help confirm
significant market moves and gauge their legitimacy
Stochastic oscillator shows momentum and trend strength by
comparing a specific closing price of an asset to a range of its
prices over time
Moving average convergence divergence (MACD) detects
changes in momentum by comparing two moving averages. It
can help to identify possible buy and sell opportunities around
support and resistance levels
Bollinger bands are used to predict long-term price
movements and useful for recognizing when an asset is trading
outside of its usual levels
the strength of a price trend to help you gather whether an
upward or downward trend is likely to continue
TRADING BASICS
Relative strength index (RSI) is mostly used to help identify
momentum, market conditions and warning signals for
dangerous price movements
Fibonacci retracement can pinpoint the degree to which a
market will move against its current trend
Ichimoku cloud identifies support and resistance levels,
estimates price momentum and provides you with signals to
help with decision-making
Standard deviation helps you to measure the size of price
moves to assist with identifying how likely volatility is to affect
the price in the future
Average directional index illustrates the strength of a price
trend to help you gather whether an upward or downward trend
is likely to continue
TRADING BASICS
Fundamental analysis
Fundamental analysis centers around estimating a stock’s
intrinsic value.
Analyse both qualitative and quantitative aspects of the
economy, industries within the economy and the individual
companies that make up the industry.
Qualitative factors to consider include:
Company news
Personnel changes
Financial events
TRADING BASICS
Quantitative factors include:
Earnings releases
Balance sheets
Dividends
Ratios
Ratio Types
Price-to-book (P/B) ratio
Debt-equity ratio (D/E)
Return on equity (ROE)
Earnings yield Types
Relative dividend yield
Current ratio measures a company’s ability to pay off debt.
Price-earnings to growth (PEG) ratio
Price-to-book (P/B) ratio
TRADING BASICS
TRADING BASICS
TRADING BASICS
TRADING BASICS
TRADING BASICS
TRADING BASICS
TRADING BASICS
HAPPY INVESTING
For any help contact
Arshad Waseem Khan
Mob/WA: 800-601-7003 khanarshadw@gmail.com
Ibrahim Khan
Mob/WA: 800-601-3388

Trading Basics.pptx

  • 1.
  • 2.
    TRADING BASICS A stock,also known as equity, is a security that represents the ownership of a fraction of the issuing corporation. Units of stock are called "shares" which entitles the owner to a proportion of the corporation's assets and profits equal to how much stock they own. STOCKS WAYS TO EARN FROM STOCKS -Trading -Investing -Bonus shares -Dividend
  • 3.
    TRADING BASICS 1. Determineyour investing goals 2. Find companies you understand 3. Determine whether a company has a competitive advantage 4. Determine a fair price for the stock 5. Buy a stock with a margin of safety HOW TO CHOOSE GOOD STOCKS
  • 4.
    TRADING BASICS TRADING STYLES Positiontrading: buy and hold (investing) or long-term trading with low trading activity Swing trading: medium-term trading with average trading activity Day trading: short-term trading with high trading activity Scalping: very short-term trading with very high trading activity
  • 5.
  • 6.
  • 7.
    TRADING BASICS Technical analysisfocus on Stock’s price data movements. Trends Patterns There are wide range of technical indicators that can be utilized when conducting technical analysis. Selection of Technical indicators depends trading style.
  • 8.
    TRADING BASICS Moving average(MA) is used to identify the direction of a price trend, without the interference of short-term price spikes Exponential moving average (EMA) can help confirm significant market moves and gauge their legitimacy Stochastic oscillator shows momentum and trend strength by comparing a specific closing price of an asset to a range of its prices over time Moving average convergence divergence (MACD) detects changes in momentum by comparing two moving averages. It can help to identify possible buy and sell opportunities around support and resistance levels Bollinger bands are used to predict long-term price movements and useful for recognizing when an asset is trading outside of its usual levels the strength of a price trend to help you gather whether an upward or downward trend is likely to continue
  • 9.
    TRADING BASICS Relative strengthindex (RSI) is mostly used to help identify momentum, market conditions and warning signals for dangerous price movements Fibonacci retracement can pinpoint the degree to which a market will move against its current trend Ichimoku cloud identifies support and resistance levels, estimates price momentum and provides you with signals to help with decision-making Standard deviation helps you to measure the size of price moves to assist with identifying how likely volatility is to affect the price in the future Average directional index illustrates the strength of a price trend to help you gather whether an upward or downward trend is likely to continue
  • 10.
    TRADING BASICS Fundamental analysis Fundamentalanalysis centers around estimating a stock’s intrinsic value. Analyse both qualitative and quantitative aspects of the economy, industries within the economy and the individual companies that make up the industry. Qualitative factors to consider include: Company news Personnel changes Financial events
  • 11.
    TRADING BASICS Quantitative factorsinclude: Earnings releases Balance sheets Dividends Ratios Ratio Types Price-to-book (P/B) ratio Debt-equity ratio (D/E) Return on equity (ROE) Earnings yield Types Relative dividend yield Current ratio measures a company’s ability to pay off debt. Price-earnings to growth (PEG) ratio Price-to-book (P/B) ratio
  • 12.
  • 13.
  • 14.
  • 15.
  • 16.
  • 17.
  • 18.
    TRADING BASICS HAPPY INVESTING Forany help contact Arshad Waseem Khan Mob/WA: 800-601-7003 khanarshadw@gmail.com Ibrahim Khan Mob/WA: 800-601-3388