TỔNG ÔN TẬP THI VÀO LỚP 10 MÔN TIẾNG ANH NĂM HỌC 2023 - 2024 CÓ ĐÁP ÁN (NGỮ Â...
Discriminant Analysis-lecture 8
1. 4/30/2012
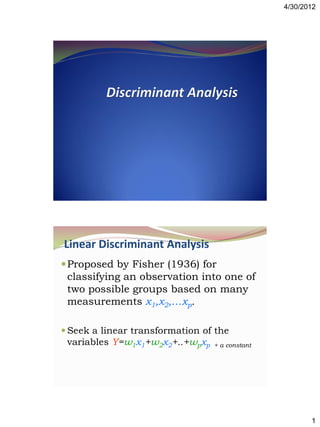
Linear Discriminant Analysis
Proposed by Fisher (1936) for
classifying an observation into one of
two possible groups based on many
measurements x1,x2,…xp.
Seek a linear transformation of the
variables Y=w1x1+w2x2+..+wpxp + a constant
1
2. 4/30/2012
Linear Discriminant Analysis
Discriminant analysis – creates an
equation which will minimize the
possibility of misclassifying cases into their
respective groups or categories.
The purposes of discriminant analysis (DA)
Discriminant Function Analysis (DA)
undertakes the same task as multiple
linear regression by predicting an
outcome.
However, multiple linear regression is
limited to cases where the dependent is
numerical
But many interesting variables are
categorical,
2
3. 4/30/2012
The objective of DA is to perform
dimensionality reduction while preserving as
much of the class discriminatory information
as possible
Assume we have a set of D-dimensional
samples {x 1, x2, …, xN}, N1 of which belong to
class ω1, and N2 to class ω2.
We seek to obtain a scalar y by projecting
the samples x onto a line
y = wTx
•The top two distributions overlap too much and do not
discriminate too well compared to the bottom set.
•Misclassification will be minimal in the lower pair,
•whereas many will be misclassified in the top pair.
3
4. 4/30/2012
Linear Discriminant Analysis
Assume variance matrices equal
Classify the item x at hand to one of J groups
based on measurements on p predictors.
Rule: Assign x to group j that has the
closest mean
j = 1, 2, …, J
Distance Measure: Mahalanobis Distance.
Linear Discriminant Analysis
Distance Measure:
For j = 1, 2, …, J, compute
d j x x x j Spl x x j
T 1
Assign x to the group for which dj is minimum
S is the pooled estimate of the covariance
pl
matrix
4
5. 4/30/2012
…or equivalently, assign x to the
group for which
L x x S
1 1 1
x
T T
j j pl
2 x S x
j pl j
is a maximum.
(Notice the linear form of the equation!)
Linear Discriminant Analysis
…optimal if….
• Multivariate normal distribution for the
observation in each of the groups
• Equal covariance matrix for all groups
• Equal prior probability for each group
• Equal costs for misclassification
5
6. 4/30/2012
Relaxing the assumption of equal prior
probabilities…
L x ln p j x S
T 1
1 1
x
T
j
j
pl
2 x S x
j pl j
pj being the prior probability for the jth
group.
Relaxing the assumption of equal
covariance matrices…
1
Q x ln p j ln S
j j
2
x x S x x j
T 1
j j
result?…Quadratic Discriminant
Analysis
6
7. 4/30/2012
Quadratic Discriminant Analysis
Rule: assign to group j if Q x
j
is
the largest.
Optimal if
the J groups of measurements are
multivariate normal
Other Extensions & Related Methods
Relaxing the assumption of normality…
Kernel density based LDA and QDA
Other extensions…..
Regularized discriminant analysis
Penalized discriminant analysis
Flexible discriminant analysis
7
8. 4/30/2012
Evaluations of the Methods
Classification Table (confusion matrix)
Predicted group
Actual group Number of
observations
A B
A nA n11 n12
B nB n21 n22
Evaluations of the Methods
Apparent Error Rate (APER):
# misclassified
APER =
Total # of cases
….underestimates the actual error rate.
Improved estimate of APER:
Holdout Method or cross validation
8
9. 4/30/2012
Fisher's iris dataset
•The data were collected by Anderson and used
by Fisher to formulate the linear discriminant
analysis (LDA or DA).
•The dataset gives the measurements in
centimeters of the following variables:
1- sepal length, 2- sepal width, 3- petal length,
and 4- petal width,
this for 50 fowers from each of the 3 species of
iris considered.
•The species considered are Iris setosa,
versicolor, and virginica
setosa versicolor virginica
9
10. 4/30/2012
An Example: Fisher’s Iris Data
Actual Number of Predicted Group
Observations
Group
Setosa Versicolo Virginica
r
Setosa 50 50 0 0
Versicolor 50 0 48 2
Virginica 50 0 1 49
Table 1: Linear Discriminant Analysis
(APER = 0.0200)
An Example: Fisher’s Iris Data
Actual Number of Predicted Group
Observations
Group
Setosa Versicolo Virginica
r
Setosa 50 50 0 0
Versicolor 50 0 47 3
Virginica 50 0 1 49
Table 1: Quadratic Discriminant Analysis
(APER = 0.0267)
10
11. 4/30/2012
An Example: Fisher’s Iris Data
2.5
v v
v v v
v v v v v
v v v
v v v v
2.0
v v v v v
v v v
v v v v v v c
v
v c
v
c v c c
1.5
c
v c c
v c c c c
v c c c c c c
Petal Width
c c c c c c
c c c c
c c
1.0
c c c c c c
s
0.5
s
s s s s s
s s s s s
s s s s s s s s s s s s
s s s s
2.
0 2.
5 3.
0 3.
5 4.
0
S Wi t
epal dh
An Example: Fisher’s Iris Data
2.5
o
v o
v
o
v o
v o
v
o
v o
v o
v o
v o
v
o
v o
v o
v
o
v o
v o
v o
v
2.0
o
v o
v o
v o
v o
v
o
v o
v o
v
o
v o
v o
v o
v o
v o
v o
c
v
o
v x
c
o
c o
v x
c x
c
1.5
x
o
c
v x
c x
c
v x
c x
c x
c x
c
o
v x
c x
c x
c x
c x
c x
c
Petal Width
x
c x
c x
c x
c x
c x
c
x
c x
c x
c x
c
x
c x
c
1.0
x
c x
c x
c x
c x
c x
c
+
s
0.5
+
s
+
s +
s +
s +
s +
s
+
s +
s +
s +
s +
s
+
s +
s +
s +
s +
s +
s +
s +
s +
s +
s +
s +
s
+
s +
s +
s +
s
2.
0 2.
5 3.
0 3.
5 4.
0
S Wi t
epal dh
11
12. 4/30/2012
Summary
LDA is a powerful tool available for
classification.
Widely implemented through various
software
Theoretical properties well
researched
12