
Recommended
Recommended
More Related Content
What's hot
What's hot (20)
Viewers also liked
Viewers also liked (19)
Similar to 3 nutrientcycling11
Similar to 3 nutrientcycling11 (20)
More from jbgruver
More from jbgruver (20)
Recently uploaded
Recently uploaded (20)
3 nutrientcycling11
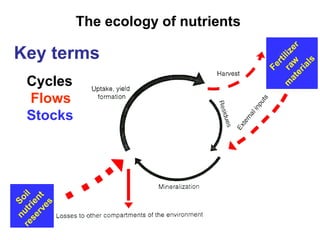
- 1. The ecology of nutrients Key terms Cycles Flows Stocks
- 2. Internal cycling is most important in natural ecosystems Nutrient inputs • Chemical weathering of rocks • Biological fixation of atmospheric N • Deposition of elements from atmosphere Ecosystem • Transfer of nutrients Between plants and soil Between organic and inorganic forms Internal cycling • Changes in ionic forms • Biological uptake • Interactions with mineral surfaces • Leaching • Gaseous emissions • Wind and water erosion • Fire • Harvest Nutrient losses
- 3. Source of plant nutrient (% of total) Nutrient Deposition/fixation Weathering Recycling Nitrogen 7 0 93 Phosphorus 1 < 10 > 89 Potassium 2 10 88 Calcium 4 31 65 Data from (Whittaker et al. 1979)
- 4. Which forms of nutrients in soil are bioavailable? All become bioavailable (in natural ecosystems and farm “active” OM fields) but rates of “flow” vary widely. humus exchangeable ions ions in solution weatherable minerals
- 5. Nutrient ecology in agroecosystems What’s missing?
- 6. Environmental losses are sometimes larger How big is this arrow normally? than crop removal Dissipation into the surrounding environment via erosion, leaching, volatilization…
- 7. N budget for Rothamsted wheat experiment From the To the atmosphere atmosphere Crop 50 10-50 Fertilizer uptake 200 200 SOM - N 4000 160 80 NO3- + NH4+ Microbial Biomass N #s = kg/ha (lbs/ac= 0.89*kg/ha) Loss by leaching 20-100 The total N stocks in soil normally greatly exceed annual flows
- 8. Without fertilization, N is often a limiting nutrient (i.e., N mineralization is often much slower than potential crop uptake) Peak uptake ~ 3 lbs of N/ac/day Potential N uptake by wheat pasture Mineralized soil N More data from Rothamsted Jenkinson
- 9. "The most effective management strategy will be one that recognizes the pattern of nitrogen demand by the crop and the nitrogen release characteristics of all important nitrogen sources to provide adequate, but not excessive levels of soil nitrogen throughout the growing season." Peak uptake = 5-10 lbs (Doerge, 1991) of N/ac/day
- 10. Timing of N availability has a big impact on uptake vs. losses Crop uptake (Dinnes et al., 2001)
- 12. Point source vs. non-point source pollution
- 13. Average soil loss on IA farms is ~ 5 tons/ac/yr Total lbs in % of total in Element 5 tons of soil* 150 bu of corn N 20 15% P 2.6 9% K 150 452% Ca 92 4600% Mg 44 550% S 12 120% * Average total nutrient levels for US soils http://pubs.usgs.gov/pp/1270/pdf/PP1270_508.pdf
- 14. Where do eroded nutrients go? Most are relocated to lower landscape positions but do *not* end up in water bodies!
- 15. Nutrient pollution (Eutrophication) Excess nutrients promote algal blooms in aquatic ecosystems creating unusually high biological oxygen demand when the algae dies and begins to decompose. Conventional wisdom: Nitrogen is the most limiting nutrient in marine systems. Reality is more complex. Phosphorus is the most limiting nutrient in freshwater ecosystems
- 16. In 2002 5,549 miles (out of 15,491) of Illinois streams did not meet IEPA water quality standards.
- 17. Understanding the “Dead Zone” There are a ~ 400 recurring dead zones world wide! Almost the entire eastern seaboard has recurring dead zones
- 18. “Geologic evidence shows that dead zones were not a naturally recurring event in the Chesapeake Bay or most other estuarine ecosystems” says Diaz. "Dead zones were once rare. Now they're commonplace”.
- 19. Understanding Hypoxia Layer of nutrient rich fresh Fresh water water over salt water is less dense than salt water
- 20. What is causing the hypoxic zone in the Gulf ?
- 22. Deposition of biological available N 1990s 50 lbs N/acre
- 23. Ammonia cloud over the midwest Where is all this ammonia coming from ??
- 24. Animal manure is the primary source
- 25. Sewage is a major source of P • 47% of total P in IL rivers Why is there so much P in sewage? • 70% for Illinois River, 33% for others in state Very different than N where agriculture is the dominant source!
- 27. Is the Dead Zone in the Gulf increasing in size ? Yes… but not consistently. Yes... but there is lots of variability!
- 28. The location of hypoxic zones is dynamic! Frequency of Occurrence 1985 - 1999 Rabalais, et al. Distance Paris to London = 490 km 28
- 29. GULF OF MEXICO HYPOXIA MAPPING
- 30. N and P levels in the Mississippi and all significant tributaries are monitored
- 31. Why does so much N get into Illinois’ rivers ???
- 33. Artificial drainage in the United States % of land drained ~ 40% of IL cropland has been tiled http://www.ars.usda.gov/SP2UserFiles/Place/36251500/TheExtentofFarmDrainageintheUnitedStates.pdf
- 34. Optimizing N availability for crops while maintaining water quality is a serious challenge! Nitrogen uptake by corn 220 lbs of N / 4 million lbs of water = 0.000055 55 ppm The EPA drinking water standard is 10 ppm NO3-N
- 35. Why is nutrient pollution a persistent problem if…
- 36. Agroecosystems are not factories!
- 37. http://nanc.ipni.net/articles/NANC0005-EN Aver Actual nutrient removal may vary by 30% or more depending on the specific growing conditions of the crop such as soil fertility level, yield, soil moisture, crop vigor, and limiting nutrients (interactions) as well as the actual crop variety and fertilizer program. Changes to soil fertility may differ from the amount removed by the crop
- 38. IL Agronomy Handbook - maintenance rates of P2O5 and K2O
- 39. P Balance in IL M. David
- 40. P balance for IL in 2008 606,500 tons of P2O5 removed in grain 2.23 billion bu of CORN 404,700 tons P2O5 428 million bu of BEANS 179,760 tons P2O5 74 million bu of WHEAT 22,080 tons P2O5 398,607 tons of P2O5 applied as fertilizer Manure + Biosolids < 30,000 tons P2O5
- 41. High fertilizer prices in fall of 2008 = less application P balance for McDonough County in 2009 crop P2O5/unit lbs of P2O5 corn 28576000 bu 0.38 10,858,880 soybeans 5657600 bu 0.84 4,752,384 wheat 58800 bu 0.6 35,280 misc-hay 7020 tons 15 105,300 alfalfa 26790 tons 12 321,480 8037 tons of P2O5 removed in crops According to IDOA records, only 3250 tons of P2O5 were purchased (fall 2008/spring 2009)
- 42. Soil test P levels are dropping in the Corn Belt Change between 2005 and 2010 % of samples below critical level
- 43. The U of I recommends a build and maintenance approach for P and K Critical Level
- 44. In contrast with P, N inputs and outputs are currently ~ balanced in IL Units are 1000 metric tons N / yr M.David
- 45. Back in the sodbusting days, IL was losing over 500,000 tons of N/yr ! Units are 1000 metric tons N / yr M.David
- 46. Mining Prairie N Net anthropogenic inputs M.David
- 47. N inputs to IL soils (alfalfa and other forage legumes) Mg = 1 x 10⁶ g = 1000 kg = 1 metric ton 1 metric ton = 2204.6 pounds 1 metric ton = 1.1023 US tons M.David
- 48. N outputs from IL soils M.David
- 49. Photo: MARGARET BOURKE-WHITE So where do the nutrients in IL grain end up? Aerial view of Cargill grain elevator w. barges lined up on the bank of the Chicago River in 1951
- 50. Surplus P and N State P N --Million of lbs in excess-- DE 7.3 14.6 MD 10.4 19.6 NJ 0.9 1.8 NY 3.3 4.2 PA 23.7 33.8 VA 24.8 42.3 (Source: USDA, 2001)
- 51. Redistribution of nutrients in the Mid-Atlantic region excess Counties with large excesses have the most livestock Is it possible to send these excess nutrients back to the Corn Belt??
- 53. Keith Bowers of Multiform Harvest in Seattle has developed a system to remove phosphates from swine and dairy manure. It involves changing the chemistry of the liquid manure to form struvite, a phosphate compound that is precipitated out of the slurry. Struvite, magnesium ammonium phosphate, is sometimes deposited naturally as scale on wastewater pipes and in the human body as kidney stones. It’s in demand as a slow release fertilizer and magnesium source.
- 54. Some parts of the world have serious nutrient deficits Level of nutrient deficit http://www.fao.org/docrep/006/y5066e/y5066e02.jpg
- 55. What do you think the nutrient balance is like on organic farms?? N Most organic farms in developed countries do not have nutrient deficits even though they don’t use conventional fertilizers. P K http://www.organic.aber.ac.uk/library/Nutrient%20budgets%20on%20organic%20farms.pdf
- 56. Nutrient flows can be monitored at different geographic and temporal scales
- 57. Typical losses of N associated with consumption of grain and meat Grain What happens to the reactive N that doesn’t make to our dinner plates ? Meat
- 58. All of the N losses identified on the previous slide are opportunities for nutrient recycling Many of these opportunities are already being realized by innovative farms/agribusinesses
- 59. What is the nutrient content of corn stover? At plant maturity, corn stover on average contains 7 lb of P2O5 per ton and 30 lb of K2O per ton. There can be large variability in the actual amounts of P and especially K in the stover. P content typically varies between 5 and 8 lb of P2O5 per ton, and K content can vary between 5 and 40 lb of K2O per ton. Sources of variation include growing season conditions, hybrid, general fertility of the soil, and the time elapsed and amount and frequency of precipitation since the crop reached maturity and the time the stover was removed from the field. While phosphorus (P) in stover has low mobility because it is present in organic forms, potassium (K) is present in a highly soluble inorganic form. Leaching from stover with rainfall is thus more pronounced for K than for P
- 60. N P K 20% maintenance 13% maintenance 12% maintenance 20% 27% 13% 60% 60% 75% urine feces N 50% 50% P 10% 90% K 90% 10% http://extension.oregonstate.edu/catalog/html/em/em8586/
- 61. Annual manure production and nutrient value for a 100 cow dairy Manure constituent Lbs/year/100 cows Probable $ value Raw manure (feces + urine) 5,045,000 Values would be much Water in fresh manure 4,458,990 higher if calculated using current fertilizer prices! Total solids 586,000 Total N (lb) 23,400 $3,5101 Total P (lb) 4,800 $2,8801 Total K (lb) 15,100 $2,2651 TOTAL VALUE of N, P, and K $8,655 1Based on assumed values of $.30/lb N, $.60/lb P, and $.15/lb K; N recovered was 50% of excretion, thus, 50% volatilized.
- 63. Concentrated Animal Feeding Operations (CAFOs) in IL There are ~ 500 “large" CAFOs and ~ 2,700 "Medium" CAFOs in IL. These CAFOs are required to: Apply for a National Pollutant Discharge Elimination System (NPDES) Permit Submit an Annual Report Develop and implement a manure and wastewater handling plan (Nutrient Management Plan).
- 64. In Illinois, there are actually 3 different types of manure management plans that livestock facilities may be required to have (NRCS, IL DOA, and IL EPA). U of I Extension has worked with NRCS, IL DOA, IL EPA to develop one workbook of forms and instructions that when completed by a producer, will comply with the requirements of all 3 agencies.
- 67. Optimal nutrient management involves a lot more than just balancing inputs and outputs!
- 68. 3 main strategies for Conservation better nutrient Augmentation cycling Activation
- 69. Nutrient conservation = minimizing environmental losses
- 70. Nutrient augmentation = add nutrients that are deficient Real nutrient management is more complicated than the law of the minimum!! http://www.ipni.net/ppiweb/bcrops.nsf/$webindex/C77D9DFB6F5F2580852568F000676B0E/$file/98-3p12.pdf Corn yield (bu/ac) N rate (lbs/ac) Availability of one nutrient can increase uptake of another
- 71. Biological activation ! Continuous corn with hairy vetch
- 72. Cliff Schuette’s farm in S IL Brassicas also help to activate residue decomposition
- 74. In a 3-yr field experiment, ammonium sulfate (AS) and urea-ammonium nitrate solution (28% UAN) were applied to corn residues in November at 30 lb N/acre. Other N treatments included 100 lb N/acre as AS applied in the fall and spring and various combinations of spring and fall N to provide a total of 190 lb N/acre. Initial corn residue amounts ranged from 5600 to 7000 lb dry matter per acre. In 1999 and 2000, time and source of N application and residue chopping did not affect N mineralization, residue decomposition, or soil temperature. In 2001, residue decomposition measured in June was increased by fall N treatments, but did not affect N mineralization or soil temperature. Fall N applications to promote corn residue decomposition did not improve no-till corn yields and do not appear to be justified. http://www.soils.wisc.edu/extension/area/horizons/2001/Napp_residuedecomposition.pdf
- 75. The value of fall applications of N on residue recycling is a hotly debated topic! Recent discussion on Ag Talk http://talk.newagtalk.com/forums/thread-view.asp?tid=255365&mid=1953006#M1953006
- 76. Most responses raised more questions than answers
- 77. Excessive residue clearly can inhibit corn growth! This is not exclusively a nutrient problem! So… What is the best strategy for residue recycling???
- 78. There is no single best strategy for recycling residues! https://www.jungseedgenetics.com/Jung%20Seed%20Genetics%20Agronomic%20Library/agronomic_spotlight_-_managing_the_effects_of_crop_residue_in_continuous_corn_rfs.pdf
- 79. LIME TO WIN From Farm Journal Media Soil Acidity Affect on Plant Nutrient Availability By Darrell Smith, Farm Journal Conservation & Machinery Editor Trying to maximize corn profits without understanding acidity is like building a skyscraper without pouring a foundation first—the entire structure will probably come crashing down. Managing pH levels becomes even more important if you’re growing continuous corn. “I’ve looked at many yield comparisons trying to figure out why one farmer raises 220-bu. corn and another, with similar soils, gets only 180 bu.,” says Farm Journal Field Agronomist Ken Ferrie. “There could be many reasons, but pH is right up there…. If you have the proper pH, you don’t fight residue because microbes decompose it. Yields show smaller peaks and valleys because yields in acid soils fall apart in dry years. Managing pH is a major part of weatherproofing soil”.
- 81. http://www.misa.umn.edu/prod/groups/cfans/@pub/@cfans/@misa/documents/asset/cfans_asset_287004.pdf
- 82. Overview of Hislop farm 1500 sow farrow-to-wean operation 32,000 piglets (with an average weight of 10 lbs) are sold off the farm each. 1500 acres of crops - 750 acres of corn - 50 % sold off the farm, 750 acres of soybeans – 100% sold off the farm. ~ 1300 tons of feed purchased each year. Manure from the sow operation is applied exclusively to corn ground. Fertilizer is also applied to corn ground.
- 83. Nutrient inputs Purchased feed Purchased fertilizer Biological N fixation
- 84. Nutrient inputs How many tons of N, P and K are in 1300 tons of purchased feed ? Feed analysis? N 2% of 1300 tons = ? of N P 0.8% of 1300 tons = ? tons of P K 0.4% of 1300 tons = ? tons of K
- 85. Nutrient inputs How many tons of N, P and K are in the purchased fertilizer ? Fertilizer program? Acres? Fertilizer receipts? N 750 acres*100 lbs/acre*1 ton/2000 lbs = ? tons N P 750 acres*25 lbs/acre*1 ton/2000 lbs = ? tons P K 750 acres*50 lbs/acre*1 ton/2000 lbs = ? tons K
- 86. Nutrient inputs Biological N fixation ~ 3 lbs of N fixation per bushel of beans 750 acres of soybeans*50 bu/acre*3 lbs of N fixation/bu
- 87. Total nutrient inputs ∑ Feed Fertilizer Biological N fixation
- 88. Nutrient outputs ∑ Marketed grain Marketed piglets Environmental losses
- 89. Nutrient cycling on-farm Nutrients in manure Nutrients in crop residues Nutrients in 50% of corn grain
- 90. You are welcome to analyze your family’s farm or any other farm with which you are affiliated.