SlideShare a Scribd company logo
1 of 4
Download to read offline
DR HORTON – PARTNER LETTER EXCERPT
                                                                  Jason C. Norbeck, CFA
                                                                     Managing Partner
                                                                  JCN Investments, LLC


JULY 2010 - DR HORTON is the most dominant homebuilder in the United States, the 700lb gorilla of the industry and the company’s 1st quarter
results highlight this fact. DR Horton’s 1st quarter results were materially better than that of its competitors and while DR Horton’s results have no
doubt been aided by increased demand related to the tax credit, this is a factor that favorably impacted the entire industry and cannot be used to explain
DR Horton’s strong relative performance. Sales orders (new contracts) increased by a staggering 56% (the second consecutive quarter that DR Horton
has achieved sales order growth greater than 50%) and DR Horton was one of only two public builders to report an increase in revenue (16% increase)
in the quarter. DR Horton was also one of only two public homebuilding companies to report a profit for the seasonally slow first quarter and the
company produced the highest level of sales per employee in its industry. It is becoming increasingly more apparent that DR Horton has been and will
be able to capitalize on the distressed conditions in its industry at a faster pace and to a greater extent than I had previously anticipated. This is in large
part due to the company’s unique business model. DR Horton’s results indicate that the company can grow regardless of the challenging conditions in
the housing market.


                               1Q 2010 Year over Year % Change                                         1Q 2010 Sales per Employee
                                                     Sales     Revenue

                    DR Horton                         56.0%             16.1%                   DR Horton                $    488,000
                    MDC Holdings                      34.9%            -16.4%                   Meritage                 $    382,857
                    Lennar                            20.1%             -4.9%                   Ryland                   $    270,854
                    Meritage                          15.5%            -13.0%                   KB Home                  $    263,571
                    KB Home                           -4.4%            -14.1%                   MDC Holdings             $    236,639
                    Pulte/Centex                     -12.2%            -26.7%                   Hovnanian                $    211,429
                    Ryland                           -12.7%             -5.7%                   Pulte/Centex             $    191,404
                    Hovnanian                        -19.6%            -19.9%                   Lennar                   $    163,755


Before I compare DR Horton’s operations to that of its public competitors, it is important to note that public homebuilders as a group are positioned to
benefit tremendously from the collapse of the housing market. During the boom, the majority of new homes in this country were built by small private
builders, mostly financed by loans (collateralized by land) from commercial banks. The collapse of the housing market has permanently altered the
landscape of residential construction finance in a way that greatly favors public builders. In order to appreciate the opportunity that lies ahead for the
large public homebuilding companies (who are not reliant upon collateralized loans from commercial banks) it helps to understand how commercial
banks operate and how they are regulated.

The banking industry operates like a herd of elephants, chasing loan categories as a group while at the same time never forgetting their past
transgressions (an elephant never forgets). Banking history is marked by severe disruptions or crises often highlighted by losses related to a single loan
category. For example, in the early to mid 80s banks became overexposed to “LDC” loans (Lesser Developed Countries) now known as Emerging
Market Debt. The US Treasury eventually guaranteed a significant amount of LDC loans (via Brady Bonds) to prevent a large number of major banks in
the US from being declared insolvent. In the late 80s, “HLT” loans (Highly Leveraged Transactions) also known as Junk Bonds and now referred to as
LBO loans (Leveraged Buy-Out) rocked the banking industry. In the early 1990s commercial banks experienced significant losses related to a downturn
in the commercial real estate market.

Banking regulation and as a result bank lending tends to be backward looking and each crisis is followed by a “Well, we can’t do that again” mentality
that restricts a bank’s ability and willingness to lend to that specific loan category (regulators never forget). As a result, the composition of a commercial
banks’ loan portfolio has evolved to exclude Emerging Market Debt and LBO Debt and there are numerous enhanced regulatory restrictions related to
commercial real estate lending. The crisis impacting Greece and potentially other nations is of little consequence to the US banking industry because
even the most “international” US banks have virtually eliminated their exposure to foreign government loans as a result of the prior LDC crisis. Also,
the lending restrictions brought about by the previous crisis related to commercial real estate lending is a major reason why the current weakness in the
commercial real estate market, while equally severe to that of the early 90s (if not worse) has not led to the significant losses for the banking industry
that many had anticipated.

This recent crisis has been the most severe, has had many causes and has affected a wide range of financial institutions. However if one were to solely
focus on the loan portfolios of the Commercial Banks (separate out those banks with Investment Banking divisions and the Mortgage Companies/Thrifts)
the crisis is clearly centered in residential construction lending. Beyond the obvious distress in the housing market, the nature of a distressed residential
construction loan is such that the degree to which a bank is required to charge off the loan has been well beyond what anyone imagined possible before
the downturn (if you question this statement I suggest you give Zions’ Chief Credit Officer a call). When a loan is showing signs of distress and is
backed by collateral, the bank is generally required to obtain a third party appraisal of that collateral and charge the loan down to its appraised value (or
even slightly below). The lack of documentable cash flow has caused a decline in the appraised value of residential construction projects that is
destructively severe. So much so that it is impossible to imagine a future banking regulatory environment that does not involve greater restrictions on
residential construction lending for commercial banks. The severity of loss in this category has been so high and the size of the average residential
construction loan is of sufficient size (usually many millions of dollars) that even for loans that are economically attractive and even without regulatory
restrictions a bank simply cannot afford to risk the size of the potential charge to capital if the performance of that project does not live up to
expectations. As a result, residential construction finance has been altered for a majority of the industry’s participants because banks will be materially
less willing to accept the assets of a residential construction project as collateral for a loan. Just yesterday, a Citigroup analyst released a survey of private
homebuilding companies that included the following quote: "the vast majority of survey participants reported that acquiring AC&D (Acquisition
Construction and Development) financing from banks remains difficult if not impossible to source." Lending conditions for private builders are not
likely to improve any time soon.

Even the most pessimistic housing bears acknowledge that population and demographic trends dictate that our country will need to build homes at a rate
that is ultimately 2 to 3 times greater than the current pace. However, the eventual material increase in demand for new homes will not be accompanied
by a similar material increase in the availability of financing for new home construction (at least from the banking industry). As a result the large public
builders that finance residential construction via substantial equity and debt that is based on their credit rating as an operating company (not
collateralized by land) are in a position to reap a lion’s share of the rewards related to a housing recovery.

Not only is DR Horton one of a small group of public builders that have widened their competitive advantage in relation to smaller private builders, DR
Horton has also widened its advantage over its public competitors. DR Horton’s point of differentiation comes from the fact that it starts the vertical
construction of a home before it has a buyer. The industry refers to this strategy as “spec” (speculative) building. Most homebuilders either do not
engage in the building of “spec” homes or do so in a much more limited degree. The majority of homebuilding companies operate a “Built to Order”
strategy in which vertical construction is delayed until the home has been sold.

As one might infer by its name, DR Horton’s “spec” strategy is often categorized as the riskier of the two strategies (even chaotic) by analysts and the
industry. This is incorrect, as the assets of a homebuilder tied to vertical construction are its most attractive because a completed home is liquid and can
be converted to cash within just a few months (even in a weak real estate market) and because the payback period for the investment is short and the
return on capital is high. In contrast, assets related to Land Development (which is a homebuilder’s alternative capital requirement) are illiquid
(especially in a down market) and the payback period usually extends out over many years. The incremental investment required for a builder to
commence vertical construction in anticipation of future sales is not only minor in relation to the capital a builder commits to the land and land
development of a project but it also enhances the liquidity of the asset and shortens the length of its payback period. As a result, the bulk of DR Horton’s
public competitors operate in a manner that is penny wise but pound foolish as the relative pennies saved by delaying vertical construction are small
compared to the gains in sales volumes and the better operating efficiencies that DR Horton achieves via the “controlled chaos” of its spec strategy.
Remember neither DR Horton nor its competitors engage in the business of building luxury homes that intuitively favors a “Build to Order” business
model. DR Horton and its competitors primarily target first-time homebuyers (and first-time move up buyers) who are more likely to prefer the ability
to move quickly into a home over the ability to customize it.

DR Horton endeavors to always bring homes to market at a price point that is below that of its competitors and to always have homes available at
various stages of construction so that a buyer is able to close on a new home sooner than the three to six months it takes to build that home from scratch.
The end result is that DR Horton builds and sells homes at a faster pace and at a lower cost than its competitors (it really is just that simple). DR Horton’s
unique strategy which is the homebuilding equivalent to Sam Walton’s mantra to “price it low, stack it high and watch it fly” is a major reason why DR
Horton rose from relative obscurity in the early to mid 1990s to become the largest homebuilder in the United States at the height of the housing boom.

                                                    % of Total Homes Sold by the Top 5 US Homebuilders

                                                                            1996              2000              2005
                                            DR Horton                       6.5%            19.1%             24.2%
                                            Pulte/Centex                   54.9%            40.4%             40.1%
                                            Lennar                         15.7%            18.6%             20.0%
                                            KB Home                        19.0%            20.0%             14.7%


The boom in housing caused all homebuilding companies to grow and DR Horton’s oversized growth rate was often viewed to be more the result of
greater risk taking (in part because it built on spec) than due to a superior business model. However the opposite is true. DR Horton’s superior business
model caused its competitors to aggressively pursue land and increase leverage to compensate for their competitive shortcomings. This has further
distanced DR Horton from its competitors and DR Horton has not only maintained its industry leading position during the downturn, it has expanded it.
In 2007, the four largest builders in the US were DR Horton, Pulte, Centex and Lennar all with similar sales levels. Despite the merger of Pulte and
Centex in 2009, DR Horton closed 49% more homes in the 1st quarter of 2010 than its next closest competitor and DR Horton’s 1st quarter sales were
only slightly less than Pulte, Centex and Lennar combined. DR Horton is dramatically outperforming its peers.


                                                                                2
% of Total Homes Sold by the Top 5 US Homebuilders


                                                                           Last 12       Q1 2010         Q1 2010
                                                               2006
                                                                           Months       (Closings)        (Sales)

                                         DR Horton            24.8%          31.0%          37.4%          42.2%
                                         Pulte/Centex         36.1%          36.6%          33.3%          28.3%
                                         Lennar               23.2%          18.7%          17.6%          16.9%
                                         KB Home              15.0%          13.8%          11.6%          12.5%


The most common argument for why builders utilize a Built to Order strategy as a means to convert renters into homeowners is the claim that it
produces better gross margins. However DR Horton’s operating margins have always been equal to or better than any of its competitors partly because
the higher sales volume leads to greater operating efficiencies (DR Horton’s sales per employee is also nearly 5 times greater than Wal-Mart). DR
Horton’s long standing strategy that uniquely emphasizes volume and speed over gross margin has also brought a new added benefit that is further
separating DR Horton from its competitors. DR Horton is one of only a few builders that is willing and able to fund “spec” construction (with a long
history of doing so) and as a result the company has emerged as the preferred partner for land sellers who wish to maximize the value of their residential
land assets by building homes as opposed to selling the entire property for pennies on the dollar in an illiquid land market. While all builders boast of an
ability to capitalize on the opportunities brought about by the collapse of the housing market, it is becoming readily apparent that no other builder is
more uniquely positioned to do so than DR Horton. And the proof ultimately lies in the numbers as no other builder has entered into more contracts to
open new communities since 2009 than DR Horton (it’s not even close). If fact despite DR Horton’s already comparatively larger size, it is the only
public homebuilder that is conclusively growing its “community count” (the homebuilder equivalent to stores for a retailer) and is likely to continue to
do so for many years into the future. In addition, the percentage of DR Horton’s current sales derived from newly (2009 or later) acquired communities
is significantly higher than that of its peers.


                                               % YOY Change in                         % of 1Q Sales from
                                              Communities (Stores)                 Newly Acquired Communities

                                         DR Horton                 29%             DR Horton                 35%
                                         Lennar                    -5%             Meritage                  19%
                                         KB Home                   -9%             MDC Holdings              10%
                                         Meritage                 -12%             Ryland                    10%
                                         Hovnanian                -17%             Lennar                     9%
                                         Pulte/Centex             -21%             Hovnanian                  8%
                                         MDC Holdings             -27%             KB Home                    5%
                                         Ryland                   -29%             Pulte/Centex               0%


DR Horton currently trades at a discount to its book value (which consists of cash and deeply discounted land) despite a potential for future growth that
is almost unmatched by any company in any industry. This should not come as a shock to anyone who has followed the company as it has been
mispriced by the market for the better part of the last twenty years. From 1992 through 2006 DR Horton grew revenue faster than Amazon.com with
operating margins 5-10 times greater than Amazon.com yet never once did DR Horton trade at a premium to the market (based on earnings). The
recent collapse of the housing market has been severe and certainly warrants a drop in the valuations of companies related to the housing market.
However, the persistent mispricing stems from the market’s past and present failure to value DR Horton as an operating company. Instead, DR Horton’s
valuation has always reflected the perceived market value of its land assets (Nike, for example is not valued based on the market value of its shoe
inventory). Due to this narrow view, metrics used by analysts and investors to assess the value of an operating company are rendered immaterial to DR
Horton’s valuation, like Operating Margin, Return on Capital, Revenue Growth and most importantly the Present Value of Future Earnings/Cash Flow.

No other company (that I know of) is greeted with such yawns after reporting a 50% increase in sales as is DR Horton. The results were almost of no
consequence to its valuation. The argument that DR Horton is significantly more valuable than the market value of its land is overwhelming supported
by fact. KB Home sold one third fewer homes in 2009 than it did in 1996 while DR Horton sold more than ten times as many homes in 2009 than it did
in 1996. The two firms compete directly against each other, yet DR Horton’s costs as a percentage of revenue are nearly half that of KB Home (13%
versus 23%). Despite of this, DR Horton and KB Home both trade at approximately the same premium/discount to their net assets. In other words, the
market assigns an identical intangible value to each operating company (zero) despite the fact that virtually every current or historical operating metric
favors DR Horton (Sales Growth, Operating Margins, Return on Capital etc . . .). DR Horton grew by 1000% over the last 13 years while KB Home grew
by -33%, the companies clearly should be valued differently.

I believe the main reason DR Horton is persistently mispriced is because the company is inaccurately classified as a “homebuilder” (analysts hate
homebuilders). In actuality, DR Horton’s employees don’t “build” anything. DR Horton’s employees don’t carry hammers, they don’t pour cement. DR
Horton employees carry pens and glossy brochures. DR Horton is a sales and marketing organization, the vast majority of its employees engage in the
business of selling homes, not building them. The bulk of DR Horton employees not engaged directly in sales work as accountants or bookkeepers. DR


                                                                             3
Horton is actually a “New Home Retailer”. DR Horton hires third party subcontractors to build its homes much like Nike hires third party
subcontractors to manufacture its shoes. DR Horton is no more of a “homebuilder” than Nike is a “shoe manufacturer” (which it is not). In truth, the
operations of DR Horton and Nike are more similar than they are different as both principally engage in the business of sales and marketing (analysts
love sales and marketing companies!). Nike does turn its inventory much faster than DR Horton, but Nike also must invest heavily in its distribution
system and is forced to carry a large amount of receivables from its retail partners (it does not receive cash immediately for its sales like DR Horton
does). The pluses and minuses largely even out and the operating margin and the return on capital of the two businesses are comparable. Nike’s
business does benefit from the strength of its brand more so than DR Horton ever will, however Nike also must invest heavily to maintain that brand.
Addias, Puma, Reebok and Converse all were at one point the premier brand of athletic shoes in the US States and yet each have declared bankruptcy or
experienced a major financial restructuring during the last twenty years, so I don’t think one can argue that Nike’s future earnings stream is any more
stable than that of DR Horton simply due to the current strength of its brand.

If you gave DR Horton’s financial results to an analyst and said it was a shoe company (or a retailer) the company would literally be perceived to be 10
times more valuable. Even if the market continues to incorrectly perceive DR Horton as a “homebuilder” the potential return on our investment is
enormous because DR Horton will likely increase its book value dramatically over the next 5-7 years. However if market ever realizes that DR Horton is
actually a “New Home Retailer” our potential return is many times greater.


                                                                           4

More Related Content

What's hot

Why is housing important? JOBS.
Why is housing important? JOBS.Why is housing important? JOBS.
Why is housing important? JOBS.Bob Eidson
 
Overview Of Housing/Credit Crisis And Why There Is More Pain To Come
Overview Of Housing/Credit Crisis And Why There Is More Pain To ComeOverview Of Housing/Credit Crisis And Why There Is More Pain To Come
Overview Of Housing/Credit Crisis And Why There Is More Pain To ComeAndrew Coleman
 
Bloomberg Brief Real Estate Special
Bloomberg Brief Real Estate SpecialBloomberg Brief Real Estate Special
Bloomberg Brief Real Estate SpecialBloomberg Briefs
 
TENANT OUTLOOK REPORT Winter 2012
TENANT OUTLOOK REPORT Winter 2012TENANT OUTLOOK REPORT Winter 2012
TENANT OUTLOOK REPORT Winter 2012Ron Miller
 
Leveraged Finance 2012 Outlook
Leveraged Finance 2012 OutlookLeveraged Finance 2012 Outlook
Leveraged Finance 2012 OutlookBloomberg Briefs
 
California and Southwest Distressed Real Estate: How Much Debt is in Distress...
California and Southwest Distressed Real Estate: How Much Debt is in Distress...California and Southwest Distressed Real Estate: How Much Debt is in Distress...
California and Southwest Distressed Real Estate: How Much Debt is in Distress...Ryan Slack
 
Nick Vandelogt Financial Analysis Detroit Red Wings Final Product
Nick Vandelogt Financial Analysis Detroit Red Wings Final ProductNick Vandelogt Financial Analysis Detroit Red Wings Final Product
Nick Vandelogt Financial Analysis Detroit Red Wings Final ProductNick Vandelogt
 
Chicago_AMERICAS_MarketBeat_Industrial_2page_Q42012
Chicago_AMERICAS_MarketBeat_Industrial_2page_Q42012Chicago_AMERICAS_MarketBeat_Industrial_2page_Q42012
Chicago_AMERICAS_MarketBeat_Industrial_2page_Q42012Carrie Haas
 
Us Structured Credit Roundtable To Securitize Alternative Energy Projects Suc...
Us Structured Credit Roundtable To Securitize Alternative Energy Projects Suc...Us Structured Credit Roundtable To Securitize Alternative Energy Projects Suc...
Us Structured Credit Roundtable To Securitize Alternative Energy Projects Suc...CFPuser
 
1 q10 earnings_press_release_final
1 q10 earnings_press_release_final1 q10 earnings_press_release_final
1 q10 earnings_press_release_finalmanoranjanpattanayak
 
investment palm beach county-3
investment palm beach county-3investment palm beach county-3
investment palm beach county-3joe dono
 
This Month in Real Estate June 2009 Canada Market Powerpoint
This Month in Real Estate June 2009 Canada Market PowerpointThis Month in Real Estate June 2009 Canada Market Powerpoint
This Month in Real Estate June 2009 Canada Market PowerpointKeller Williams Careers
 
National Association of Realtors 2013 Member Profile
National Association of Realtors 2013 Member ProfileNational Association of Realtors 2013 Member Profile
National Association of Realtors 2013 Member ProfileRicardo Cobos
 
1 q09 earnings_press_release_final
1 q09 earnings_press_release_final1 q09 earnings_press_release_final
1 q09 earnings_press_release_finalmanoranjanpattanayak
 

What's hot (18)

Why is housing important? JOBS.
Why is housing important? JOBS.Why is housing important? JOBS.
Why is housing important? JOBS.
 
November 2011 Market Watch
November 2011 Market WatchNovember 2011 Market Watch
November 2011 Market Watch
 
Q2 2009 Earning Report of Marshall & Ilsley
Q2 2009 Earning Report of Marshall & IlsleyQ2 2009 Earning Report of Marshall & Ilsley
Q2 2009 Earning Report of Marshall & Ilsley
 
Overview Of Housing/Credit Crisis And Why There Is More Pain To Come
Overview Of Housing/Credit Crisis And Why There Is More Pain To ComeOverview Of Housing/Credit Crisis And Why There Is More Pain To Come
Overview Of Housing/Credit Crisis And Why There Is More Pain To Come
 
Bloomberg Brief Real Estate Special
Bloomberg Brief Real Estate SpecialBloomberg Brief Real Estate Special
Bloomberg Brief Real Estate Special
 
TENANT OUTLOOK REPORT Winter 2012
TENANT OUTLOOK REPORT Winter 2012TENANT OUTLOOK REPORT Winter 2012
TENANT OUTLOOK REPORT Winter 2012
 
Leveraged Finance 2012 Outlook
Leveraged Finance 2012 OutlookLeveraged Finance 2012 Outlook
Leveraged Finance 2012 Outlook
 
Q1 2009 Earning Report of Zions Bancorporation
Q1 2009 Earning Report of Zions BancorporationQ1 2009 Earning Report of Zions Bancorporation
Q1 2009 Earning Report of Zions Bancorporation
 
California and Southwest Distressed Real Estate: How Much Debt is in Distress...
California and Southwest Distressed Real Estate: How Much Debt is in Distress...California and Southwest Distressed Real Estate: How Much Debt is in Distress...
California and Southwest Distressed Real Estate: How Much Debt is in Distress...
 
Nick Vandelogt Financial Analysis Detroit Red Wings Final Product
Nick Vandelogt Financial Analysis Detroit Red Wings Final ProductNick Vandelogt Financial Analysis Detroit Red Wings Final Product
Nick Vandelogt Financial Analysis Detroit Red Wings Final Product
 
Chicago_AMERICAS_MarketBeat_Industrial_2page_Q42012
Chicago_AMERICAS_MarketBeat_Industrial_2page_Q42012Chicago_AMERICAS_MarketBeat_Industrial_2page_Q42012
Chicago_AMERICAS_MarketBeat_Industrial_2page_Q42012
 
Us Structured Credit Roundtable To Securitize Alternative Energy Projects Suc...
Us Structured Credit Roundtable To Securitize Alternative Energy Projects Suc...Us Structured Credit Roundtable To Securitize Alternative Energy Projects Suc...
Us Structured Credit Roundtable To Securitize Alternative Energy Projects Suc...
 
3rd quarter report
3rd quarter report3rd quarter report
3rd quarter report
 
1 q10 earnings_press_release_final
1 q10 earnings_press_release_final1 q10 earnings_press_release_final
1 q10 earnings_press_release_final
 
investment palm beach county-3
investment palm beach county-3investment palm beach county-3
investment palm beach county-3
 
This Month in Real Estate June 2009 Canada Market Powerpoint
This Month in Real Estate June 2009 Canada Market PowerpointThis Month in Real Estate June 2009 Canada Market Powerpoint
This Month in Real Estate June 2009 Canada Market Powerpoint
 
National Association of Realtors 2013 Member Profile
National Association of Realtors 2013 Member ProfileNational Association of Realtors 2013 Member Profile
National Association of Realtors 2013 Member Profile
 
1 q09 earnings_press_release_final
1 q09 earnings_press_release_final1 q09 earnings_press_release_final
1 q09 earnings_press_release_final
 

Viewers also liked

Making Demand Generation work in the Construction industry
Making Demand Generation work in the Construction industryMaking Demand Generation work in the Construction industry
Making Demand Generation work in the Construction industryLedger Bennett DGA
 
Homebuilder front
Homebuilder frontHomebuilder front
Homebuilder frontPivotal CRM
 
Toll Brothers Corporate Profile
Toll Brothers Corporate ProfileToll Brothers Corporate Profile
Toll Brothers Corporate ProfileBob Stocklin
 
Real Estate Leads and Lead Generation (Can You Handle the Real Truth?)
Real Estate Leads and Lead Generation (Can You Handle the Real Truth?)Real Estate Leads and Lead Generation (Can You Handle the Real Truth?)
Real Estate Leads and Lead Generation (Can You Handle the Real Truth?)Proquest Technologies
 
Lennar corporation case study. plus video (2)
Lennar corporation case study. plus video (2)Lennar corporation case study. plus video (2)
Lennar corporation case study. plus video (2)Hasiyah Dorosae
 
Nest Protect Marketing Plan
Nest Protect Marketing PlanNest Protect Marketing Plan
Nest Protect Marketing PlanAdam Koch
 
Customer journey mapping seminar
Customer journey mapping seminarCustomer journey mapping seminar
Customer journey mapping seminarMacInnis Marketing
 
5 real-estate-digital-marketing-strategy-2017
5 real-estate-digital-marketing-strategy-20175 real-estate-digital-marketing-strategy-2017
5 real-estate-digital-marketing-strategy-2017Satish Vishwakarma
 
Changing landscape of Real Estate Industry with Digital Marketing and Technology
Changing landscape of Real Estate Industry with Digital Marketing and TechnologyChanging landscape of Real Estate Industry with Digital Marketing and Technology
Changing landscape of Real Estate Industry with Digital Marketing and TechnologyAmura Marketing Technologies Pvt. Ltd.
 
Digital Marketing Plan for Real Estate Business
Digital Marketing Plan for Real Estate BusinessDigital Marketing Plan for Real Estate Business
Digital Marketing Plan for Real Estate BusinessGaurav Tripathi
 
Construction Leads Guide: Lead Generation Best Practices
Construction Leads Guide:  Lead Generation Best PracticesConstruction Leads Guide:  Lead Generation Best Practices
Construction Leads Guide: Lead Generation Best PracticesModern Marketing Partners
 

Viewers also liked (15)

Making Demand Generation work in the Construction industry
Making Demand Generation work in the Construction industryMaking Demand Generation work in the Construction industry
Making Demand Generation work in the Construction industry
 
THB Summit 15
THB Summit 15THB Summit 15
THB Summit 15
 
Homebuilder front
Homebuilder frontHomebuilder front
Homebuilder front
 
Toll Brothers Corporate Profile
Toll Brothers Corporate ProfileToll Brothers Corporate Profile
Toll Brothers Corporate Profile
 
Real Estate Leads and Lead Generation (Can You Handle the Real Truth?)
Real Estate Leads and Lead Generation (Can You Handle the Real Truth?)Real Estate Leads and Lead Generation (Can You Handle the Real Truth?)
Real Estate Leads and Lead Generation (Can You Handle the Real Truth?)
 
Marketing Plan for XYZ Home
Marketing Plan for XYZ HomeMarketing Plan for XYZ Home
Marketing Plan for XYZ Home
 
C-RE-01
C-RE-01C-RE-01
C-RE-01
 
Lennar corporation case study. plus video (2)
Lennar corporation case study. plus video (2)Lennar corporation case study. plus video (2)
Lennar corporation case study. plus video (2)
 
Nest Protect Marketing Plan
Nest Protect Marketing PlanNest Protect Marketing Plan
Nest Protect Marketing Plan
 
Customer journey mapping seminar
Customer journey mapping seminarCustomer journey mapping seminar
Customer journey mapping seminar
 
5 real-estate-digital-marketing-strategy-2017
5 real-estate-digital-marketing-strategy-20175 real-estate-digital-marketing-strategy-2017
5 real-estate-digital-marketing-strategy-2017
 
Changing landscape of Real Estate Industry with Digital Marketing and Technology
Changing landscape of Real Estate Industry with Digital Marketing and TechnologyChanging landscape of Real Estate Industry with Digital Marketing and Technology
Changing landscape of Real Estate Industry with Digital Marketing and Technology
 
Digital Marketing Plan for Real Estate Business
Digital Marketing Plan for Real Estate BusinessDigital Marketing Plan for Real Estate Business
Digital Marketing Plan for Real Estate Business
 
Construction Leads Guide: Lead Generation Best Practices
Construction Leads Guide:  Lead Generation Best PracticesConstruction Leads Guide:  Lead Generation Best Practices
Construction Leads Guide: Lead Generation Best Practices
 
Real Estate Marketing Goes Digital
Real Estate Marketing Goes DigitalReal Estate Marketing Goes Digital
Real Estate Marketing Goes Digital
 

Similar to DR Horton By Jason Norbeck

BoyarMiller Breakfast Forum: The Current State of the Capital Markets 2009
BoyarMiller Breakfast Forum: The Current State of the Capital Markets 2009BoyarMiller Breakfast Forum: The Current State of the Capital Markets 2009
BoyarMiller Breakfast Forum: The Current State of the Capital Markets 2009BoyarMiller
 
Focus : Retail strategy
Focus : Retail strategyFocus : Retail strategy
Focus : Retail strategyericfleury
 
Real Estate Update
Real Estate UpdateReal Estate Update
Real Estate UpdateBOBG56
 
Pcg Northeast Ohio Newsletter - February/March 2010
Pcg Northeast Ohio Newsletter - February/March 2010Pcg Northeast Ohio Newsletter - February/March 2010
Pcg Northeast Ohio Newsletter - February/March 2010sjlatkovic
 
The-Discovery-Report-2015
The-Discovery-Report-2015The-Discovery-Report-2015
The-Discovery-Report-2015Ellis Sher
 
The Case for High Yield Muni Bonds
The Case for High Yield Muni BondsThe Case for High Yield Muni Bonds
The Case for High Yield Muni BondsAnthony Tanner, CFA
 
How Resilient are MBS to CDO Market Disruptions
How Resilient are MBS to CDO Market DisruptionsHow Resilient are MBS to CDO Market Disruptions
How Resilient are MBS to CDO Market Disruptionsfinancedude
 
Ft partners research the rise of challenger banks
Ft partners research   the rise of challenger banksFt partners research   the rise of challenger banks
Ft partners research the rise of challenger banksChris Skinner
 
Astute Investor - Summer 2016
Astute Investor - Summer 2016Astute Investor - Summer 2016
Astute Investor - Summer 2016Avantis Wealth
 
Michael Durante Western Reserve Blackwall Partners 2011 outlook primer- final
Michael Durante Western Reserve Blackwall Partners   2011 outlook primer- finalMichael Durante Western Reserve Blackwall Partners   2011 outlook primer- final
Michael Durante Western Reserve Blackwall Partners 2011 outlook primer- finalMichael Durante
 
The World Is Temporarily Closed.
The World Is Temporarily Closed.The World Is Temporarily Closed.
The World Is Temporarily Closed.NathanBurrell3
 
Bank of America Corporation acquires Merrill Lynch & Co., Inc. Presentation
Bank of America Corporation acquires Merrill Lynch & Co., Inc. PresentationBank of America Corporation acquires Merrill Lynch & Co., Inc. Presentation
Bank of America Corporation acquires Merrill Lynch & Co., Inc. PresentationQuarterlyEarningsReports3
 
HFM - Ready, Willing and ABL
HFM - Ready, Willing and ABLHFM - Ready, Willing and ABL
HFM - Ready, Willing and ABLLisa Krow
 
How To Navigate
How To NavigateHow To Navigate
How To NavigateMCDFS
 
August 2009 The Credit Crunch Is Dead, Long Live The Credit Crunch
August 2009   The Credit Crunch Is Dead, Long Live The Credit CrunchAugust 2009   The Credit Crunch Is Dead, Long Live The Credit Crunch
August 2009 The Credit Crunch Is Dead, Long Live The Credit Crunchgatelyw396
 

Similar to DR Horton By Jason Norbeck (20)

BoyarMiller Breakfast Forum: The Current State of the Capital Markets 2009
BoyarMiller Breakfast Forum: The Current State of the Capital Markets 2009BoyarMiller Breakfast Forum: The Current State of the Capital Markets 2009
BoyarMiller Breakfast Forum: The Current State of the Capital Markets 2009
 
Focus : Retail strategy
Focus : Retail strategyFocus : Retail strategy
Focus : Retail strategy
 
Real Estate Update
Real Estate UpdateReal Estate Update
Real Estate Update
 
Pcg Northeast Ohio Newsletter - February/March 2010
Pcg Northeast Ohio Newsletter - February/March 2010Pcg Northeast Ohio Newsletter - February/March 2010
Pcg Northeast Ohio Newsletter - February/March 2010
 
The-Discovery-Report-2015
The-Discovery-Report-2015The-Discovery-Report-2015
The-Discovery-Report-2015
 
The Case for High Yield Muni Bonds
The Case for High Yield Muni BondsThe Case for High Yield Muni Bonds
The Case for High Yield Muni Bonds
 
13. deal due diligence and valuation of marshall ilsley bank
13. deal due diligence and valuation of marshall ilsley bank13. deal due diligence and valuation of marshall ilsley bank
13. deal due diligence and valuation of marshall ilsley bank
 
How Resilient are MBS to CDO Market Disruptions
How Resilient are MBS to CDO Market DisruptionsHow Resilient are MBS to CDO Market Disruptions
How Resilient are MBS to CDO Market Disruptions
 
The Credit Crunch
The Credit CrunchThe Credit Crunch
The Credit Crunch
 
Commercial Realtors; Get more Deals Through
Commercial Realtors; Get more Deals ThroughCommercial Realtors; Get more Deals Through
Commercial Realtors; Get more Deals Through
 
Ft partners research the rise of challenger banks
Ft partners research   the rise of challenger banksFt partners research   the rise of challenger banks
Ft partners research the rise of challenger banks
 
Astute Investor - Summer 2016
Astute Investor - Summer 2016Astute Investor - Summer 2016
Astute Investor - Summer 2016
 
Michael Durante Western Reserve Blackwall Partners 2011 outlook primer- final
Michael Durante Western Reserve Blackwall Partners   2011 outlook primer- finalMichael Durante Western Reserve Blackwall Partners   2011 outlook primer- final
Michael Durante Western Reserve Blackwall Partners 2011 outlook primer- final
 
The World Is Temporarily Closed.
The World Is Temporarily Closed.The World Is Temporarily Closed.
The World Is Temporarily Closed.
 
Bank of America Corporation acquires Merrill Lynch & Co., Inc. Presentation
Bank of America Corporation acquires Merrill Lynch & Co., Inc. PresentationBank of America Corporation acquires Merrill Lynch & Co., Inc. Presentation
Bank of America Corporation acquires Merrill Lynch & Co., Inc. Presentation
 
HFM - Ready, Willing and ABL
HFM - Ready, Willing and ABLHFM - Ready, Willing and ABL
HFM - Ready, Willing and ABL
 
Outlook 2013
Outlook 2013Outlook 2013
Outlook 2013
 
How To Navigate
How To NavigateHow To Navigate
How To Navigate
 
Mg 2009 Outlook 011509
Mg 2009 Outlook 011509Mg 2009 Outlook 011509
Mg 2009 Outlook 011509
 
August 2009 The Credit Crunch Is Dead, Long Live The Credit Crunch
August 2009   The Credit Crunch Is Dead, Long Live The Credit CrunchAugust 2009   The Credit Crunch Is Dead, Long Live The Credit Crunch
August 2009 The Credit Crunch Is Dead, Long Live The Credit Crunch
 

DR Horton By Jason Norbeck

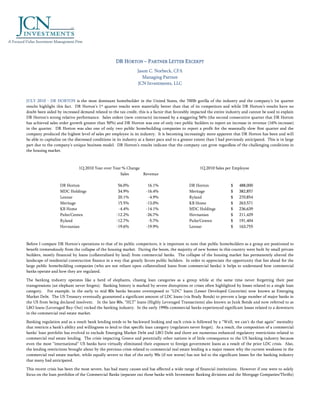
  • 1. DR HORTON – PARTNER LETTER EXCERPT Jason C. Norbeck, CFA Managing Partner JCN Investments, LLC JULY 2010 - DR HORTON is the most dominant homebuilder in the United States, the 700lb gorilla of the industry and the company’s 1st quarter results highlight this fact. DR Horton’s 1st quarter results were materially better than that of its competitors and while DR Horton’s results have no doubt been aided by increased demand related to the tax credit, this is a factor that favorably impacted the entire industry and cannot be used to explain DR Horton’s strong relative performance. Sales orders (new contracts) increased by a staggering 56% (the second consecutive quarter that DR Horton has achieved sales order growth greater than 50%) and DR Horton was one of only two public builders to report an increase in revenue (16% increase) in the quarter. DR Horton was also one of only two public homebuilding companies to report a profit for the seasonally slow first quarter and the company produced the highest level of sales per employee in its industry. It is becoming increasingly more apparent that DR Horton has been and will be able to capitalize on the distressed conditions in its industry at a faster pace and to a greater extent than I had previously anticipated. This is in large part due to the company’s unique business model. DR Horton’s results indicate that the company can grow regardless of the challenging conditions in the housing market. 1Q 2010 Year over Year % Change 1Q 2010 Sales per Employee Sales Revenue DR Horton 56.0% 16.1% DR Horton $ 488,000 MDC Holdings 34.9% -16.4% Meritage $ 382,857 Lennar 20.1% -4.9% Ryland $ 270,854 Meritage 15.5% -13.0% KB Home $ 263,571 KB Home -4.4% -14.1% MDC Holdings $ 236,639 Pulte/Centex -12.2% -26.7% Hovnanian $ 211,429 Ryland -12.7% -5.7% Pulte/Centex $ 191,404 Hovnanian -19.6% -19.9% Lennar $ 163,755 Before I compare DR Horton’s operations to that of its public competitors, it is important to note that public homebuilders as a group are positioned to benefit tremendously from the collapse of the housing market. During the boom, the majority of new homes in this country were built by small private builders, mostly financed by loans (collateralized by land) from commercial banks. The collapse of the housing market has permanently altered the landscape of residential construction finance in a way that greatly favors public builders. In order to appreciate the opportunity that lies ahead for the large public homebuilding companies (who are not reliant upon collateralized loans from commercial banks) it helps to understand how commercial banks operate and how they are regulated. The banking industry operates like a herd of elephants, chasing loan categories as a group while at the same time never forgetting their past transgressions (an elephant never forgets). Banking history is marked by severe disruptions or crises often highlighted by losses related to a single loan category. For example, in the early to mid 80s banks became overexposed to “LDC” loans (Lesser Developed Countries) now known as Emerging Market Debt. The US Treasury eventually guaranteed a significant amount of LDC loans (via Brady Bonds) to prevent a large number of major banks in the US from being declared insolvent. In the late 80s, “HLT” loans (Highly Leveraged Transactions) also known as Junk Bonds and now referred to as LBO loans (Leveraged Buy-Out) rocked the banking industry. In the early 1990s commercial banks experienced significant losses related to a downturn in the commercial real estate market. Banking regulation and as a result bank lending tends to be backward looking and each crisis is followed by a “Well, we can’t do that again” mentality that restricts a bank’s ability and willingness to lend to that specific loan category (regulators never forget). As a result, the composition of a commercial banks’ loan portfolio has evolved to exclude Emerging Market Debt and LBO Debt and there are numerous enhanced regulatory restrictions related to commercial real estate lending. The crisis impacting Greece and potentially other nations is of little consequence to the US banking industry because even the most “international” US banks have virtually eliminated their exposure to foreign government loans as a result of the prior LDC crisis. Also, the lending restrictions brought about by the previous crisis related to commercial real estate lending is a major reason why the current weakness in the commercial real estate market, while equally severe to that of the early 90s (if not worse) has not led to the significant losses for the banking industry that many had anticipated. This recent crisis has been the most severe, has had many causes and has affected a wide range of financial institutions. However if one were to solely focus on the loan portfolios of the Commercial Banks (separate out those banks with Investment Banking divisions and the Mortgage Companies/Thrifts)
  • 2. the crisis is clearly centered in residential construction lending. Beyond the obvious distress in the housing market, the nature of a distressed residential construction loan is such that the degree to which a bank is required to charge off the loan has been well beyond what anyone imagined possible before the downturn (if you question this statement I suggest you give Zions’ Chief Credit Officer a call). When a loan is showing signs of distress and is backed by collateral, the bank is generally required to obtain a third party appraisal of that collateral and charge the loan down to its appraised value (or even slightly below). The lack of documentable cash flow has caused a decline in the appraised value of residential construction projects that is destructively severe. So much so that it is impossible to imagine a future banking regulatory environment that does not involve greater restrictions on residential construction lending for commercial banks. The severity of loss in this category has been so high and the size of the average residential construction loan is of sufficient size (usually many millions of dollars) that even for loans that are economically attractive and even without regulatory restrictions a bank simply cannot afford to risk the size of the potential charge to capital if the performance of that project does not live up to expectations. As a result, residential construction finance has been altered for a majority of the industry’s participants because banks will be materially less willing to accept the assets of a residential construction project as collateral for a loan. Just yesterday, a Citigroup analyst released a survey of private homebuilding companies that included the following quote: "the vast majority of survey participants reported that acquiring AC&D (Acquisition Construction and Development) financing from banks remains difficult if not impossible to source." Lending conditions for private builders are not likely to improve any time soon. Even the most pessimistic housing bears acknowledge that population and demographic trends dictate that our country will need to build homes at a rate that is ultimately 2 to 3 times greater than the current pace. However, the eventual material increase in demand for new homes will not be accompanied by a similar material increase in the availability of financing for new home construction (at least from the banking industry). As a result the large public builders that finance residential construction via substantial equity and debt that is based on their credit rating as an operating company (not collateralized by land) are in a position to reap a lion’s share of the rewards related to a housing recovery. Not only is DR Horton one of a small group of public builders that have widened their competitive advantage in relation to smaller private builders, DR Horton has also widened its advantage over its public competitors. DR Horton’s point of differentiation comes from the fact that it starts the vertical construction of a home before it has a buyer. The industry refers to this strategy as “spec” (speculative) building. Most homebuilders either do not engage in the building of “spec” homes or do so in a much more limited degree. The majority of homebuilding companies operate a “Built to Order” strategy in which vertical construction is delayed until the home has been sold. As one might infer by its name, DR Horton’s “spec” strategy is often categorized as the riskier of the two strategies (even chaotic) by analysts and the industry. This is incorrect, as the assets of a homebuilder tied to vertical construction are its most attractive because a completed home is liquid and can be converted to cash within just a few months (even in a weak real estate market) and because the payback period for the investment is short and the return on capital is high. In contrast, assets related to Land Development (which is a homebuilder’s alternative capital requirement) are illiquid (especially in a down market) and the payback period usually extends out over many years. The incremental investment required for a builder to commence vertical construction in anticipation of future sales is not only minor in relation to the capital a builder commits to the land and land development of a project but it also enhances the liquidity of the asset and shortens the length of its payback period. As a result, the bulk of DR Horton’s public competitors operate in a manner that is penny wise but pound foolish as the relative pennies saved by delaying vertical construction are small compared to the gains in sales volumes and the better operating efficiencies that DR Horton achieves via the “controlled chaos” of its spec strategy. Remember neither DR Horton nor its competitors engage in the business of building luxury homes that intuitively favors a “Build to Order” business model. DR Horton and its competitors primarily target first-time homebuyers (and first-time move up buyers) who are more likely to prefer the ability to move quickly into a home over the ability to customize it. DR Horton endeavors to always bring homes to market at a price point that is below that of its competitors and to always have homes available at various stages of construction so that a buyer is able to close on a new home sooner than the three to six months it takes to build that home from scratch. The end result is that DR Horton builds and sells homes at a faster pace and at a lower cost than its competitors (it really is just that simple). DR Horton’s unique strategy which is the homebuilding equivalent to Sam Walton’s mantra to “price it low, stack it high and watch it fly” is a major reason why DR Horton rose from relative obscurity in the early to mid 1990s to become the largest homebuilder in the United States at the height of the housing boom. % of Total Homes Sold by the Top 5 US Homebuilders 1996 2000 2005 DR Horton 6.5% 19.1% 24.2% Pulte/Centex 54.9% 40.4% 40.1% Lennar 15.7% 18.6% 20.0% KB Home 19.0% 20.0% 14.7% The boom in housing caused all homebuilding companies to grow and DR Horton’s oversized growth rate was often viewed to be more the result of greater risk taking (in part because it built on spec) than due to a superior business model. However the opposite is true. DR Horton’s superior business model caused its competitors to aggressively pursue land and increase leverage to compensate for their competitive shortcomings. This has further distanced DR Horton from its competitors and DR Horton has not only maintained its industry leading position during the downturn, it has expanded it. In 2007, the four largest builders in the US were DR Horton, Pulte, Centex and Lennar all with similar sales levels. Despite the merger of Pulte and Centex in 2009, DR Horton closed 49% more homes in the 1st quarter of 2010 than its next closest competitor and DR Horton’s 1st quarter sales were only slightly less than Pulte, Centex and Lennar combined. DR Horton is dramatically outperforming its peers. 2
  • 3. % of Total Homes Sold by the Top 5 US Homebuilders Last 12 Q1 2010 Q1 2010 2006 Months (Closings) (Sales) DR Horton 24.8% 31.0% 37.4% 42.2% Pulte/Centex 36.1% 36.6% 33.3% 28.3% Lennar 23.2% 18.7% 17.6% 16.9% KB Home 15.0% 13.8% 11.6% 12.5% The most common argument for why builders utilize a Built to Order strategy as a means to convert renters into homeowners is the claim that it produces better gross margins. However DR Horton’s operating margins have always been equal to or better than any of its competitors partly because the higher sales volume leads to greater operating efficiencies (DR Horton’s sales per employee is also nearly 5 times greater than Wal-Mart). DR Horton’s long standing strategy that uniquely emphasizes volume and speed over gross margin has also brought a new added benefit that is further separating DR Horton from its competitors. DR Horton is one of only a few builders that is willing and able to fund “spec” construction (with a long history of doing so) and as a result the company has emerged as the preferred partner for land sellers who wish to maximize the value of their residential land assets by building homes as opposed to selling the entire property for pennies on the dollar in an illiquid land market. While all builders boast of an ability to capitalize on the opportunities brought about by the collapse of the housing market, it is becoming readily apparent that no other builder is more uniquely positioned to do so than DR Horton. And the proof ultimately lies in the numbers as no other builder has entered into more contracts to open new communities since 2009 than DR Horton (it’s not even close). If fact despite DR Horton’s already comparatively larger size, it is the only public homebuilder that is conclusively growing its “community count” (the homebuilder equivalent to stores for a retailer) and is likely to continue to do so for many years into the future. In addition, the percentage of DR Horton’s current sales derived from newly (2009 or later) acquired communities is significantly higher than that of its peers. % YOY Change in % of 1Q Sales from Communities (Stores) Newly Acquired Communities DR Horton 29% DR Horton 35% Lennar -5% Meritage 19% KB Home -9% MDC Holdings 10% Meritage -12% Ryland 10% Hovnanian -17% Lennar 9% Pulte/Centex -21% Hovnanian 8% MDC Holdings -27% KB Home 5% Ryland -29% Pulte/Centex 0% DR Horton currently trades at a discount to its book value (which consists of cash and deeply discounted land) despite a potential for future growth that is almost unmatched by any company in any industry. This should not come as a shock to anyone who has followed the company as it has been mispriced by the market for the better part of the last twenty years. From 1992 through 2006 DR Horton grew revenue faster than Amazon.com with operating margins 5-10 times greater than Amazon.com yet never once did DR Horton trade at a premium to the market (based on earnings). The recent collapse of the housing market has been severe and certainly warrants a drop in the valuations of companies related to the housing market. However, the persistent mispricing stems from the market’s past and present failure to value DR Horton as an operating company. Instead, DR Horton’s valuation has always reflected the perceived market value of its land assets (Nike, for example is not valued based on the market value of its shoe inventory). Due to this narrow view, metrics used by analysts and investors to assess the value of an operating company are rendered immaterial to DR Horton’s valuation, like Operating Margin, Return on Capital, Revenue Growth and most importantly the Present Value of Future Earnings/Cash Flow. No other company (that I know of) is greeted with such yawns after reporting a 50% increase in sales as is DR Horton. The results were almost of no consequence to its valuation. The argument that DR Horton is significantly more valuable than the market value of its land is overwhelming supported by fact. KB Home sold one third fewer homes in 2009 than it did in 1996 while DR Horton sold more than ten times as many homes in 2009 than it did in 1996. The two firms compete directly against each other, yet DR Horton’s costs as a percentage of revenue are nearly half that of KB Home (13% versus 23%). Despite of this, DR Horton and KB Home both trade at approximately the same premium/discount to their net assets. In other words, the market assigns an identical intangible value to each operating company (zero) despite the fact that virtually every current or historical operating metric favors DR Horton (Sales Growth, Operating Margins, Return on Capital etc . . .). DR Horton grew by 1000% over the last 13 years while KB Home grew by -33%, the companies clearly should be valued differently. I believe the main reason DR Horton is persistently mispriced is because the company is inaccurately classified as a “homebuilder” (analysts hate homebuilders). In actuality, DR Horton’s employees don’t “build” anything. DR Horton’s employees don’t carry hammers, they don’t pour cement. DR Horton employees carry pens and glossy brochures. DR Horton is a sales and marketing organization, the vast majority of its employees engage in the business of selling homes, not building them. The bulk of DR Horton employees not engaged directly in sales work as accountants or bookkeepers. DR 3
  • 4. Horton is actually a “New Home Retailer”. DR Horton hires third party subcontractors to build its homes much like Nike hires third party subcontractors to manufacture its shoes. DR Horton is no more of a “homebuilder” than Nike is a “shoe manufacturer” (which it is not). In truth, the operations of DR Horton and Nike are more similar than they are different as both principally engage in the business of sales and marketing (analysts love sales and marketing companies!). Nike does turn its inventory much faster than DR Horton, but Nike also must invest heavily in its distribution system and is forced to carry a large amount of receivables from its retail partners (it does not receive cash immediately for its sales like DR Horton does). The pluses and minuses largely even out and the operating margin and the return on capital of the two businesses are comparable. Nike’s business does benefit from the strength of its brand more so than DR Horton ever will, however Nike also must invest heavily to maintain that brand. Addias, Puma, Reebok and Converse all were at one point the premier brand of athletic shoes in the US States and yet each have declared bankruptcy or experienced a major financial restructuring during the last twenty years, so I don’t think one can argue that Nike’s future earnings stream is any more stable than that of DR Horton simply due to the current strength of its brand. If you gave DR Horton’s financial results to an analyst and said it was a shoe company (or a retailer) the company would literally be perceived to be 10 times more valuable. Even if the market continues to incorrectly perceive DR Horton as a “homebuilder” the potential return on our investment is enormous because DR Horton will likely increase its book value dramatically over the next 5-7 years. However if market ever realizes that DR Horton is actually a “New Home Retailer” our potential return is many times greater. 4