Download to read offline
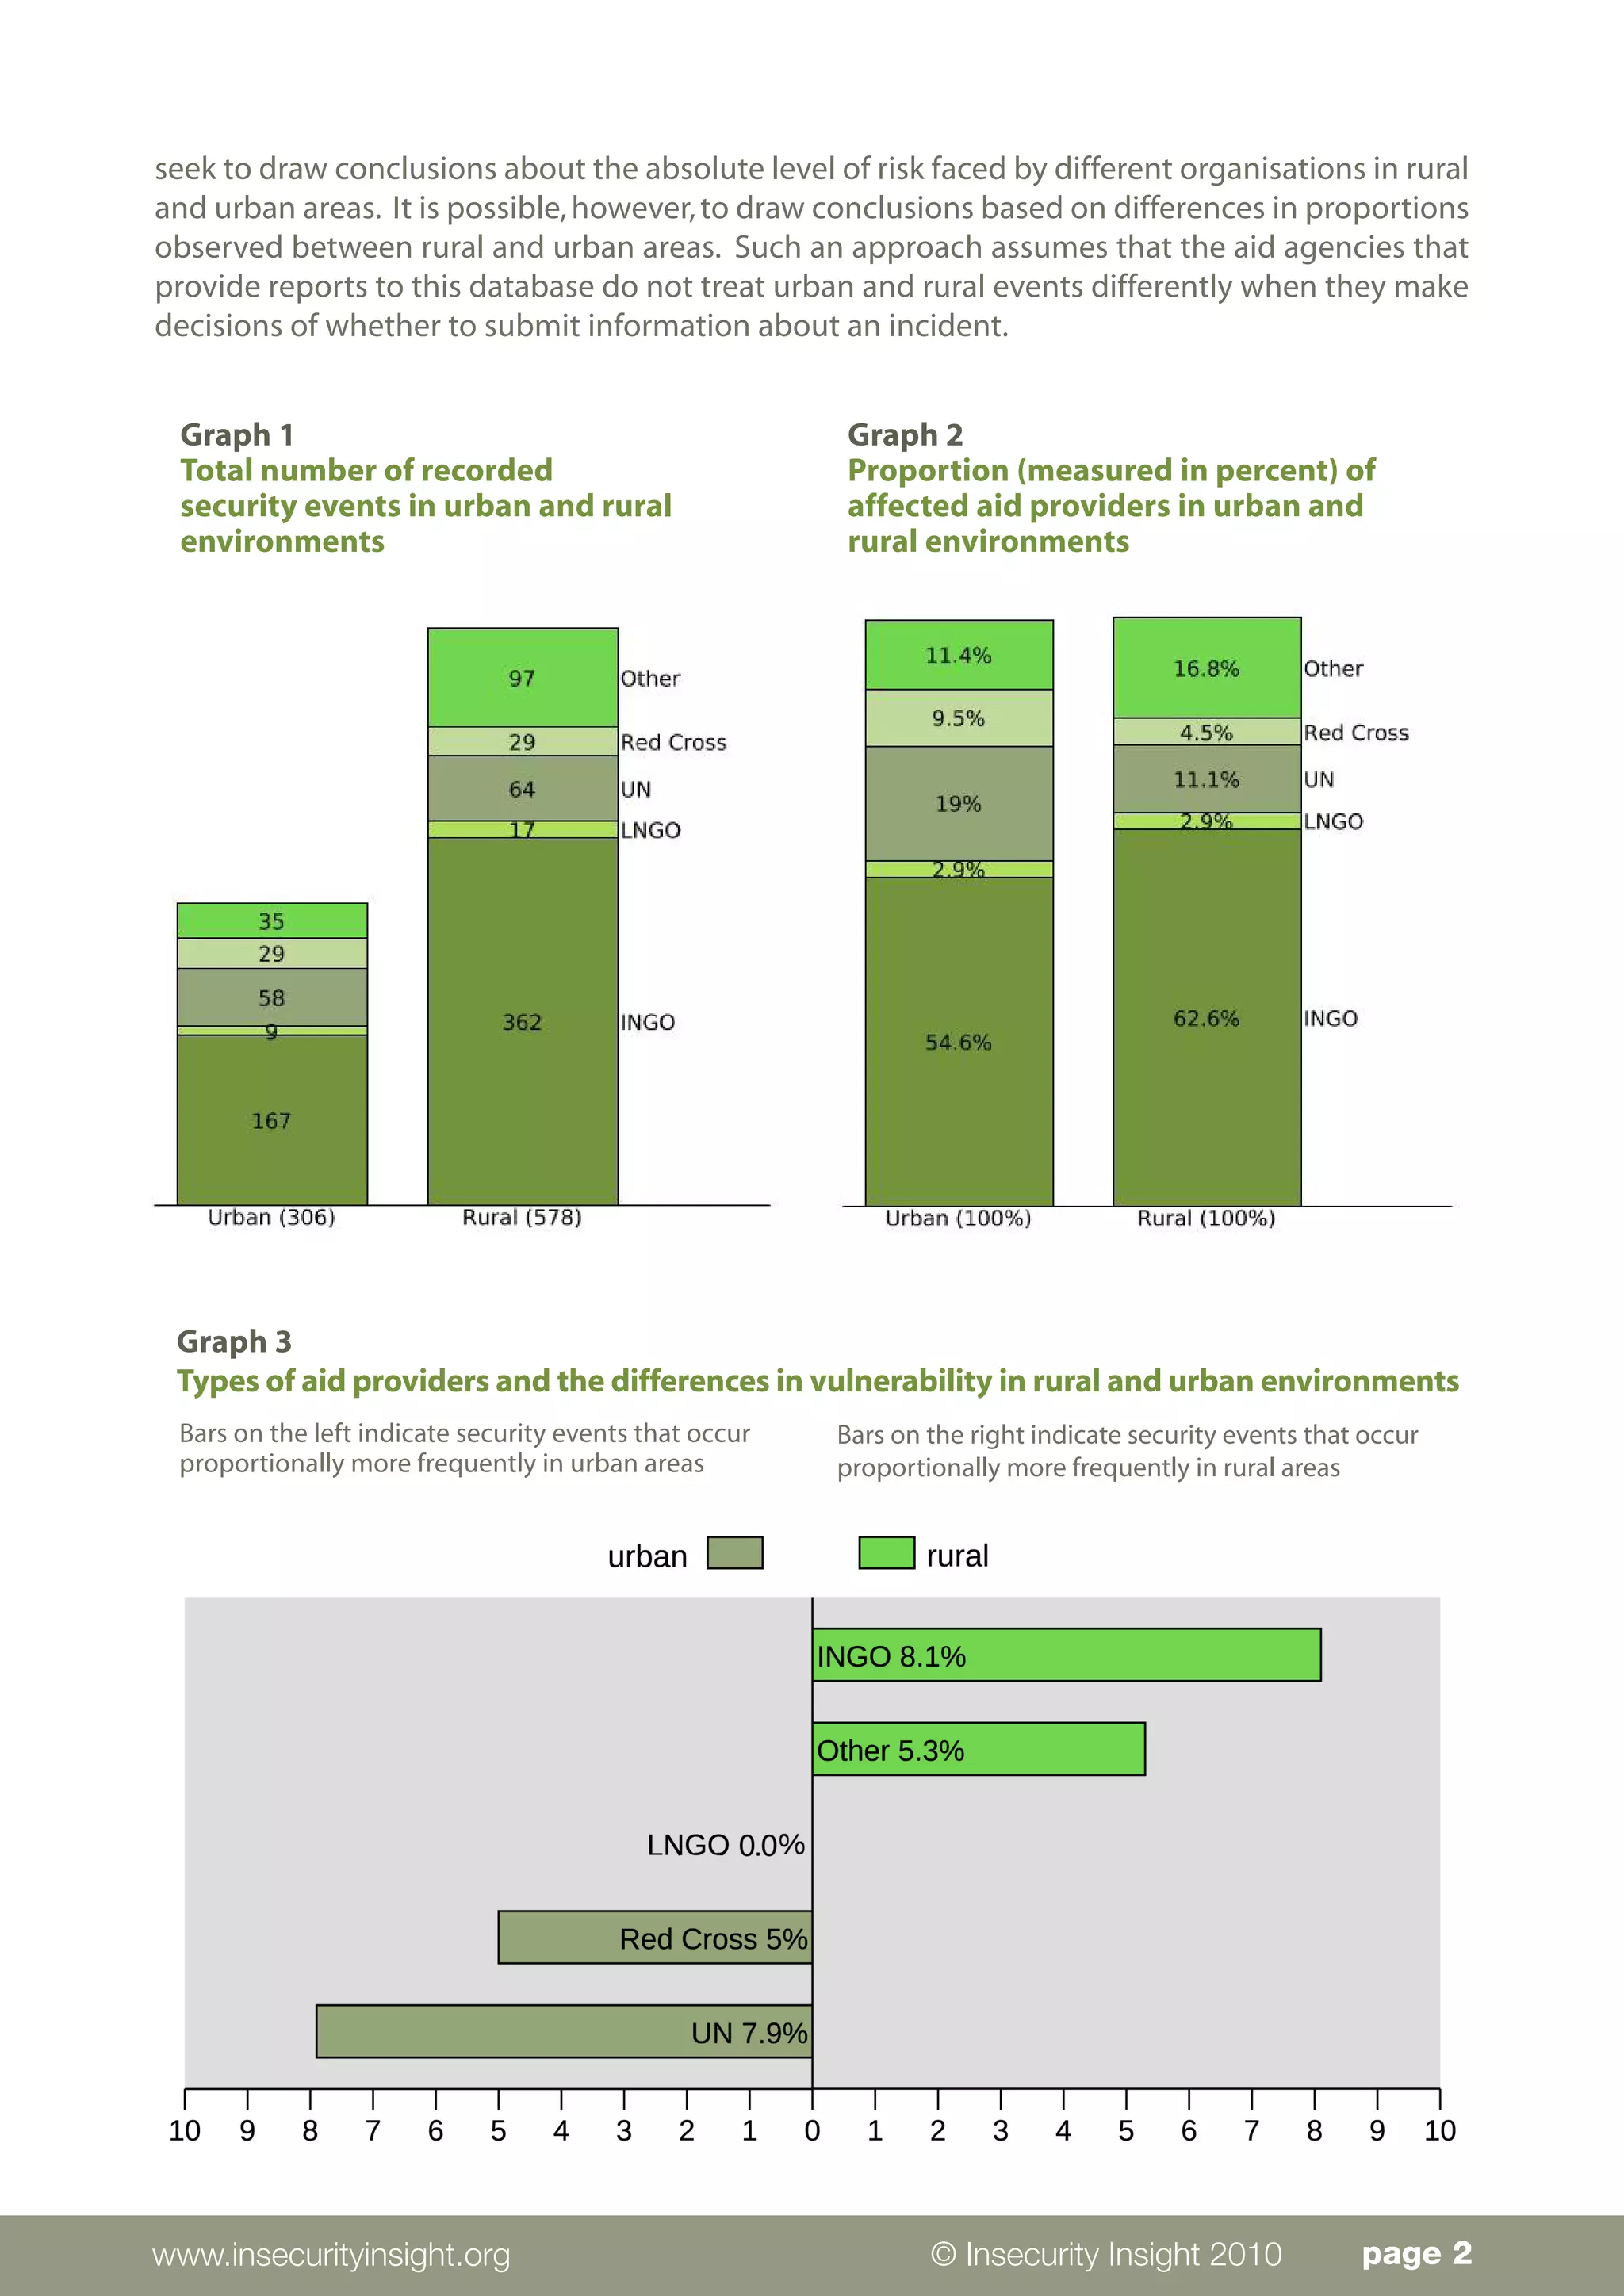
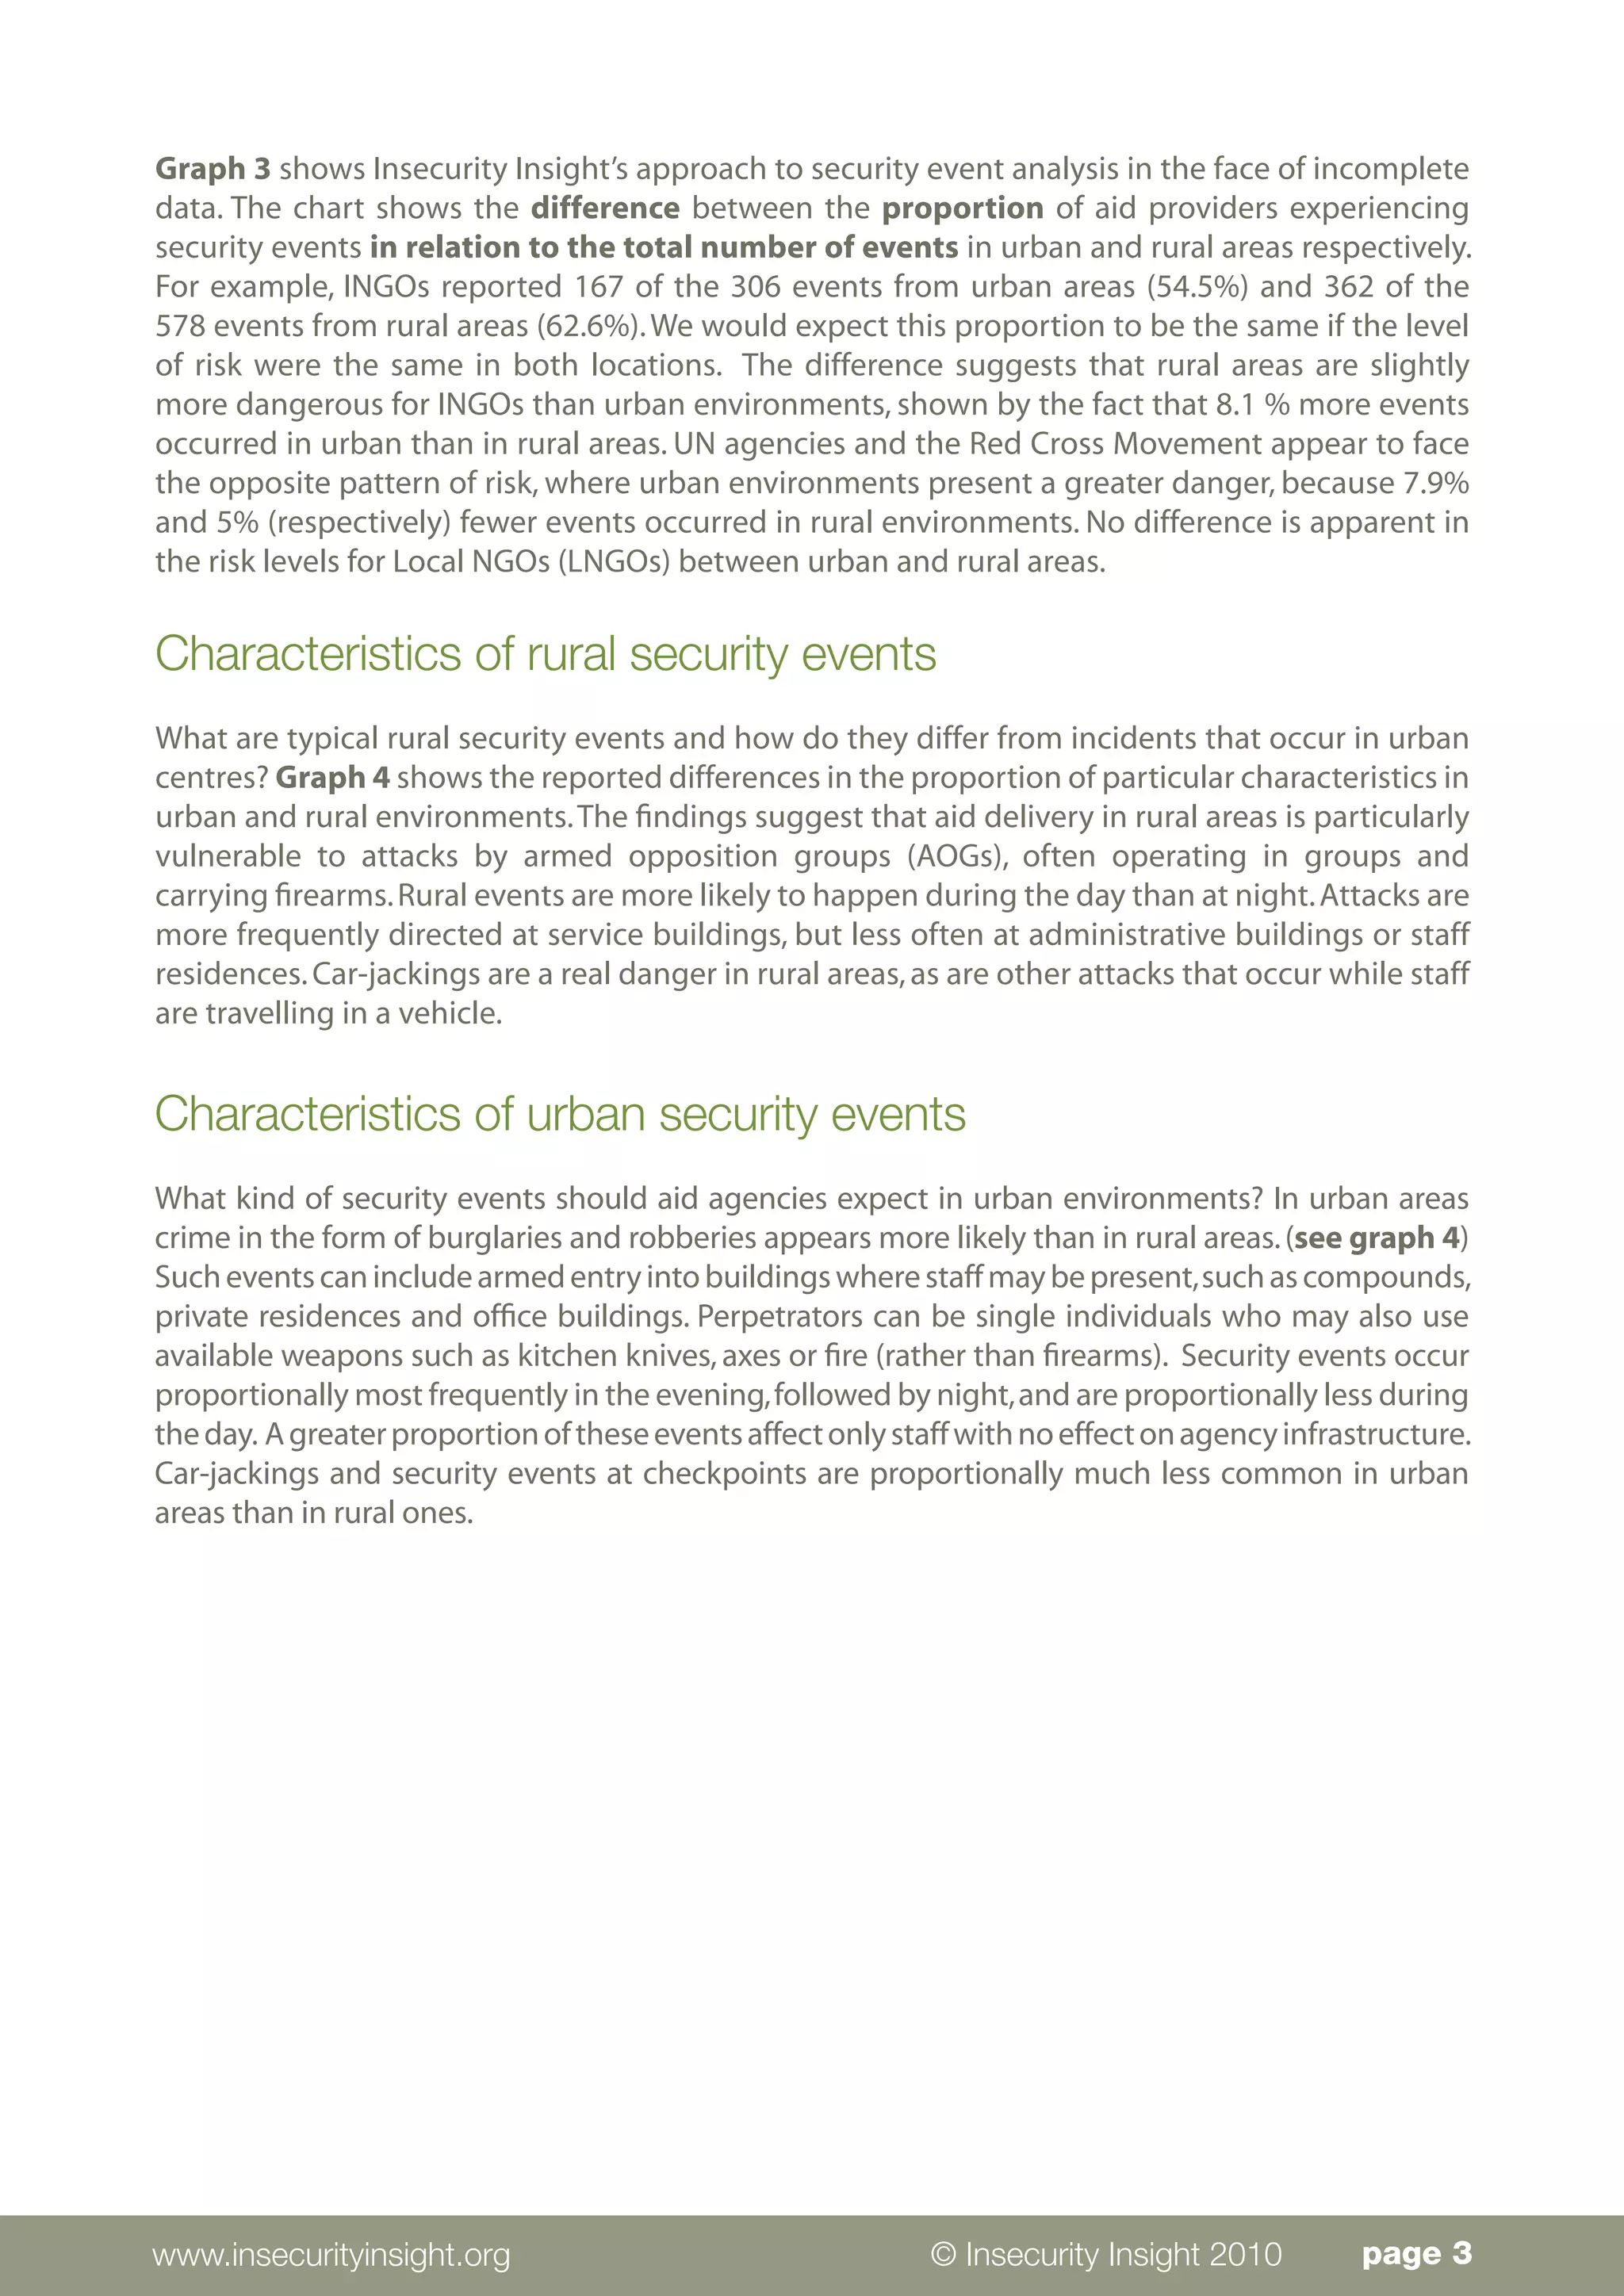
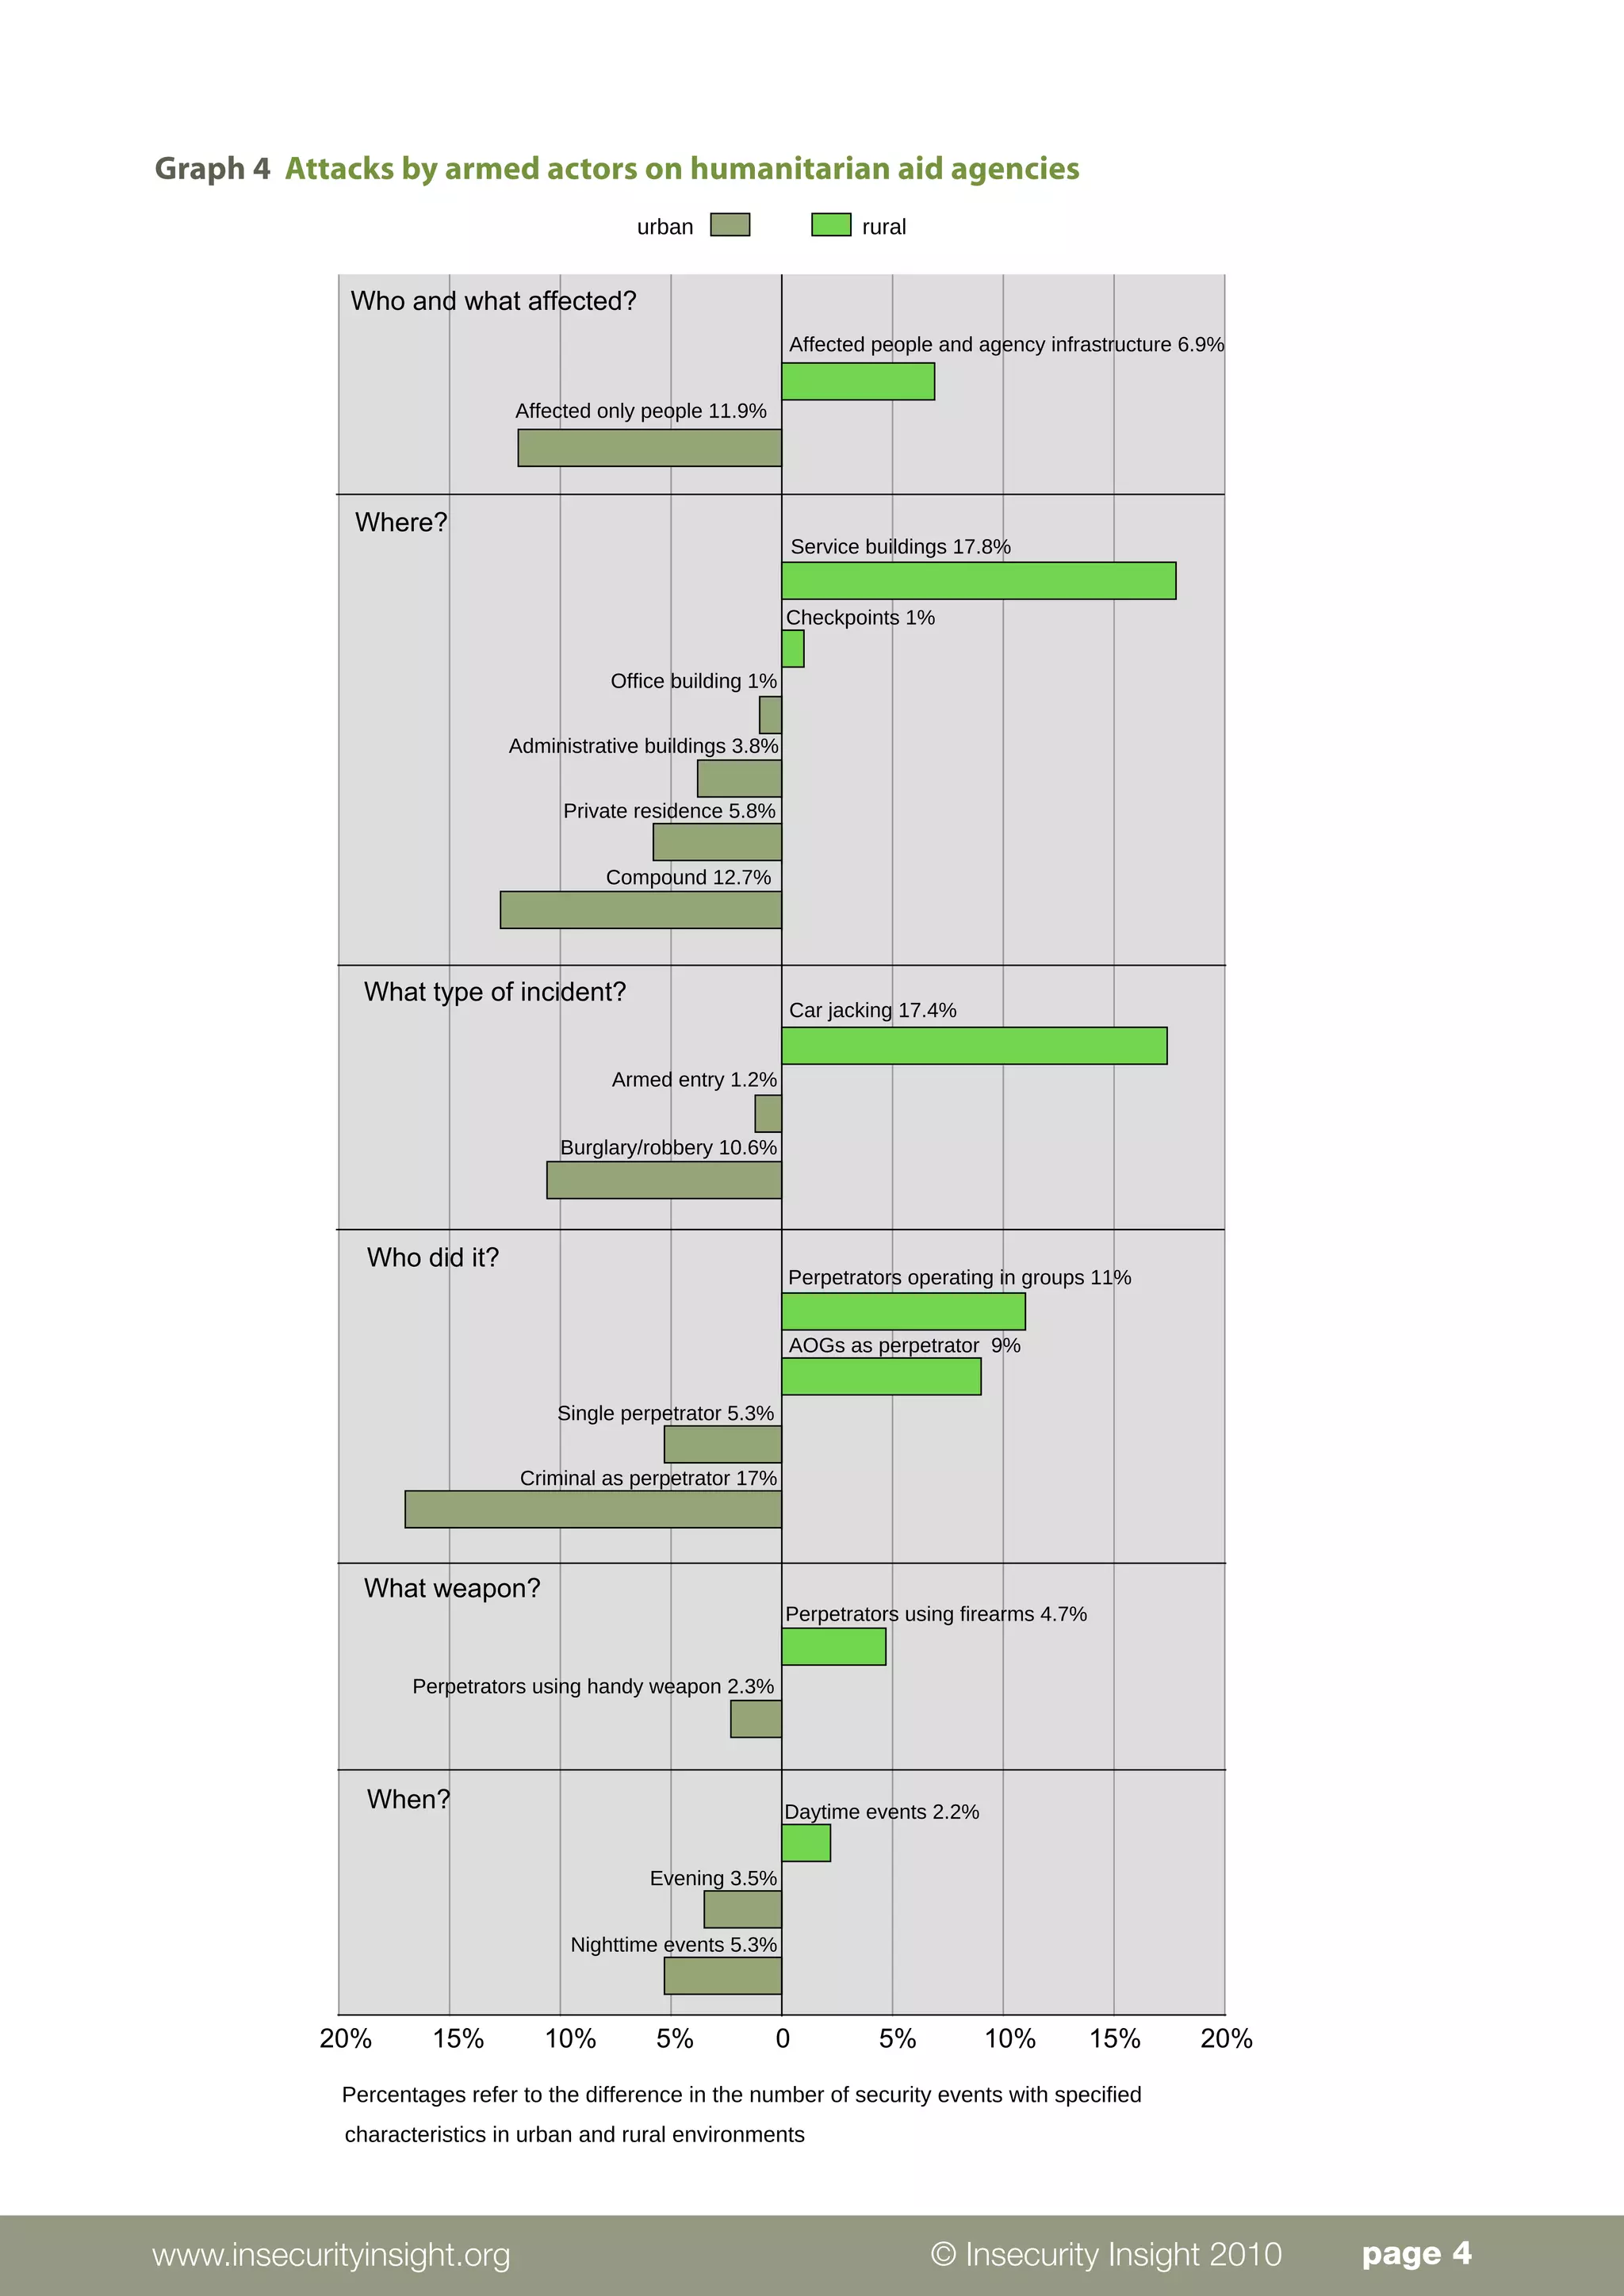

The document analyzes security incidents affecting humanitarian agencies between 2008-2010 to compare differences between urban and rural environments. It finds that while more incidents were reported in rural areas, international NGOs faced slightly higher risks, while UN agencies and the Red Cross faced greater risks in urban areas. Rural incidents were more likely to involve attacks by armed groups during the day on service buildings, vehicles, and checkpoints. Urban incidents saw higher crime, especially burglaries at night targeting residences, compounds, and staff. The analysis aims to help agencies anticipate location-specific risks to better manage security.


![Final presentation raza[1]](https://cdn.slidesharecdn.com/ss_thumbnails/finalpresentationraza1-110328072251-phpapp02-thumbnail.jpg?width=640&height=640&fit=bounds)


