Transforming West Bengal - Changing the Agenda for an Agenda for Change
•
5 likes•4,839 views

This document provides an overview and analysis of economic development in West Bengal state in India. It discusses how West Bengal has fallen behind compared to other states in terms of economic growth, education, health, and poverty reduction since the early 1960s. While West Bengal had one of the higher growth rates in the early 1960s, by 2008 it was below average across most development indicators. The document argues that decades of left front rule have failed to create an environment conducive to faster economic growth that could help improve living standards for West Bengal's population. It calls for a change in governance and policies to put West Bengal on a path of stronger development.

Recommended
Recommended
More Related Content
Similar to Transforming West Bengal - Changing the Agenda for an Agenda for Change
Similar to Transforming West Bengal - Changing the Agenda for an Agenda for Change (20)
More from Indicus Analytics Private Limited
More from Indicus Analytics Private Limited (20)
Recently uploaded
Recently uploaded (20)
Transforming West Bengal - Changing the Agenda for an Agenda for Change
- 2. Indicus Analytics Transforming West Bengal – Changing the Agenda for an Agenda for Change; Bibek Debroy and Laveesh Bhandari 1
- 3. This is an Indicus White Paper Acknowledgements: Deepa Nayak, Ankur Gupta, Ramrao Mundhe & Sunil Bhatt About Indicus Indicus Analytics is India’s leading economics research and data analysis firm. Indicus follows the progress of the many facets of the Indian economy at a sub-national and sub-state level on a real time basis. It conducts monitoring and evaluation studies, indexation and ratings, as well as policy analysis. Indicus provides research inputs to governments, leading research organizations, civil society groups, national and international media, international institutions and industry. Indicus also conducts and disseminates studies and analysis on the Indian economy for public discussion and debate via its various newsletters as well as white papers. Disclaimer The information contained in this document represents the current views of the author(s) as of the date of publication. This White Paper is for informational purposes only. The author(s) and Indicus makes no warranties, express, implied or statutory, as to the information in this document. No part of this document may be reproduced, stored in or introduced into a retrieval system, or transmitted in any form or by any means (electronic, mechanical, photocopying, recording, or otherwise), or for any purpose, without the express written permission of the author(s). February 26, 2009. Indicus Analytics, 2nd Floor Nehru House, 4-Bahadur Shah Zafar Marg, New Delhi 110002
- 4. Indicus Analytics Transforming West Bengal – Changing the Agenda for an Agenda for Change; Bibek Debroy and Laveesh Bhandari 3
- 5. Indicus Analytics Section 1 A Story of Falling Behind “The only service to be done for our lower classes is, to give them education, to develop their lost individuality.” – Swami Vivekananda, in a letter from Chicago, written to the Maharaja of Mysore. “I have undertaken this duty because at the present moment the economic story of British India has to be told, and the deep-seated cause of the poverty of the Indian people has to be explained….. A nation prospers if the sources of its wealth are widened, and if the proceeds of taxation are spent among the people, and for the people.” – Romesh Chunder Dutt, The Economic History of India Under Early British Rule “Look round and see, look at Magadha, Kasi, Kanchi, Delhi, Kashmir – where do you find such misery as here?” – Bankim Chandra Chatterjee in Anandamath “Where the mind is without fear and the head is held high; Where knowledge is free;…Into that heaven of freedom, my Father, let my country awake.” – Rabindranath Tagore “I know that it will be argued that the continuance of a party in such circumstances, standing behind the State, will convert that State into a totalitarian one…The State will possibly become a totalitarian one if there be only one party as in countries like Russia, Germany and Italy.” – Subhas Chandra Bose, in A Program for Reconstructing “Post-War” India These are names, and possibly quotations, familiar to every Bengali. If one looks around and sees, one doesn’t find misery anywhere in India comparable to that in West Bengal state. The mind is not without fear. The head is not held high. Nor is knowledge free. The lower classes don’t have access to education. A party standing behind the State has converted the State into a totalitarian one. We have undertaken this duty because the economic story of West Bengal under Left Rule has to be told. The sources of wealth are not being widened. The proceeds of taxation are not being spent among the people, for the people. We are documenting the story of West Bengal’s decline so that the agenda can be changed, so that people possess the information required for exercising choice, so that an agenda for change can be articulated. Once upon a time, it used to be said that what Bengal thinks today, India thinks tomorrow. It is unlikely that anyone will say this today. Instead, what India thinks today, West Bengal doesn’t think about even tomorrow. It doesn’t even think about it day after tomorrow. The fault doesn’t lie in West Bengal’s citizens, who are as talented and enterprising as elsewhere in the country. Instead, the fault lies with the stars that they elect once every five years. In the early 1960s, West Bengal was one of the more successful States in India, irrespective of the criterion used to measure development. In 2008, West Bengal is just below average, irrespective of the criterion used to measure under-development. Other States perform better and West Bengal falls consistently behind. What has changed between the early 1960s and 2008? State governments have changed and since the late 1960s, and more so since 1977, this is what several decades of Left Front rule has done to West Bengal. In the United States, people have recently voted for a change, because they are sick and tired of old governments and old policies. That is what one also needs in West Bengal. The United States is a country people want to migrate to, witness the queues outside US Embassies everywhere in the world. Indian States are no different. People migrate to States that perform well – States like Haryana, Maharashtra and Gujarat. In contrast, between the two Censuses of 1991 and 2001, net out- migration for West Bengal was 0.04% a year. However, every one of West Bengal’s citizens Transforming West Bengal – Changing the Agenda for an Agenda for Change ; Bibek Debroy and Laveesh Bhandari 4
- 6. Indicus Analytics cannot migrate out of West Bengal. That can’t be a solution. The solution is to change the State of governance within West Bengal. Economic reforms were introduced in India in 1991. Reforms introduced before 1991 weren’t that comprehensive or systematic. Since the 1991 reforms, growth rates have increased throughout India. During the Sixth (1980-84) and Seventh (1985-89) Plans, annual rate of GDP growth was around 5.5%. But during the Eighth Plan (1992-96), this increased to 6.5% and during the Tenth Plan (2002-06), it increased to 7.7%. The Eleventh Plan (2007-12) hopes for 9% growth, since that is what the Indian economy has achieved since 2003. Of course, there is a global slowdown now and this has affected India adversely, as has the increase in interest rates before the Wall Street-triggered financial crisis caught most people unawares. This means it will take the country 2-3 years before India again resumes the 9% growth trajectory. But that is a transient point. The more important point is one about West Bengal’s absolute and relative performance. How has West Bengal performed since 1991? There is an impression that West Bengal hasn’t performed that badly in the 1990s, with a growth rate that is just about the all-India average. That’s roughly correct, since West Bengal’s real Gross State Domestic Product (GSDP) growth was 6.3% during the Eighth Plan (1992-96) and 6.9% during the Ninth Plan (1997-2001) and one shouldn’t forget that the country didn’t grow all that fast during the Ninth Plan. But this is only one part of the story. Since 2003, the country’s growth broke into the 9% league and West Bengal was left out, as the accompanying graph clearly illustrates. For example, during the Tenth Plan, West Bengal was supposed to grow at 8.8%. But only managed to grow at 6.1%. During the Eleventh Plan, West Bengal is projected to grow at 9.7%. This is a figure accepted by the Planning Commission in the Eleventh Plan document and therefore, is a figure endorsed and suggested by the government of West Bengal. However, is there any guarantee that the State won’t again fall short, as it did during the Tenth Plan? None whatsoever. A government is meant to govern. Different people mean different things when they use the word governance. Irrespective of that, the least a government can do is to ensure a facilitating West Bengal Growth in GSDP 10 India 9 8 7 6 (%) 5 4 3 2 1 0 1994-95 1995-96 1996-97 1997-98 1998-99 1999-00 2000-01 2001-02 2002-03 2003-04 2004-05 2005-06 Source: CSO environment for growth, without blaming everything on the centre’s step-motherly treatment or partition and refugee influxes in 1947 and 1971. This is not to suggest that these factors Transforming West Bengal – Changing the Agenda for an Agenda for Change; Bibek Debroy and Laveesh Bhandari 5
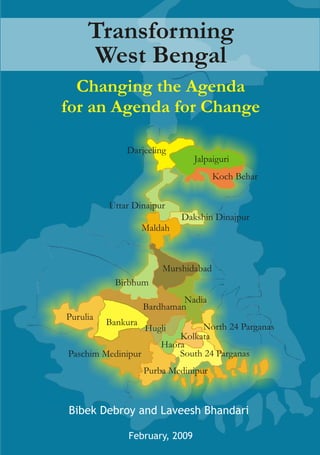
- 7. Indicus Analytics were unimportant. But they were important historically. One can’t continuously point to these and look backwards and blame everything that has not happened in the State on history. The finger must be pointed inwards and at the Left Front government. It has only been able to ensure a facilitating environment that ensures growth at roughly the all-India average. It has not been able to ensure a facilitating environment that catapults growth to a faster trajectory. If it has not succeeded in the past, why should it succeed in the future? Growth is important because that is the only long-lasting solution to problems of poverty and unemployment. Growth increases the size of the cake and ensures prosperity and advancement for everyone. As growth increases, poverty declines. Health and education indicators improve. So do a host of other governance indicators. This doesn’t mean that growth is an end in itself, or that the composition of growth is unimportant. Growth is never a sufficient condition. But it is certainly a necessary one, even more so in a State that has a population of 82 million by the 2001 Census. This kind of population figure means that the population density per sq km is 904 and is one of the highest in the country. Because growth hasn’t been fast enough, West Bengal’s per capita GSDP was Rs 29,457 in 2007-08. This gives West Bengal 18th rank in the country, not a rank one can inordinately be proud of. And one shouldn’t forget that there is a considerable amount of variation across West Bengal’s 18 districts. Kolkata isn’t representative of West Bengal. West Bengal’s Human Development Report (HDR), published in 2004 and endorsed by the Left Front government, acknowledges this too. The HDR identified six northern districts (Darjeeling, Jalpaiguri, Koch Behar, Maldah, Uttar Dinajpur, Dakshin Dinajpur), three western districts (Purulia, Bankura, Birbhum) and the Sunderbans area of the two 24 Parganas districts as particularly backward. Understandably, Kolkata is West Bengal’s richest district and Uttar Dinajpur, which is West Bengal’s poorest district, has a per capita SDP that is only 33.6% of that of Kolkata. For all its talk about equity and removal of inequalities, the West Bengal government hasn’t been able to improve the lot of the people in the worst-off and backward districts. Poverty ratios are calculated on the basis of large-sample NSS (National Sample Survey) data and these are available at infrequent intervals, the last one dating to 2004-05. In 2004-05, from the Planning Commission’s estimates, the percentage of population below the poverty line in West Bengal was 24.7%. Which States performed worse than West Bengal? The answer is Bihar, Karnataka (marginally worse), Madhya Pradesh, Maharashtra, Orissa, Uttar Pradesh, Chhattisgarh, Jharkhand, Uttarakhand and Dadra & Nagar Haveli. Barring the inclusion of Karnataka and Maharashtra, this isn’t a list a citizen of West Bengal should be proud of. 42.4% of West Bengal’s rural scheduled tribe (ST) population is below the poverty line. The West Bengal HDR used data from NSS 1999-2000 and computed that 78.72% of rural Purulia’s population was below the poverty line. 61.53% of urban Jalpaiguri’s population was below the poverty line. Two points emerge. First, growth hasn’t been significant enough to reduce poverty. Second, the situation is especially bad in backward and deprived districts and this isn’t thrown up in aggregate State-level figures. What empowers people and enables them to improve their lot and progress towards prosperity? In 2001, West Bengal’s literacy rate was 68.6%, slightly above the all-India literacy rate of 64.8%. This West Bengal figure of course masks a literacy rate of 48.6% in Uttar Dinajpur. But that apart, Himachal Pradesh had a literacy rate of 76.5%, Tripura had a literacy rate Transforming West Bengal – Changing the Agenda for an Agenda for Change ; Bibek Debroy and Laveesh Bhandari 6
- 8. Indicus Analytics of 73.2% and Uttarakhand had a literacy rate of 71.6%. A State that was once labeled as the intellectual capital of the country performs worse than these States. Any literacy rate incorporates an element of adult literacy. In that sense, it is much more important to focus on what is happening to education among the young, since much of India is relatively young. The gross enrolment rate (Classes I-VIII) is 94.67% in West Bengal, worse than Arunachal Pradesh, Chhattisgarh, Himachal Pradesh, Madhya Pradesh, Orissa, Rajasthan, Tripura and Uttarakhand. Other States are doing far better in getting children into school. Not only are other States doing far better in getting children into school. They are also doing far better in retaining them there. The drop-out rate (Classes I-X) is 78.03% in West Bengal. In the entire country, only Bihar (83.06%), Meghalaya (79.15%), Nagaland (97.29%) and Sikkim (82.30%) perform worse. In primary schools, West Bengal has 54 pupils per teacher. Himachal Pradesh has 24. West Bengal has 63 elementary schools per lakh population. Assam has 137. In addition to education, health is also often a public good, warranting provisioning by the State. There are some question marks about the quality of maternal mortality data. Subject to that, West Bengal’s maternal mortality ratio (per 100,000 live births) is 194. Maharashtra has managed to reduce it to 149. The infant mortality ratio (per 1000 live births) is 38 in West Bengal. Tripura has managed to reduce it to 31. In all fairness, in the inter-State comparisons, West Bengal performs better on health than on education, depending on the indicator used. But that is no argument for complacency, or for arguing that the government has done enough. For instance, children (under 3 years) who are under-weight for age amount to 43.5% in West Bengal. Children (aged 0-5 months) who are exclusively breast-fed amount to 58.6% in West Bengal. 63.8% of women in the age-group 15-49 years suffer from anemia. There were 2.6 million cases of diarrhea in West Bengal in 2006, the highest in the country, followed by Transforming West Bengal – Changing the Agenda for an Agenda for Change; Bibek Debroy and Laveesh Bhandari 7
- 9. Indicus Analytics Andhra Pradesh with 1.2 million. There were 110,835 cases of typhoid in 2006, the second highest in the country after Andhra Pradesh. There were 175 deaths (not cases) from malaria in 2005, the second highest in the country after Orissa (255). There were 820 deaths (not cases) from TB in 2006, the third highest in the country after Andhra Pradesh and Delhi. Health indicators are a broader spectrum than education indicators. Therefore, there are some health indicators where West Bengal performs better than all-India averages. However, there are also health indicators where West Bengal performs worse than all-India averages. Nor should one forget the inter-district variations mentioned earlier. The infant mortality rate is as high as 74 in both Purulia and Dakshin Dinajpur. Eight districts (Maldah, Murshidabad, Nadia, North 24 Parganas, South 24 Parganas, Bardhaman, Haora, Hugli) are seriously affected by arsenic poisoning. The human development index (HDI) puts together three elements that affect human development and deprivation – per capita income, education and health. Because of the reasons just mentioned, West Bengal’s HDI is 0.610. This doesn’t look that bad when compared to most of India’s states. However, the district with the lowest HDI in West Bengal only has a value of 0.440. This is nothing short of pathetic. One reason for that is a complete inability to target subsidies. It is no one’s case that the poor should not be subsidized. However, the poor have to be identified and targeted. All poor should get subsidies and no non-poor should be subsidized. Such identification of the poor is attempted through BPL (below the poverty line) and AAY (Antyodaya Anna Yojana) cards. Yet, NSS data from the 61st round (2004-05) show that 47.3% of West Bengal’s poor have no card at all. In contrast, 43.3% of non-poor have BPL or AAY cards. This doesn’t say much about a government that is supposed to work in the name of the poor. In addition to social infrastructure, some elements of physical infrastructure can also be public goods. The 11th Finance Commission worked out an index of physical infrastructure for India’s states. In this, West Bengal had a score of 111.25. A state like Punjab had a score of 187.51. Physical infrastructure doesn’t always mean the extremely visible elements of ports, of either the air or sea variety. Even for sea-ports, one doesn’t mean Haldia, which has tended to perform relatively better. For Kolkata port, the Tenth Plan target was one of handling 21.40 million metric tons of cargo per year. In 2002-03, Kolkata port handled 7.20 million metric tons and in 2006-07, the port handled 12.60 million metric tons. Perhaps one should mention that the 13 major sea-ports collectively exceeded the Tenth Plan target in 2006-07. Leaving ports aside, let us turn to road transport. This affects everyone, especially the poor. Let us take Calcutta STC as an instance. In 2006-07, the all-India average of fleet utilization was 82.50%, but Calcutta STC had 59.0%. The all-India average vehicle productivity (earning per bus per km) was Rs 229, but Calcutta STC had Rs 128. The all-India average staff productivity (earning per worker per day) was Rs 39.39, but Calcutta STC had Rs 22.26. Less than 50% of households have electricity connections. 56.2% of habitations have still not been connected under the Pradhan Mantri Gram Sadak Yojana (PMGSY). A government is also supposed to ensure law and order. In December 2007, 283,237 cases were pending in Calcutta High Court, 7.5% of the country’s backlog in High Courts. 2.2 million cases were stuck in Calcutta’s lower courts. Several States have experimented with backlog reduction (Lok Adalats, Fast Track Courts, Family Courts, People’s Courts, Mobile Transforming West Bengal – Changing the Agenda for an Agenda for Change ; Bibek Debroy and Laveesh Bhandari 8
- 10. Indicus Analytics Courts, shift systems). But in each of these, West Bengal’s track record has been lackluster. In 2007, many States in India passed a new Police Act. But the last one knew, all West Bengal did was to set up a drafting committee. At the end of 2005, there were 14,017 under-trial prisoners in West Bengal, 108 of whom have been waiting for trial for more than 5 years. This is the kind of track record one associates with India’s bad lands, not with an advanced state. The provision of public goods requires the government to put its fiscal house in order. The 12th Finance Commission set a target of 3% for the gross fiscal deficit as a share of GSDP. In 2006-07, the last year for which fiscal data are available, West Bengal was at 4.5%. The revenue deficit is 71.1% of the gross fiscal deficit. This shows that borrowings are being used for current expenditure, not for creating productive assets. At 4.8% and 0.5% respectively (as shares of GSDP), the tax and non-tax revenues are the lowest in India. The government doesn’t have the resources, nor has it made an attempt to get them. How does one expect such a government to provide physical and social infrastructure or subsidize the poor? Consider also the following telling facts. 49% of West Bengal’s agriculture is still rain-fed. The annual average rate of growth in agriculture (net State domestic product that comes from agriculture) was 4.63% between 1984- 85 and 1995-96. This looks impressive, especially because the all-India rate was only 3.62%. But this growth rate has begun to plateau out. Between 1995-96 and 2004-05, the annual average rate of growth in West Bengal’s agriculture slowed to 2.67%. There are problems with water-logging, improper drainage, salinity, arsenic contamination, non-availability of electricity and inadequate road and transport infrastructure. Reforms in agriculture remain incomplete, beyond the land reforms and decentralization agenda. Commercialization, diversification and dis-intermediation in agriculture aren’t encouraged. Unlike several other States, West Bengal has yet to amend the Agricultural Produce Marketing (Regulation) Act. Only executive action has been promised and no one knows when that is likely to happen. Small-holder and fragmented agriculture, particularly in food-grain production, cannot be a solution to problems of poverty and unemployment. Yet the Left Front government seems to have no coherent vision about how to pull people out of agriculture and how to improve productivity for those who remain in agriculture and allied activities. 43% of West Bengal’s labour force is still in agriculture, often at a subsistence level. In 2006-07, the last year for which a complete year’s data are available, Rs 51,386 crores worth of investment intentions (industrial entrepreneur memoranda plus letters of intent plus direct industrial licenses) were announced in West Bengal. This looks like an impressive figure, taken in isolation. In that same year, the comparable figure was Rs 72,250 crores for Karnataka. To make the comparison even more telling, the figure was Rs 96,869 crores for Orissa and Rs 118,737 crores for Chhattisgarh. A comparison of manufacturing employment across West Bengal and Gujarat is even more revealing. The number of workers engaged in manufacturing is 3.1 million in West Bengal, compared to Gujarat’s 1.5 million. However, only 1.2 million of West Bengal’s employment is in so-called directory (registered) establishments, compared to Gujarat’s 1 million. And 1.8 million of West Bengal’s manufacturing employment is in the rural sector, compared to Gujarat’s 413,000. West Bengal’s manufacturing employment is own account, rural and unregistered. Despite incentives from registration, why do so many of Transforming West Bengal – Changing the Agenda for an Agenda for Change; Bibek Debroy and Laveesh Bhandari 9
- 11. Indicus Analytics West Bengal’s SSI (small-scale industry) units prefer to remain unregistered, a fact also borne out by the 3rd SSI Census? Why doesn’t manufacturing employment become more organized and graduate upwards? The skills and infrastructure problems also afflict the services sector, which now accounts for 55% of GSDP. There is a serious problem with unemployment, particularly among the educated and the young. In a country like India, where the problem is more one of under-employment, there are indeed some problems with unemployment data. But despite that caveat, the National Sample Survey’s current weekly status figures reveal something about the dimensions of unemployment. Among educated urban people, the all-India figure is 8.3%, but West Bengal has 9.9%. Among educated rural people, the all-India figure is 8.5%, but West Bengal has 12.3%. Among the young (15-29 years) in urban India, the all-India figure is 12.5%, but West Bengal has 15.4%. Among the young in rural India, the all-India figure is 7.1%, but the West Bengal has 10.3%. That’s the future the Left Front government offers to the young and the educated, the segment that is supposed to provide India’s demographic dividend. This state of affairs cannot, and should not, continue. It is time for a change. Transforming West Bengal – Changing the Agenda for an Agenda for Change ; Bibek Debroy and Laveesh Bhandari 10
- 12. Indicus Analytics Section 2 The Symptoms and the Disease Before deciding on the directions for change, one needs to get a fix on how bad the situation really is. And in doing this, it is important to separate the symptoms from the disease. The real disease - not imagined ones. Symptom No.1 – West Bengal has not been growing fast enough Notwithstanding the need for direct government measures to reduce poverty, the only long- lasting solution to reducing problems of poverty and unemployment is growth. If the size of the cake doesn’t increase, what purpose will redistribution serve? In a general sense, people know that West Bengal hasn’t been growing fast enough. However, they don’t always know how bad the situation is and how much it has deteriorated since the early 1960s. Let’s take Maharashtra as an example. This is a State many Bengalis identify with, because of reasons of culture, films, theater, literature, the freedom movement, exposure to English influences and so on. In addition, Maharashtra is a large and heterogeneous State, with backward regions. This is therefore a fairer comparison than picking on a State like Goa or Delhi. Popular perceptions are that Maharashtra is one of India’s advanced States, regardless of the indicator used to measure advancement. And popular perceptions are that West Bengal is one of India’s middle-rung States. Those popular perceptions aren’t wrong. But let’s cast our minds back to the early 1960s, say 1960-61. The net State domestic product (NSDP) is a measure of how much a State’s citizens are producing in the nature of goods and services. The RBI tells us that in constant 1999-2000 prices, West Bengal’s NSDP was Rs 270.9 billion in 1960-61 and Maharashtra’s was Rs 332.2 billion. Maharashtra was ahead of West Bengal even then, but one could at least talk about these two States in the same breath. Let’s now take the comparison down to 2005-06, the last year for which we have NSDP data from RBI. West Bengal’s NSDP now was Rs 1,738.0 billion and Maharashtra’s was Rs 3,029.5 billion. The two States are no longer in the same league. Source: RBI This is perfectly understandable. Maharashtra grew much faster than West Bengal. Take the four and a half decades one at a time. Between 1960-61 and 1969-70, West Bengal’s annual Transforming West Bengal – Changing the Agenda for an Agenda for Change; Bibek Debroy and Laveesh Bhandari 11
- 13. Indicus Analytics average rate of real NSDP growth was 2.45% and Maharashtra’s was 2.90%. Maharashtra was still ahead, but only just. But that was before the Left scourge hit West Bengal. Between 1970-71 and 1979-80, West Bengal’s annual average rate of real NSDP growth was 3.02%, but Maharashtra’s shot up to 5.76%. Based on agriculture, West Bengal managed to pull itself up in the 1980s, but not far enough. Between 1980-81 and 1989-90, West Bengal’s annual average rate of real NSDP growth was 4.59%, but Maharashtra’s was 5.58%. The 1990s seemed to change this. West Bengal seemed to demonstrate that the sun did rise in the east, even if the east was red. Between 1990-91 and 1999-2000, West Bengal’s annual average rate of real NSDP growth was 6.97%, marginally ahead of Maharashtra’s 6.94%. However, the popping of the Champagne bottles in Davos and elsewhere did not last. Between 2000-01 and 2005-06, West Bengal’s annual average rate of real NSDP growth was 5.82%, not that bad by historical standards. However, Maharashtra increased growth to 7.42%, highlighting a point made earlier. India is a poor country. India is a country that growth has bypassed and marginalized for a long time. The decades of the 1970s and 1980s were lost development decades for India, even if growth increased a bit during the 1980s. India has a lot of catching up to do. India is a young country. India is an impatient country. India is no longer content with 6% growth. The future generations of India want 9%. And especially since 2003, some Indian States are ready to deliver 9%, or something close to it. Will West Bengal contribute to that effort or will West Bengal pull India down? Since that break in the growth trajectory in 2003, the evidence is that West Bengal is pulling India down. The graph that follows substantiates this point. Source: RBI Imagined Disease No.1 – West Bengal has a Population Problem Population is always a convenient scapegoat, especially in a country like India, the first country in the world to introduce a formal family planning programme. Mao Zedong, the one-time favourite of India’s communists, used to say in the Chinese context that he saw two billion hands when others saw one billion mouths. The perception that population is a liability rather than an asset is not necessarily true, a point also made in Nandan Nilekani’s recent book “Imagining India”. But let’s leave that debate aside. In the 2001 Census, West Bengal had a population of 80.18 million. Maharashtra had a population of 96.9 million. It’s not the case that West Bengal was over-burdened with population, even if there was an influx of immigration, especially in 1947/48 and 1971. There have been immigration influxes into Transforming West Bengal – Changing the Agenda for an Agenda for Change ; Bibek Debroy and Laveesh Bhandari 12
- 14. Indicus Analytics Maharashtra too. Consider the annual average decadal rates of population growth, from census to census. Between 1951 to 1961, West Bengal’s rate of growth of 2.88% compares with Maharashtra’s 2.14%. Between 1961 and 1971, West Bengal’s rate of growth of 2.41% compares with Maharashtra’s 2.46%. Between 1971 and 1981, West Bengal’s rate of growth of 2.11% compares with Maharashtra’s 2.22%. Between 1981 and 1991, West Bengal’s rate of growth of 2.23% compares with Maharashtra’s 2.32%. Between 1991 and 2001, West Bengal’s rate of growth of 1.65% compares with Maharashtra’s 2.07%. The pace of demographic transition, with a decline in birth rates, varies across India’s States, having occurred in the southern States before the others. In both West Bengal and Maharashtra, there is a suggestion of this transition having set in from the 2001 Census, or even earlier, from 1981. However, the relevant fact is that West Bengal hasn’t suffered from a population problem than is any more than usual. That’s an imagined disease, not a real one. Source: Census of India A common impression that West Bengal has been constrained because of a high concentration of population in Kolkata is also not true. Kolkata proper, as opposed to Haora or 24 Parganas had a population of 4.6 million in 2001, 5.7% of West Bengal’s total population. In 1951, Kolkata’s corresponding share was 10.3%. Between 1991 and 2001, Kolkata’s annual average rate of growth in population was 0.39%. The absolute population and the shares of the 24 Parganas have indeed increased, leading to problems of employment growth and urban prosperity in the hinterland. But that’s a separate point. Indeed, the annual average rate of urbanization in India has been 2.8% between 1991 and 2001. But for West Bengal, it has been 1.9%, significantly lower than the all-India average. Throughout the world, urbanization goes hand in hand with development and progress. West Bengal’s urbanization has not been fast enough and urbanization levels are less than 10% in districts like Birbhum, Koch Behar and Maldah. The 2001 Census also collected data on slums and 15.0% of India’s urban population lived in slums in 2001. The figure is 18.4% for West Bengal. Symptom No. 2 – The Average West Bengal Resident is Poor As a statement, this is undoubtedly true. If income growth doesn’t occur, per capita income is bound to be low, subject to whatever has been happening to the rate of population growth. In Transforming West Bengal – Changing the Agenda for an Agenda for Change; Bibek Debroy and Laveesh Bhandari 13
- 15. Indicus Analytics 2007-08, the per capita gross State domestic product (GSDP) was Rs 33,299 for India. And it was Rs 29,547 for West Bengal, giving West Bengal a rank of 18th among India’s 28 States in terms of per capita income. Given the base in the early 1960s, a rank of 18th isn’t something West Bengal should be proud of. Table 1: Per capita gross state domestic product (Rs.) States 2007-08 West Bengal 29,457 Tamil Nadu 35,301 Maharashtra 43,724 India 33,299 Source: CSO A point that is sometimes missed should be flagged, to reiterate what was said in Section 1 about disparities within West Bengal. Quite often, people talk about convergence and divergence across India’s States and debate whether disparities within States have increased after 1991. This may be an important issue, but often ignores the phenomenon of disparities within States. These too have increased after 1991 and it is not quite the case that all of West Bengal’s regions have grown equally fast. The map that follows indicates what has been happening to West Bengal’s regions between 1993 and 1999, that is, the decade of the 1990s. An index was constructed, based on consumption of motor spirit, diesel and cereals and credit disbursals and deposits. The regions shaded follow Transforming West Bengal – Changing the Agenda for an Agenda for Change ; Bibek Debroy and Laveesh Bhandari 14
- 16. Indicus Analytics the regions adopted by NSS (National Sample Survey). These variables, as opposed to others, were chosen, because data at the regional level are often difficult to obtain and the index based on these variables has a fairly good correlation with NSDP across States. The darker shades in the map are regions that have increased their shares after 1993, while the lighter shades in the map are regions that have seen declines in shares after 1993. The four regions for West Bengal are the Central, Eastern and Western plains and the Himalayan region. What is noticeable is the decline in the Central plains, which also happens to include Kolkata. But to return to the point about districts, West Bengal has not been able to eliminate disparity across districts, despite the Left Front’s continuous harping on equity and elimination of deprivation. Table 1 illustrates this divide for the indicator based on per capita income, rural and urban. This is estimated per capita income, not per capita expenditure. Can the Left Front leader who lives in Kolkata and frames policies imagine what it is like to live in rural Uttar Dinajpur, even if the cost of living is lower in the latter? Table 2: Per capita rural and urban income, 2006 District Per capita Urban income, Per capita Rural income, Rs Rs Bankura 32,342 14,182 Bardhaman 55,791 18,369 Birbhum 40,604 14,830 Dakshin Dinajpur 38,690 11,669 Darjeeling 46,756 16,155 Haora 38,662 19,592 Hugli 46,198 25,635 Jalpaiguri 32,530 14,440 Koch Behar 35,409 11,026 Kolkata 45,801 - Maldah 54,342 13,940 Medinipur 27,109 13,612 Murshidabad 33,872 15,361 Nadia 47,662 20,768 North 24 Parganas 41,992 18,301 Purulia 32,782 10,677 South 24 Parganas 34,643 15,832 Uttar Dinajpur 30,942 10,340 Source: Market Skyline of India, Indicus Analytics Symptom No.3 – West Bengal has Very High Levels of Poverty in Backward Districts West Bengal’s poverty comes across in other indicators too. Let’s divide India’s households into three income brackets – rich, middle and poor. Rich households are those who earn more than Rs 3 lakhs a year, middle households are those who earn between Rs 75,000 and 3 Transforming West Bengal – Changing the Agenda for an Agenda for Change; Bibek Debroy and Laveesh Bhandari 15
- 17. Indicus Analytics lakhs a year and poor households are those who earn less than Rs 75,000 a year. The numbers are estimated for 2006. For India, 10.1% of households were rich, 54.0% of households were middle and 35.9% were poor. But for West Bengal, 5.6% households were rich, 41.0% were middle and 53.4% were poor. Let’s forget about the rich for the moment, communists don’t like rich people any way. But the middle-income household (madhyabitta) is a perennial favourite of Bengalis. Since reforms, what has been happening throughout most of India is a pulling-up of the poor category into the middle-income league. That’s not true of West Bengal, a characteristic West Bengal shares with India’s backward States in Central and East India. The poor have remained poor, and this comes across in data on consumer expenditure, be it for FMCG products, consumer durables or services. One shouldn’t be misled by 77.4% of Kolkata’s households owning television sets in 2006 and TVs are no longer an item of elitist consumption. Only 14.7% of Medinipur’s households owned television sets. Source: Market Skyline of India, Indicus Analytics Let’s leave aside middle-income and move to the poor. The poverty line used by the Planning Commission uses a very basic minimum expenditure level required for subsistence. It is almost entirely based on a minimal level of food expenditure, with a tiny fraction thrown in for clothing. Nothing is included for other items of consumption. In 2004-05, 24.7% of West Bengal’s population was below this minimal poverty line. This is certainly better than the all-India average of 27.5% and is a considerable drop from the 63.4% in 1973-74. But if one takes away really poor States like undivided Bihar, undivided Uttar Pradesh, undivided Madhya Pradesh and Orissa, West Bengal’s performance looks pretty bad. Consider for instance, a comparison between Assam and West Bengal. In 1993-94, 40.9% of Assam’s population was below the poverty line, compared to West Bengal’s 35.7%. In 2004-05, 19.7% of Assam’s population was below the poverty line. West Bengal has failed to achieve what Assam, a State plagued by inadequate infrastructure, floods and violent agitations, has been able to accomplish. The two graphs that follow show trends in poverty declines in West Bengal over time and establish the point that West Bengal’s success in reducing rural poverty has been far less than one might tend to think. What improves West Bengal’s performance is the superior urban poverty figure. Transforming West Bengal – Changing the Agenda for an Agenda for Change ; Bibek Debroy and Laveesh Bhandari 16
- 18. Indicus Analytics Source: Planning Commission of India Imagined Disease No. 2 - Bengalis are Lazy Why is West Bengal poor? One possible answer might be that Bengalis don’t want to work. They may be plain lazy, or perhaps they may have too high dependents compared to other States. The percentage in the working-age population may be low. This is a doubtful explanation, since Bengalis seem to do perfectly well and exhibit enterprise as migrants in other States. In 2005, the male work participation rate for India was 51.6%, that is, 51.6% of the total male population consisted of workers. For West Bengal, the figure was 55.1%. Indeed, with the exception of Darjeeling, in each of West Bengal’s districts, the male work participation rate is higher than the all-India average. (Murshidabad is only marginally below, at the decimal point.) Certainly for males, the issue is not non-participation in economic activity, but the quality of that participation and the quality of that work. It is a little different for females. The all-India female work participation rate is 27.3%, but is 22.3% in West Bengal. At 9.2%, it is particularly low in Haora. Except at very low levels of income, there is a positive correlation between female work participation rates and per capita income. Therefore, women in West Bengal need to participate more in economic activity. But is this opting out voluntary or involuntary? Is it socio-cultural or is there more to it? Transforming West Bengal – Changing the Agenda for an Agenda for Change; Bibek Debroy and Laveesh Bhandari 17
- 19. Indicus Analytics Symptom No. 4 – Employment Growth in West Bengal has Stagnated There is more to it. The opting out is certainly involuntary. Where are the jobs, outside of course, the business of working for the party? Let’s ignore crop production and plantation. Those are often subsistence-level and low in productivity, a point we will return to in a moment. Outside of these two segments, the Economic Censuses of 1998 and 2005 tell us what has happened to employment in enterprises, both rural and urban. For all of India, the annual average growth in employment in enterprises was 2.5%. But for West Bengal, it was 0.9%. It looks even worse if one separates out the rural from the urban. Excluding crop production and plantation, the all-India annual average growth in employment in rural enterprises was 3.3%. However, for West Bengal, it was 1.7%, significantly lower than the average. And for urban enterprises, the all-India annual average growth in employment was 2.4%, compared to 0.0% for West Bengal. There are no jobs. Table 3: Average annual growth in employment in enterprises other than crop production and plantation (1998-2005) (%) States Rural Urban Total West Bengal 1.7 0.0 0.9 Maharashtra 3.3 0.9 1.8 Tamil Nadu 5.4 3.8 4.6 All India state average 3.3 2.4 2.5 Source: Economic Census, 2005, provisional figures Symptom No. 5 – The Quality of Employment in West Bengal is Appalling It is not just that there are no jobs. The quality of employment, self-employment or otherwise, has been far inferior to what a State like West Bengal deserves. Consider the following. Everywhere, development results in a reduction in the share of the primary sector and an increase in the shares of the secondary and tertiary sectors. Between 2000-01 and 2005- 06, the primary sector contributed 29.1% to West Bengal’s GSDP, compared to an all-India figure of 24.5%. The secondary sector contributed 17.6% to West Bengal’s GSDP, compared to an all-India figure of 23.5%. West Bengal’s growth has been driven by agriculture, not manufacturing or industry. Not only is this low productivity subsistence-level agriculture, this growth has been tapering off. The growth in agriculture since 2000-01 has been lower than in the 1990s. Transforming West Bengal – Changing the Agenda for an Agenda for Change ; Bibek Debroy and Laveesh Bhandari 18
- 20. Indicus Analytics Source: CSO Many people are probably not even aware of how bad the situation is. The Left Front government will say that the number of factories in West Bengal has increased from 4,311 in 1961 to 13,465 in 2005. It will forget to mention that the number of factories in Tamil Nadu has increased from 3,677 in 1961 to 28,326 in 2005. Tamil Nadu was behind West Bengal in 1961, but is ahead of West Bengal now. Good quality work occurs in registered manufacturing, not in unregistered and small-scale units. In 2005-06, the share of the registered sector in manufacturing GSDP was 68.1% in all of India. But for West Bengal, it was only 49.4%. The Left Front government will say that the average daily number of workers employed in registered working factories was 718,388 in 1961 and increased to 893,500 in 2005. It will forget to say that during the same period, the average daily number of workers employed in registered working factories increased from 286,176 to 1,238,152 in Tamil Nadu. Again, Tamil Nadu has left West Bengal far behind. The Left Front government will forget to say that manufacturing enterprises in West Bengal are unregistered, small-scale, own-account and predominantly rural, all characteristic of low quality employment. The Left Front government won’t mention that 1.2% of SSI (small-scale industry) units in India were sick in 2007 and that the figure was 3.1% for West Bengal. It may mention that bank credit to industry has grown at an annual rate of 17% between 2001 and 2006, but will conveniently forget to mention that the rate for all-India has been 24.5%. Where is the industry one will extend credit to? The Left Front government will forget to mention that it has driven private sector industry out of West Bengal. That has happened because of several reasons, but the industrial relations climate is certainly one. In 2005, the all-India average number of strikes per State was 11 and the all-India average number of lockouts per State was 19. The respective figures were 26 and 182 for West Bengal. For the same year, the all-India State average for the number of man-days lost to industrial disputes was 1,348,409. But the figure was 19,216,222 for West Bengal. How many people know that 497,000 people registered themselves with employment exchanges in West Bengal in 2006 and that only 15,100 obtained jobs through employment exchanges? How many people know that the backlog of those registered with employment exchanges is 7.72 million, the highest in the country? Transforming West Bengal – Changing the Agenda for an Agenda for Change; Bibek Debroy and Laveesh Bhandari 19
- 21. Indicus Analytics Source: Statistical Abstracts of West Bengal, Tamil Nadu, and Maharashtra (various years) One conclusion cannot be subject to dispute. Industry has been driven out. How many business groups continue to have their corporate headquarters or substantial operations in Kolkata or West Bengal? Philips, Shaw Wallace, the Ispat Group and ICI India have moved out. There are no jobs and the quality of employment is low. The Census divides workers into main workers and marginal workers. Main workers are those who have worked for more than 6 months in the preceding one year and marginal workers are those who have worked for less than 6 months in the preceding one year. Clearly, any region prospers if the share of marginal workers drops. In the 2001 Census, the number of marginal workers as a ratio of main workers was 28.5% for India. How is it that no one seems to be shocked when the figure is 74.7% for Purulia? Table 4: Marginal workers as a ratio of main workers (%) States 2001 West Bengal 27.9 Maharashtra 17.9 Tamil Nadu 17.4 India 28.5 Source: Census of India, 2001 The Left Front government may create a huge song and dance about services and IT (information technology) and about the IT policy announced in 2000 (revised in 2003), the special incentive scheme announced in 2001 and the ITeS (IT-enabled services) policy announced in 2003. But the Left Front government will not mention that the service sector growth has been below the all-India average since 2000-01. Between 2000-01 and 2006-07, the all-India average rate of growth of service sector GSDP was 8.9%. But it was 6.8% for West Bengal, the service sector growth in West Bengal having declined from what it was in the second half of the 1990s. Nor will the Left Front government mention that the service sector growth has been driven by trade, hotels and restaurants, not by the high-profile IT and ITeS. Take for instance, the software technology park (STP) scheme. For 2005-06, the all-India State average of exports per STP was Rs 7,176 crores. But it was only Rs 2,500 crores for West Bengal. An e-readiness assessment report for States is brought out Transforming West Bengal – Changing the Agenda for an Agenda for Change ; Bibek Debroy and Laveesh Bhandari 20
- 22. Indicus Analytics by the Department of Information Technology and NCAER (National Council of Applied Economic Research). West Bengal doesn’t perform well on this index at all. West Bengal is an expectant, together with Pondicherry and Madhya Pradesh and is not like leaders (Andhra Pradesh, Tamil Nadu, Karnataka, Chandigarh, Maharashtra) or aspiring leaders (Punjab, Delhi, Haryana, Goa, Gujarat, Kerala). These e-readiness indices haven’t been around for a long time. But since they have been around, that is, the last 4 years, West Bengal’s relative position hasn’t improved much. An expectant shouldn’t remain an expectant indefinitely. Sooner or later, it should being to deliver. Source: National Council of Applied Economic Research Disease No.1 – The Left Front Hasn’t Created a Facilitating Business Environment We come back to the question of what a government is expected to do. While a government is expected to do other things too, and we will come back to this point, it is expected to create a facilitating business environment for private enterprise to flourish and thrive. Be it for industry or be it for services, there has been low growth and low employment and the quality of employment generated has been inferior. On this count of a government’s mandate, the Left Front government has failed. Table 5: Time and cost to start a business in India State City 2006 Time (days) Cost (% of GNI per capita) West Bengal Kolkata 51 48.5 Maharashtra Mumbai 35 73.7 Tamil Nadu Chennai 41 44.0 Andhra Pradesh Hyderabad 43 44.0 Source: World Bank (http://siteresources.worldbank.org/SOUTHASIAEXT/ Resources/Publications/ 448813- 1171300070514/india.pdf) Transforming West Bengal – Changing the Agenda for an Agenda for Change; Bibek Debroy and Laveesh Bhandari 21
- 23. Indicus Analytics Table 6: Sub-national rankings on the ease of doing business in India, 2006 Rank Cities 1 Hyderabad 2 Bangalore 3 Jaipur 4 Chennai 5 Bhubaneswar 6 Lucknow 7 Chandigarh 8 New Delhi 9 Patna 10 Ranchi 11 Mumbai 12 Kolkata Source: Same as in Table 5. Disease No. 2 – The Left Front Hasn’t Been Able to Ensure Law and Order Moving up the hierarchy, the next element in any government’s mandate is the preservation of law and order. This isn’t typically an area where the private sector is expected to step in, especially on the criminal side. In 1961, the strength of the civil police force in West Bengal was 34,567 and this number increased to 55,863 in 2007. But in 1961, the strength of the civil police force in Tamil Nadu was 29,145 and the number increased to 84,183 in 2007. Law and order is a State subject. So one should legitimately deduce that Tamil Nadu believes law and order to be more serious as an issue than West Bengal does. And just so that we have the benchmarks for comparison right, in 2007, Maharashtra had civilian police force strength of 166,155. The number of policemen (or women) per 100,000 population is 126 in India. However, in West Bengal, the figure is only 94. Cognizable crimes are serious offences, in the sense that police can arrest people without warrants. Within cognizable crimes, rape, kidnapping and murder are fairly serious crimes. And one would like to think that West Bengal is relatively safe, as compared to the badlands in India’s Hindi heartland, depicted all so often in Bollywood films. But that’s not true. For all of India, in 2006, murders accounted for 0.6% of all cognizable crimes. The figure was 1.9% for West Bengal. For all of India, in 2006, kidnappings accounted for 0.5% of all cognizable crimes. The figure was 1.8% for West Bengal. For all of India, in 2006, rape and molestation accounted for 1.1% of all cognizable crimes. The figure was 4.7% for West Bengal. These numbers seem unreal until we relate them to something tangible. Your property is stolen and you go to the police to get the property recovered. In 2005, 72.2% of stolen property was recovered in Tamil Nadu. But the figure was 22.0% in West Bengal. Not enough policemen. More crimes, and since these crime figures are official ones, they don’t include crimes where people don’t bother to report because the official machinery has broken down. Transforming West Bengal – Changing the Agenda for an Agenda for Change ; Bibek Debroy and Laveesh Bhandari 22
- 24. Indicus Analytics Together with the huge backlogs in the judicial system, we neither have law. Nor do we have order. And citizens certainly don’t have justice. Perhaps the party machinery is sometimes used to fill the vacuum. But that’s not what a government is supposed to do, is it? Source: National Crime Records Bureau, Ministry of Home Affairs, Government of India Disease No.3 – The Left Front Government Hasn’t Been Able to Provide Physical Infrastructure After law and order, in the list of things one wants a government to do, one should move on to physical infrastructure. That’s not an area where the market can be expected to step in, at least not in every element of physical infrastructure. And even when the private sector can be expected to step in, it may be necessary for the government to subsidize or fund the poor. Lest we forget, sometimes the money for this expenditure comes from the Centre and all a State government has to do is to implement the scheme. How does West Bengal compare on the three most critical elements of physical infrastructure – roads, electricity and water (and sanitation)? If these three ingredients of physical infrastructure are provided, development almost follows immediately. In 2002, the last year for which we have data from the Ministry of Shipping, Road Transport and Highways, 24.2% of roads in Tamil Nadu were unsurfaced and 21.6% of roads in Maharashtra were unsurfaced. The other roads were surfaced, that is, of better quality. But in West Bengal, 46.2% of roads were unsurfaced. There may be a perception that Tamil Nadu and Maharashtra are relatively advanced States. In 2002, the road density (road length per 1000 sq km) was 1037 in West Bengal and 1522 in Orissa. The tragedy is that since 2001, there has been a centrally sponsored scheme known as the Pradhan Mantri Gram Sadak Yojana (PMGSY). This is a 100% centrally sponsored scheme, meaning that the entire money comes from the Centre. Despite this, in 2008, 56.2% of West Bengal’s habitations were not connected by road. Only 43.7% of Jharkhand’s habitations were not connected by road. In a district like Nadia, only 11.9% of habitations are connected to pucca roads. It isn’t enough to have the money. A government must know how to spend it efficiently. It shouldn’t be surprising that motor vehicle penetration in West Bengal is low and this doesn’t mean so-called elitist personal cars alone. Transforming West Bengal – Changing the Agenda for an Agenda for Change; Bibek Debroy and Laveesh Bhandari 23
- 25. Indicus Analytics Source: PMGSY, Ministry of Rural Development Electricity indicators are no better. 100% of Tamil Nadu and Maharashtra’s villages are electrified. The figure is 78% for West Bengal. A village being electrified doesn’t mean that every household in that village has electricity. In 2006, only 48% of West Bengal’s households had electricity connections and hold your breath, the figure was 16.9% in Koch Behar. Electricity consumption is correlated with development and is a fairly good indicator of progress. In 1970-71, West Bengal’s per capita consumption of electricity (KwH) was 107 and Tamil Nadu’s was 125. These are roughly comparable figures. In 2004-05, West Bengal’s per capita consumption increased to 248, which incidentally, is lower than that in Jharkhand (402) and Orissa (395). But Tamil Nadu’s increased to 713. What is the point of bragging about a power surplus State? Where is the demand? Source: Statistical Abstract of India, Central Electricity Authority (2004-05) By the way, Orissa has 21 post offices per lakh population. West Bengal has 11. At an all-India level, there are 8 bank branches per lakh population. West Bengal has 5. In 2005-06, only 27.9% of West Bengal’s households had access to safe drinking water. The figure was 78.4% for Maharashtra and 84.2% for Tamil Nadu. In the 2001 Census, only 2.3% of rural Uttar Dinajpur’s households had water closets/latrines. Transforming West Bengal – Changing the Agenda for an Agenda for Change ; Bibek Debroy and Laveesh Bhandari 24
- 26. Indicus Analytics Table 7: Percentage of households having access to safe drinking water States 2005-06 West Bengal 27.9 Maharashtra 78.4 Tamil Nadu 84.2 Source: National Family Health Survey III, 2005-06 If a government cannot provide the core government functions of roads, electricity and water, what good is that government? Is it surprising that people wish to migrate out of West Bengal, if they can? Disease No. 4 – The Left Front Government Hasn’t Been Able to Provide Social Infrastructure But perhaps one has got it wrong. A communist government’s priorities may be social sectors like education and health. Once education and health have been taken care of, the government’s attention will turn to physical infrastructure, after another 40 years. Let’s take education first. In 1961, the literacy rates were 35% in West Bengal, 35% in Maharashtra and 36% in Tamil Nadu, almost identical. In 2001, they were 69% in West Bengal, 77% in Maharashtra and 73% in Tamil Nadu. Uttar Dinajpur had a literacy rate of 47.9%. For the 6-14 year age-bracket, in 2005-06, West Bengal education department’s expenditure per child was Rs 1279. Assam spent Rs 3421. In 2005-06, in primary school (Classes I-V), the drop-out rate in West Bengal was 38.7%, compared to Maharashtra’s 5.1%. The numbers are no different for higher classes and West Bengal has higher drop-out rates than Orissa. The completion rates in West Bengal are lower than in Orissa. In primary schools, West Bengal has 57 students per teacher, while Tamil Nadu has 34. The pupil/teacher in Assam is twice as good as in West Bengal. In higher education, in 2004-05, West Bengal had 3 teachers per 100 students. Assam had 7 teachers. Nor should one forget what these teachers do in schools or institutions of higher education. They may work for the party, but they don’t teach, particularly in the government ones. Source: Census of India Transforming West Bengal – Changing the Agenda for an Agenda for Change; Bibek Debroy and Laveesh Bhandari 25
- 27. Indicus Analytics The All India Survey of Education Report (2007), published by Pratham Foundation, found that more than 25% of all elementary school students in rural India depend on private tuitions, in addition to attending regular schools. But this is an even more widespread phenomenon in West Bengal, where 80% of middle-school children in rural West Bengal resort to private tuition. This is not because the quality of government school education is inferior, because the Survey found that the percentage of children who opt for private tuition is even higher among those who attend private schools, though it is difficult to control for factors like income differences. Nor is this a rural phenomenon. The survey by Pratichi Trust in 2006 has data on government-run primary schools and depending on the type of private school, the percentage of children who resort to private tutors is between 50% and 73%. Pratichi Trust estimated that even among poor children, the average annual incremental expenditure because of private tuition was around Rs 1000. Private tuition is an endemic part of the West Bengal education system. This can partly be dated to 1983, when in an attempt to ensure equity, the West Bengal government abolished teaching of English in primary schools for the government education system. This triggered demand for private tuitions, even among the poor. This raises a few points, some obvious, others a little less so. First, West Bengal doesn’t perform well on education indicators, be they outcome (skills evaluation-related) or input-related (single teacher schools, physical infrastructure etc.), points that have already been made. The West Bengal government has also been indicted by CAG for tardy implementation of the Sarva Shiksha Abhiyan (SSA). Second, and this is a less obvious point, the West Bengal government encourages this de facto privatization of school education and has no incentive to improve the government school delivery structure, because private tuition offers an employment opportunity to educated unemployed, who have limited access to shrinking government jobs. But is this an objective that is good for West Bengal’s citizens, irrespective of what it does for the welfare of CPM cadres? The story is no less horrendous for health. In 1974, the infant mortality rate (per thousand live births) was 51 in West Bengal, 57 in Maharashtra and 106 in Tamil Nadu. Both Maharashtra and Tamil Nadu were worse off, especially the latter. In 2004, the figures were 40 in West Bengal, 36 in Maharashtra and 41 in Tamil Nadu. Compare the drop in Tamil Nadu with that in West Bengal. In 2005-06, 64% of children (12-35 months) were fully immunized in West Bengal, compared to 81% in Tamil Nadu. The immunization rate was 27.9% in Murshidabad. In 2005-06, 46% of births in West Bengal were assisted by trained personnel, compared to 93% in Tamil Nadu. 79.4% of deliveries in Uttar Dinajpur still take place in home. In 1961, West Bengal had 29,067 hospital beds and Maharashtra had 19,090. In 2005, West Bengal had 59,110 hospital beds and Maharashtra had 96,762. In 1975, West Bengal had 21,019 allopathic medical practitioners and Tamil Nadu had 24,338, not that far apart. In 2005, West Bengal had 48,637 medical practitioners and Tamil Nadu had 70,434, quite far apart. In several health- related indicators, West Bengal’s performance is worse than that of Bangladesh. If this alone is the criterion, with the Left Front government in power, Bengalis will soon begin to migrate to Bangladesh. Transforming West Bengal – Changing the Agenda for an Agenda for Change ; Bibek Debroy and Laveesh Bhandari 26
- 28. Indicus Analytics Source: Statistical Abstracts of West Bengal, Tamil Nadu and Maharashtra, various years (data from Registrar General of India) Whatever be the Left Front government’s priorities, education and health are not on the agenda. Disease No. 5 – The Left Front Government Has Mismanaged the State’s Finances The numbers given above are telling. The numbers on the mismanagement of the State’s finances are no less telling. But before that, let us have some quotes and findings from the CAG’s Report for the year ended 31st March 2007, to illustrate how bad the situation is. First, let us focus on the “commercial” report, the one that relates to performance of government companies and statutory corporations. On finalization of accounts, “28 working Government companies and eight working Statutory corporations were in arrears for periods ranging from one to six years as on 30 September 2007. The accounts of 17 non-working Government companies were in arrears for periods ranging from one to 23 years as on 30 September 2007.” Can anything be more bizarre than not having accounts for 23 years? These are companies and statutory corporations that run losses and are therefore funded by the government and indirectly by the tax-payer. “38 working PSUs incurred aggregate loss of Rs 691.48 crore… Of the loss incurring working Government companies, 29 companies had accumulated losses aggregating Rs 2,165.06 crore, which exceeded their aggregate paid-up capital of Rs 242.68 crore…. As such, the Government may either improve the performance of these 49 PSUs or consider their closure.” Losses apart, what have these PSUs been up to? Here is the West Bengal Housing Infrastructure Development Corporation on the Rajarhat New Town Project. “Even after eight years’ of existence, the Company had yet to acquire and develop 3,075 hectares of land in three phases due to non-preparation of detailed project reports, annual work plans and absence of coordination between land acquisition and development, leading to time and cost overrun of 48 months and Rs 78.76 crore respectively. The Company had not fixed fair and reasonable Transforming West Bengal – Changing the Agenda for an Agenda for Change; Bibek Debroy and Laveesh Bhandari 27
- 29. Indicus Analytics market prices for land to be acquired under the Land Acquisition Act, 1894, leading to short payment of Rs 50.34 crore as compensation to land owners and also making excess payment of Rs 67.58 crore to the land owners of three mouzas1. Rehabilitation of project oustees was not adequate, as only 17 per cent of identified Project Affected Families, whose dwelling units had been acquired, were rehabilitated.” Let’s move on to rural electrification by the West Bengal Rural Energy Development Corporation Limited and the West Bengal State Electricity Board. “Under RGGVY (Rajiv Gandhi Gramin Vidyutikaran Yojana (RGGVY) scheme, WBSEB and four Central Public Sector Undertakings were to electrify 4,283 mouzas to provide electricity connections to 1.46 lakh RHHs (rural households) by December 2006. Till March 2007, 1,322 mouzas were electrified and only 24 per cent of targeted RHHs were covered, due to inept implementation by CPSUs as well as non-identification of RHHs below the poverty line.” The West Bengal Small Industries Development Corporation is no better. “Integrated Infrastructure Development Scheme launched (March 1994) by GOI was not implemented even after lapse of 13 years due to management’s inertia to identify the projects and lack of follow up.” On the much-discussed small car project, here is the CAG on the West Bengal Industrial Development Corporation Limited. “The Company incurred excess expenditure of Rs 2.99 crore towards payment of avoidable interest of Rs 1.44 crore and delayed ‘consent awards’ of Rs 1.55 crore. Further, it subsidized Tata Motors Limited by Rs 76.11 crore on leasing of 645.67 acres of land at Singur for ninety years.” “West Bengal State Electricity Board sustained loss of Rs 15 crore on account of wrong classification of consumers, excess benefit and rebates to consumers arising from erroneous computation of concession and incorrect computation of load factor.” This is only a sample and there is much more in the same vein. The blood begins to boil at the havoc that is wrought with tax-payers’ money. The Left Front government should be thankful that many more people don’t read CAG reports. Let’s move on to the “civil” CAG report for the period ending 31st March 2006 to illustrate how money available is not used, or used inefficiently. For the Sarva Shiksha Abhiyan, “As of April 2005, 8.97 lakh children continued to remain out of school in the State… Infrastructural deficiencies in the schools were apparent as 19 per cent of the schools of the State had no drinking water facility and 41 per cent were without toilet facility…. The State also failed to get Rs 522.48 crore as grants from GOI during 2001-2005 due to low spending. No monitoring and evaluation system at any level was in existence.” On food, “Targeted Public Distribution System (TPDS) and Antyoday Anna Yojana (AAY), introduced for providing food grains to Below Poverty Line (BPL) families at specially subsidized prices and for reducing hunger among the poorest segment of population failed as the Food and Supplies Department could achieve only 49 per cent of target of procurement of rice for BPL population during 2001- 2006 mainly due to delayed release of funds to the procurement agencies. Sixty eight per cent of the total allocation of food grains was not lifted by the Government for distribution through Fair Price Shops (FPS) during 2001-2006. As 70 per cent farmers of West Bengal were not aware of Minimum Support Price (MSP) instances of deprival of farmers due to non-payment of MSP by rice millers was noticed. GOI subsidy of Rs 64.66 crore could not These three mouzas were Chakpachuria, Pathraghata and Recjoani and in some cases, the acquisition rate was higher 1 than the prevailing rate by 174%. Unfortunately, the CAG report doesn’t tell us who the owners were. Transforming West Bengal – Changing the Agenda for an Agenda for Change ; Bibek Debroy and Laveesh Bhandari 28
- 30. Indicus Analytics be claimed due to non-preparation of proforma accounts of TPDS since 2001-2002. Besides, deficient fund management resulted in unauthorized payment of levy collection charges to rice millers, irregular interest payments to procurement agencies, excess payment of milling charges, etc. No survey was made in the modified rationing areas prior to April 2004 for identification of bogus ration cards and 27.85 lakh bogus cards were cancelled during April 2004 to February 2006.” There is much more in the same vein. Surely, someone should be accountable. Even for something like NREGA (National Rural Employment Guarantee Act), West Bengal’s performance is pathetic compared to States like Rajasthan and Andhra Pradesh. So how can one expect anything but the following? Between 2003-04 and 2005-06, West Bengal raised 0.5% as own non-tax revenue as a share of GSDP. The figure was 2.9% for Jharkhand. For the same period, West Bengal raised 4.7% as tax revenue. The figure was 7.0% for Orissa. As share of GSDP, the gross fiscal deficit was 5.4% in West Bengal and 2.5% in Assam. The revenue deficit was 4.0% in West Bengal and on an average, India’s States had a surplus of 0.4%. West Bengal spent 4.8% of GSDP on social sectors, Bihar spent 12.8%. West Bengal spent 7.6% of GSDP on developmental expenditure. Assam spent 17.4%. West Bengal spent 0.7% of GSDP on capital expenditure that increases future productive potential of the State. Jharkhand spent 4.4%. 48.3% of West Bengal’s revenue receipts went towards repayment of interest on past borrowings. Assam only had to spend 15.1%. Table 8: Capital expenditure to GSDP ratio (%), 2006-07 Description Capital Outlay/GSDP West Bengal 0.8 Maharashtra 2.1 Tamil Nadu 2.6 All India state average 7.1 Source: RBI, State Finances-A study of budgets, 2007-08 This is not a government by the people, or for the people. It is not a democracy. It is a kleistocracy and on occasion, an aristocracy for the nomenklatura of the party. Right Diagnosis of Disease Quite often, one confuses symptoms with diseases. What we have just described as the five key diseases are perhaps not diseases at all. They too are symptoms. The key disease is somewhere else. It is the Left Front itself. The Left Front government is like gangrene. It cannot be cured. It has to be excised out. Transforming West Bengal – Changing the Agenda for an Agenda for Change; Bibek Debroy and Laveesh Bhandari 29
- 31. Indicus Analytics Section 3 The Agenda for Change It is easy and tempting for any new government to make big promises. Almost by their very nature, big promises are vague and imprecise. They are motherhood statements. It is far better to have an innate belief in the enterprise, hard work and intelligence of West Bengal’s citizens. Instead of big and vague promises, it is far better to focus on a specific agenda for action. Such precise promises are not only more transparent, they enable governments to be more accountable. People can hold the government to these promises. Promise 1: Governance Governance has collapsed in West Bengal. The first step is to convince West Bengal’s citizens that there is a government. There is law and order. There is an administration that is not run by the party. There is an efficient dispute resolution system. Sub-Promise 1 – The new Police Act will be passed within a year. Sub-Promise 2 – There will be fast track disposal of the 14,017 under-trials languishing in West Bengal’s prisons. Fast track courts, people’s courts, family/women’s courts, lok- Sub-Promise 3 – adalats, shift systems in courts, mobile courts, nyaya panchayats and gram nyayalayas will be energized to clear the backlog in courts within 5 years. Sub-Promise 4 – An Administrative Reforms Commission will be set up, with a short time-frame for submitting a report. Sub-Promise 5 – There will be an immediate Action Taken Report (ATR) on recommendations of earlier State Finance Commissions (SFCs). Unless there are strong reasons to the contrary, recommendations of SFCs will be mandatory. Sub-Promise 6 – District planning will be introduced and all funds, functions and functionaries (not just functions) devolved to panchayats and urban local bodies. The central sector and centrally sponsored schemes will accordingly be revamped and Gram Sabha audits of NREGA will become mandatory. Sub-Promise 7 – The national multi-purpose identity card will be introduced on crash basis and also used for delivery of subsidized and non- subsidized public services. Transforming West Bengal – Changing the Agenda for an Agenda for Change ; Bibek Debroy and Laveesh Bhandari 30
- 32. Indicus Analytics Promise 2: Land Land is a key input and development requires more efficient and better-productivity use of land, including that in agriculture. Sub-Promise 8 – Krishi Vigyan Kendras, Agricultural Technology Management Agencies and farmers’ organizations will be integrated through a district/block/village level agricultural development strategy. Sub-Promise 9 – The APMC Act will be amended to allow direct marketing, contract farming and markets in private and cooperative sectors. Sub-Promise 10 – Registration and mutation services will be integrated and cadastral maps and revenue records also integrated. Land records will then be computerized, based on the records of the last 50 years. Citizen services based on land records (caste, income, domicile) will also be integrated into this system. Sub-Promise 11 – PESA (Panchayat Extension to Scheduled Areas Act) will be made applicable to every village where a majority of the population consists of STs. Sub-Promise 12 – Home-stead garden plots (10-15 cents) will be given to all rural landless families. Sub-Promise 13 – With caveats to prevent abuse, agricultural tenancy will be legalized. Sub-Promise 14 – The policy on land acquisition, rehabilitation and resettlement will become transparent and there will be no acquisition without a social impact assessment. After survey/settlement and recording of land titles and mutations, there will be an on-line registry of farmers, their land status and a land bank. The land-lease market will also feed into this. Sub-Promise 15 – The Rajiv Gandhi Grameen Vidyutikaran Yojana will be expanded to cover energization of pump-sets. Sub-Promise 16 – Water Users’ Associations will be formed in every village. Sub-Promise 17 – When sanctioning a new irrigation project, it will be mandatory that micro-irrigation should be implemented in at least 10% of the command area. Transforming West Bengal – Changing the Agenda for an Agenda for Change; Bibek Debroy and Laveesh Bhandari 31
- 33. Indicus Analytics Promise 3: Labour Other than land, labour is a key input and West Bengal’s strength lies in its human resources. However, the tapping of this potential requires improved physical and social infrastructure outcomes. Sub-Promise 18 – The targets and time-lines of the Bharat Nirman programme will be rigidly adhered to. A white paper will be prepared on why West Bengal is lagging in attaining these targets and on progress towards the MDGs and the SDGs (SAARC Development Goals). Sub-Promise 19 – Private sector participation will be invited for construction and maintenance of State highways and major district roads. A standard contract will be evolved, even if this involves the State PWD. A West Bengal State Road Development Fund will be created, using market committee funds and vehicle fees, combined with possible borrowings from NABARD. PMGSY implementation will be improved. Sub-Promise 20 – The performance of the State’s road transport undertakings will be improved. Commercial fares and motor vehicle-related taxes will be rationalized. Staff and services will be outsourced and the private sector will be allowed regulated entry in the provision of passenger transport services. Sub-Promise 21 – New berths will be created in Kolkata and Haldia through the PPP mode. The Port Trusts will be corporatised. Sub-Promise 22 – WBSEB will be restructured and corporatised, unbundling transmission, generation and distribution. SERC recomm- endations will become mandatory. The State government will provided the 75% funds required for APDRP (Accelerated Power Development and Reforms Programme). Sub-Promise 23 – The JNURM (Jawaharlal Nehru National Urban Renewal Mission) will be used to allow private sector participation in urban water supply and sanitation and dismantle the public sector monopoly, with an appropriate regulatory structure in place. Property taxes, stamp duties and user charges will be re-examined. Drainage fees, parking fees, hoarding fees, vacant land taxes and development impact fees will be imposed to augment municipal revenue. Municipal bodies that are in a position to do so will be allowed to issue tax-free bonds. Transforming West Bengal – Changing the Agenda for an Agenda for Change ; Bibek Debroy and Laveesh Bhandari 32
- 34. Indicus Analytics Sub-Promise 24 – E-governance will be mandatorily introduced in all cities that have a population of more than 1 lakh. A Metropolitan Development Plan will be prepared for each city, based on plans prepared by municipalities. The provisions of the 74th Constitution Amendment Act will be implemented. Sub-Promise 25 – Surplus urban land will be identified and efficiently used to rehabilitate the slum population. Sub-Promise 26 – The targets and guidelines of the SSA will be rigidly adhered to. Under the mid-day meal scheme, health cards will be issued to all children. A State-level eligibility test will be introduced for teachers so that decentralized recruitment can take place. The entry of private schools (aided and unaided) will be liberalized. Private sector entry will also be liberalized in higher education. Sub-Promise 27 – Vocational education will be revamped by handing over industrial training institutes to the private sector on PPP basis. The employment exchanges will also be handed over to private sector management. Sub-Promise 28 – Village Health and Sanitation Committees, Accredited Social Health Activists, Primary Health Centres and specialists in Community Health Centres will be ensured in every village/ district, integrating panchayats and civil society into the process. Health services (like immunization) will be spliced with the mid- day meal scheme. Public-private partnerships will be encouraged and community-based health insurance will be introduced. The State Medical Council will switch to a system where registration is periodical and has to be renewed, unlike the present permanent system. Private sector entry will be encouraged in curative health- care and a voucher system introduced for BPL households. Promise 4: Capital With governance, land and labour reforms in place, there is not much that has to be done for capital and industry. West Bengal’s advantages will ensure that capital moves in, without special fiscal incentives, and that capital flight is reversed. Informal unorganized enterprises will become formal and organized. Subsistence self-employment will become productive wage employment. And the rural worker will move to higher income-earning urban pursuits. Having said this, some reforms are indeed necessary. Sub-Promise 29 – The transaction costs associated with the registration system will be reduced, to create an incentive system for registration. This will Transforming West Bengal – Changing the Agenda for an Agenda for Change; Bibek Debroy and Laveesh Bhandari 33
- 35. Indicus Analytics also be part of the mandate of the Administrative Reforms Commission. Sub-Promise 30 – Micro-finance will be encouraged, for instance, through energization of self-help groups. In Conclusion These 30 reforms are more than enough. In the United States, people have said that they can. They can bring about change. It is no different for West Bengal’s citizens. West Bengal’s citizens deserve a better government and with that new government in place, can bring about change. In 5 years, West Bengal can become a completely different State. One that will not be stuck in India’s middle, but will be right at the top. One that people don’t migrate away from, but one that people want to migrate into. West Bengal can become a State that one will be proud to live in, provided the political environment changes. Transforming West Bengal – Changing the Agenda for an Agenda for Change ; Bibek Debroy and Laveesh Bhandari 34