Download to read offline
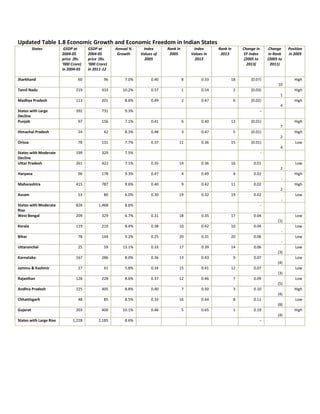

The document shows economic growth and changes in economic freedom index values for Indian states between 2004-05 and 2011-12. It groups the states into four categories: states with large decline, moderate decline, moderate rise, and large rise in their economic freedom index values. Gujarat had the largest rise in economic freedom index, increasing from 0.46 in 2005 to 0.65 in 2013, while Jharkhand and Punjab had the largest declines falling by 0.07 and 0.01 respectively over the same period.


