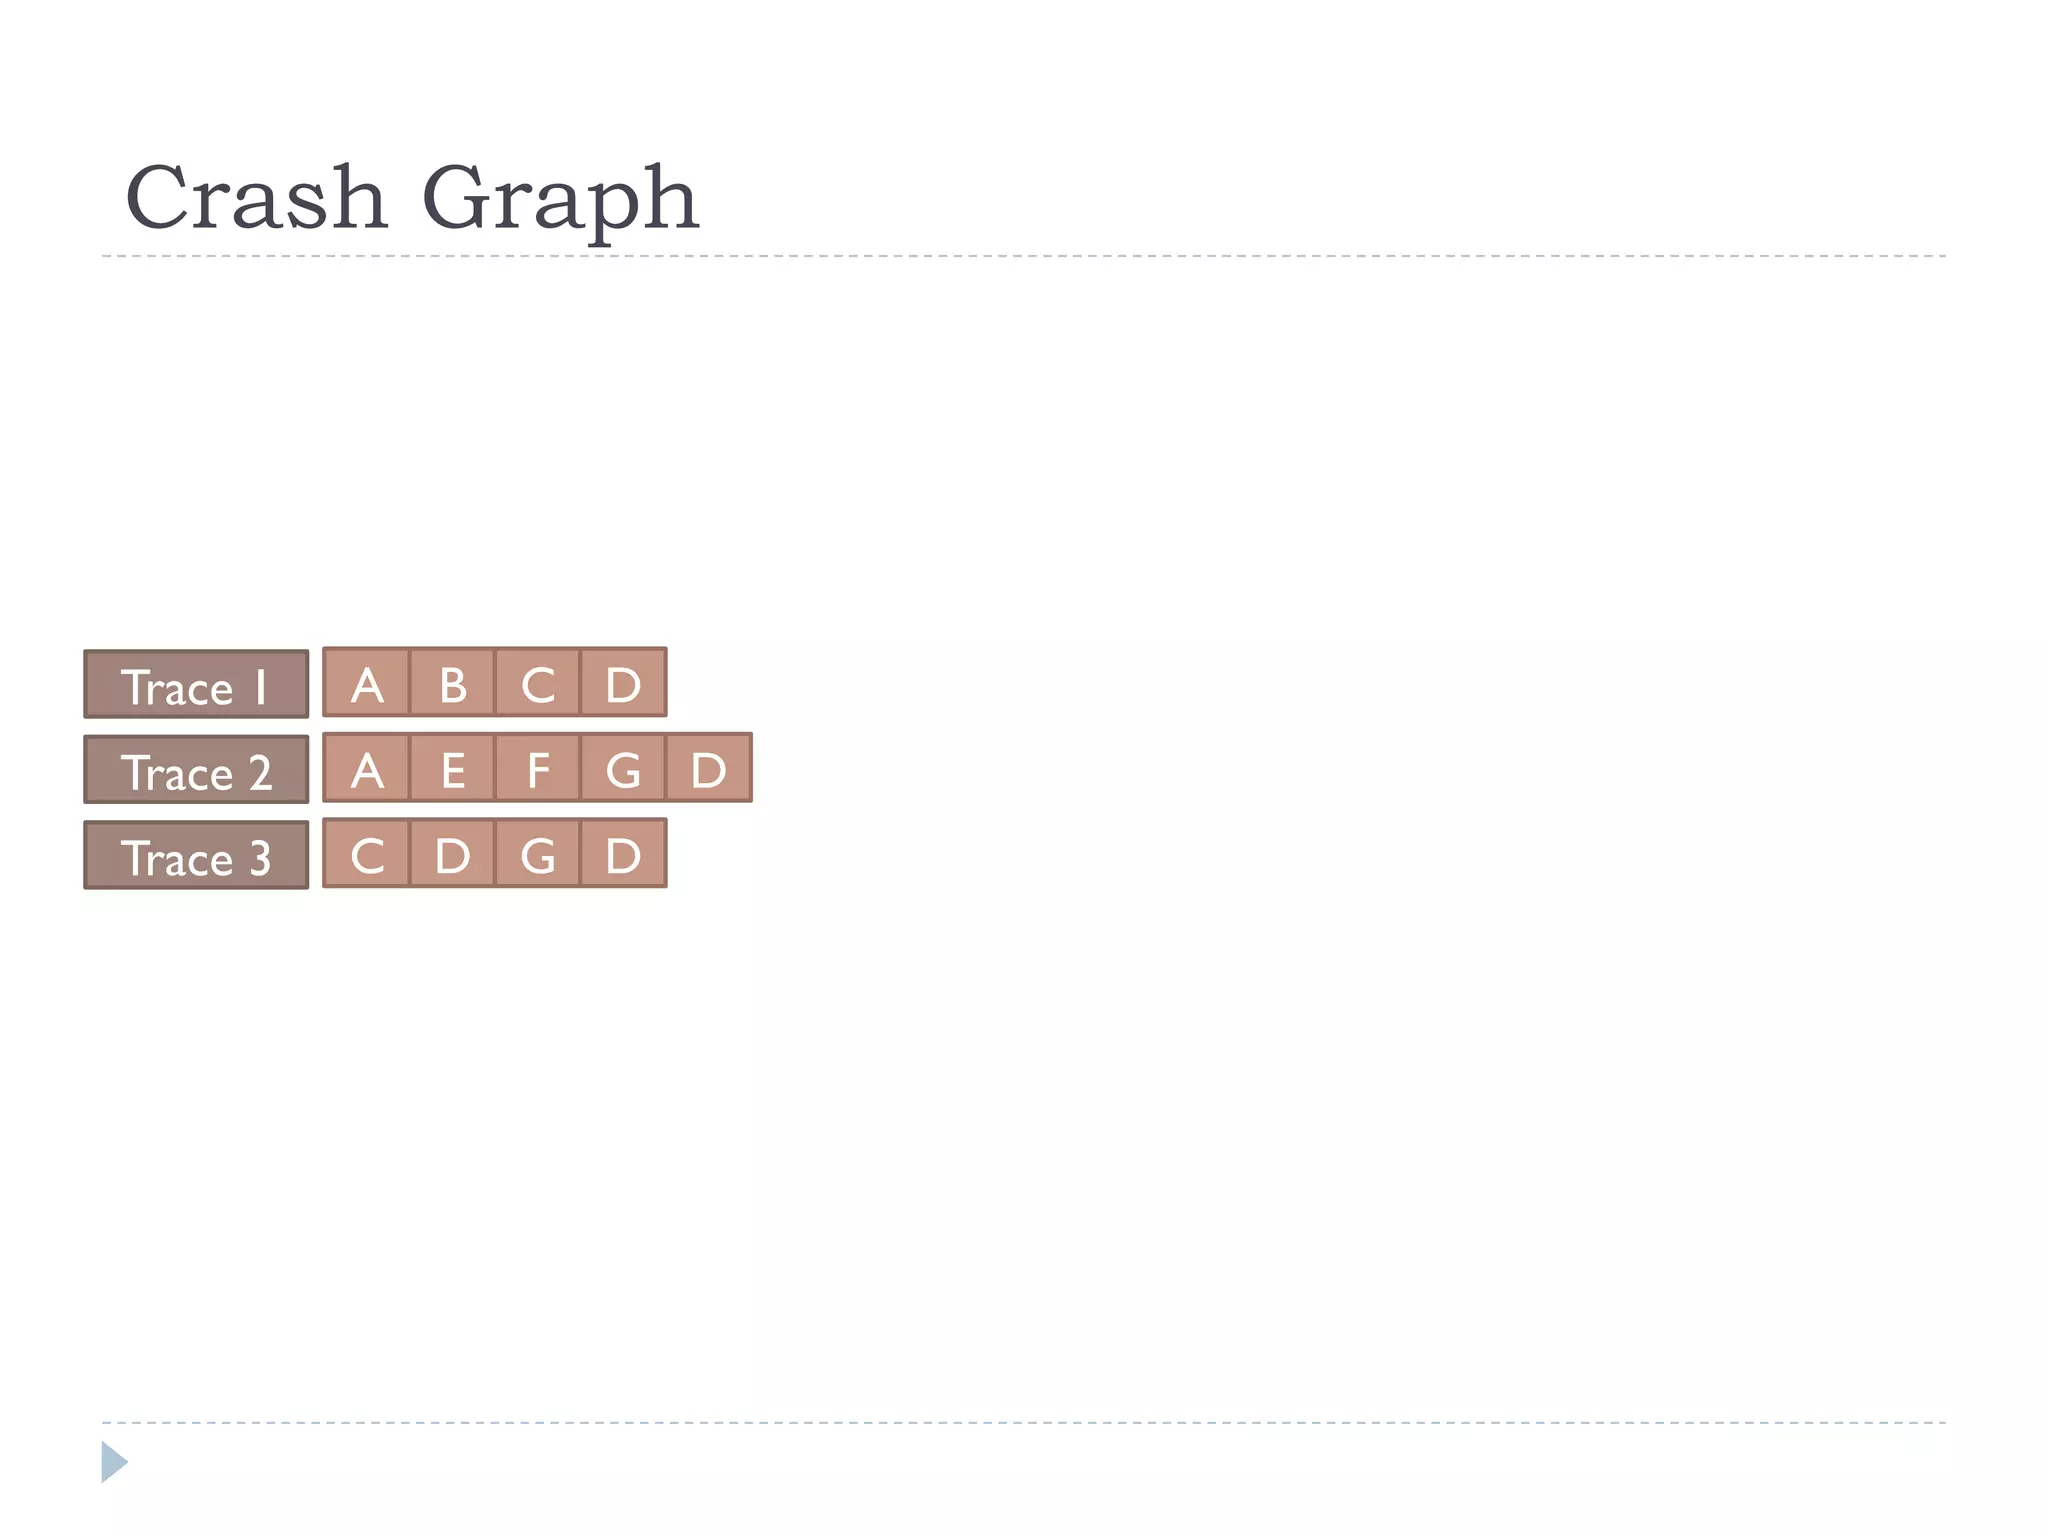
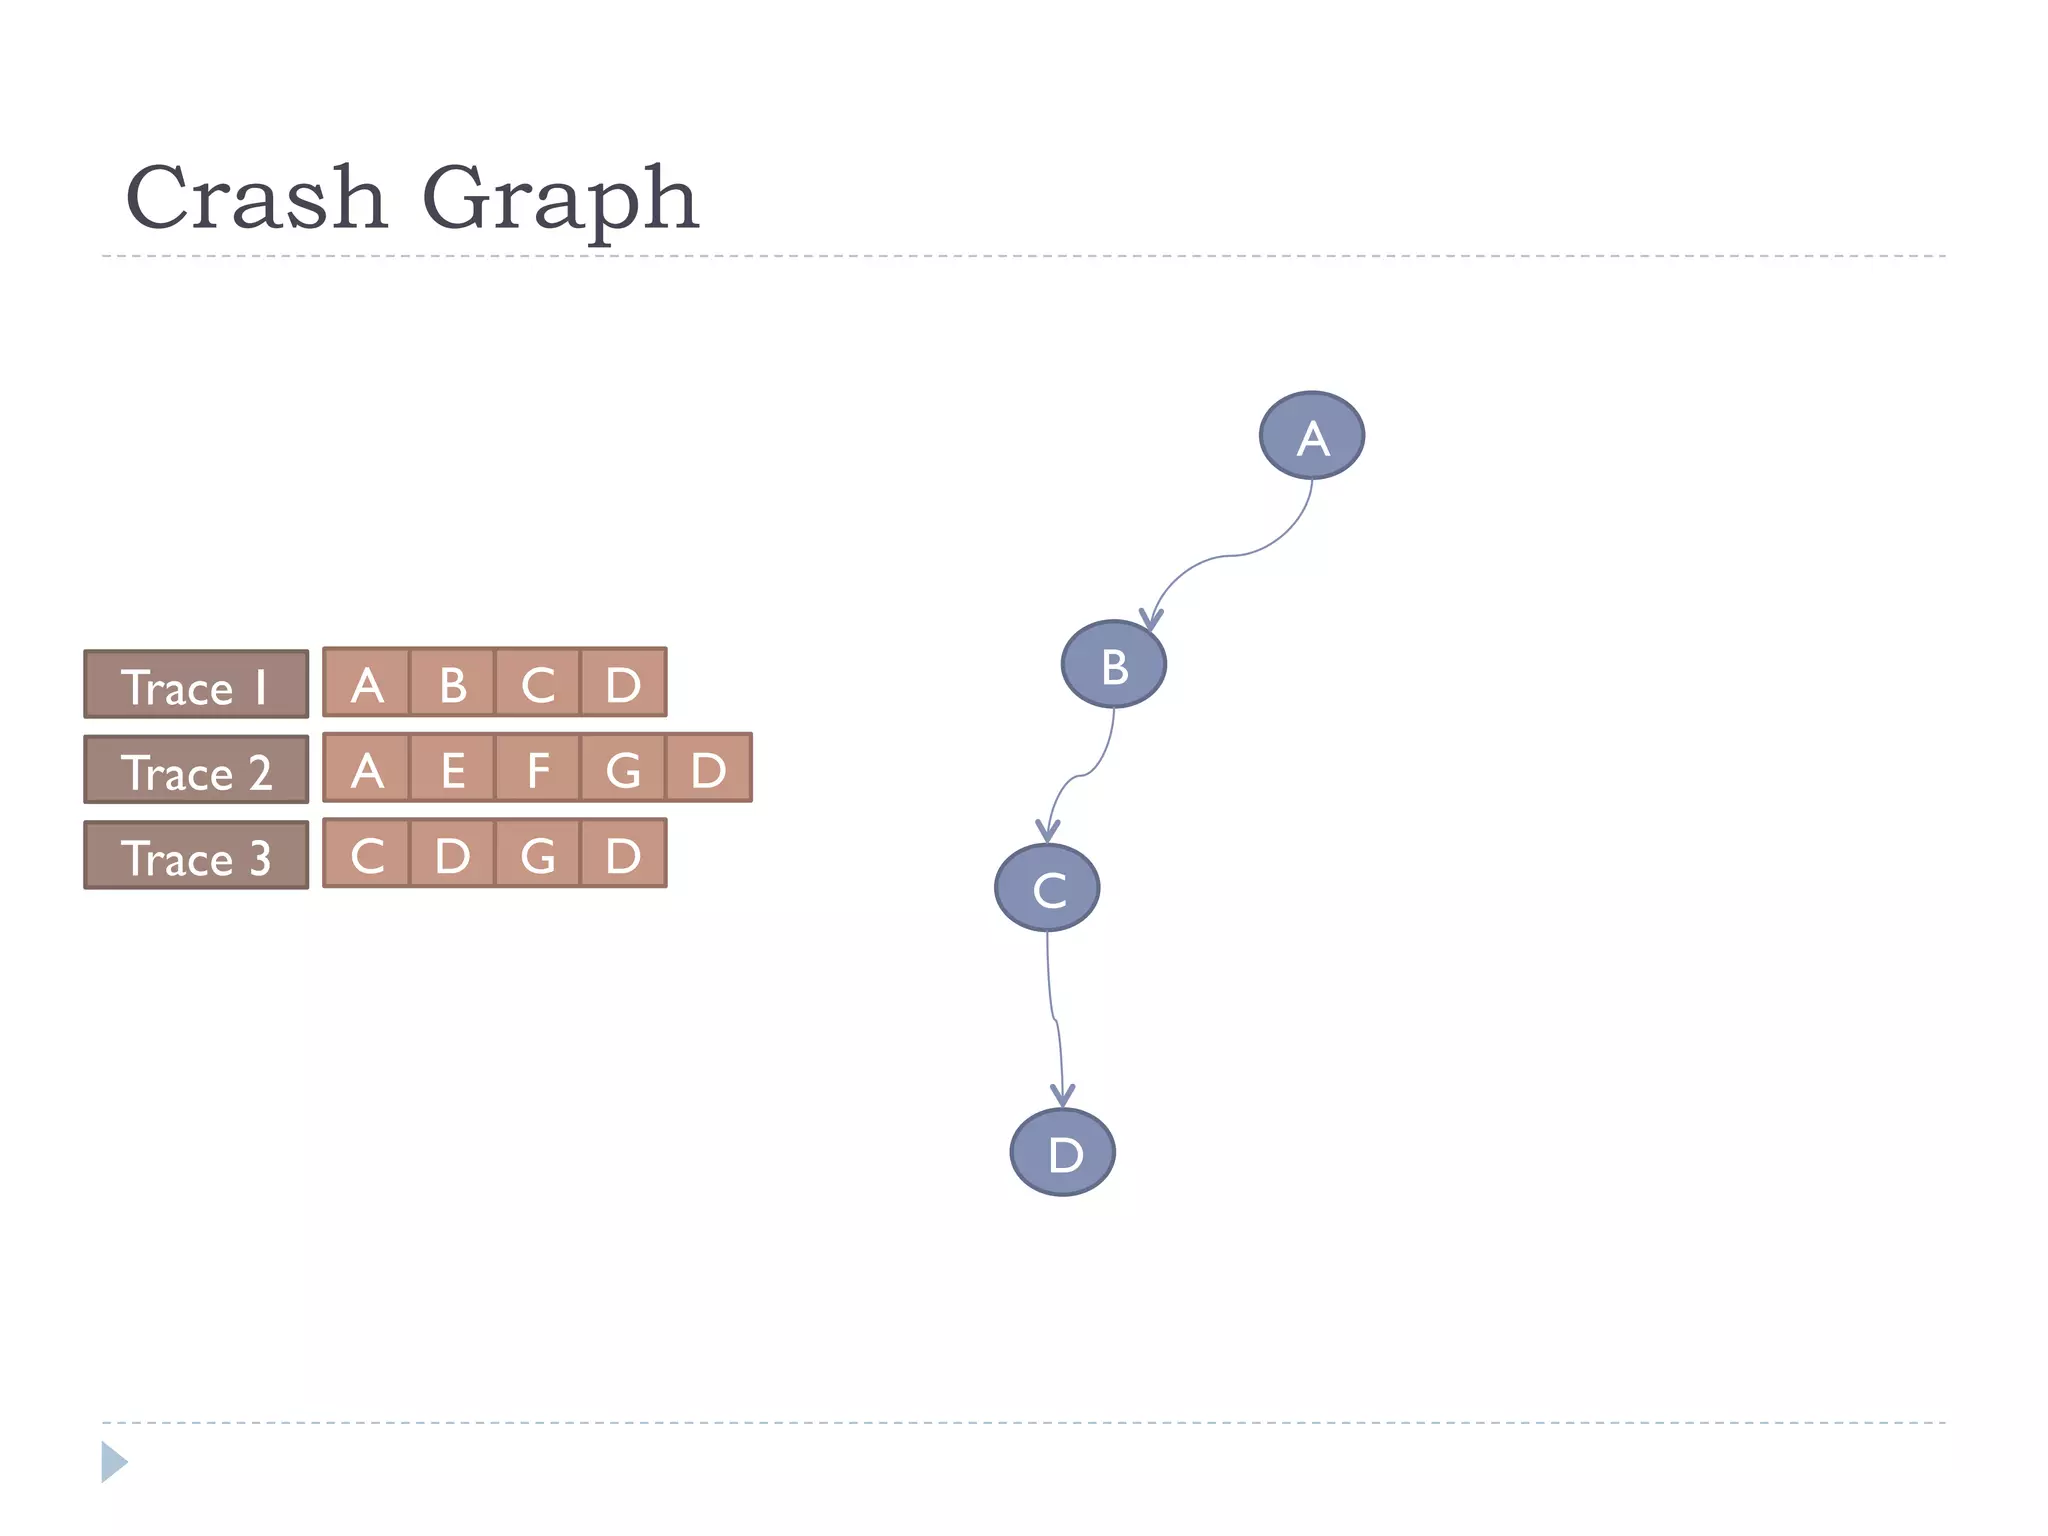
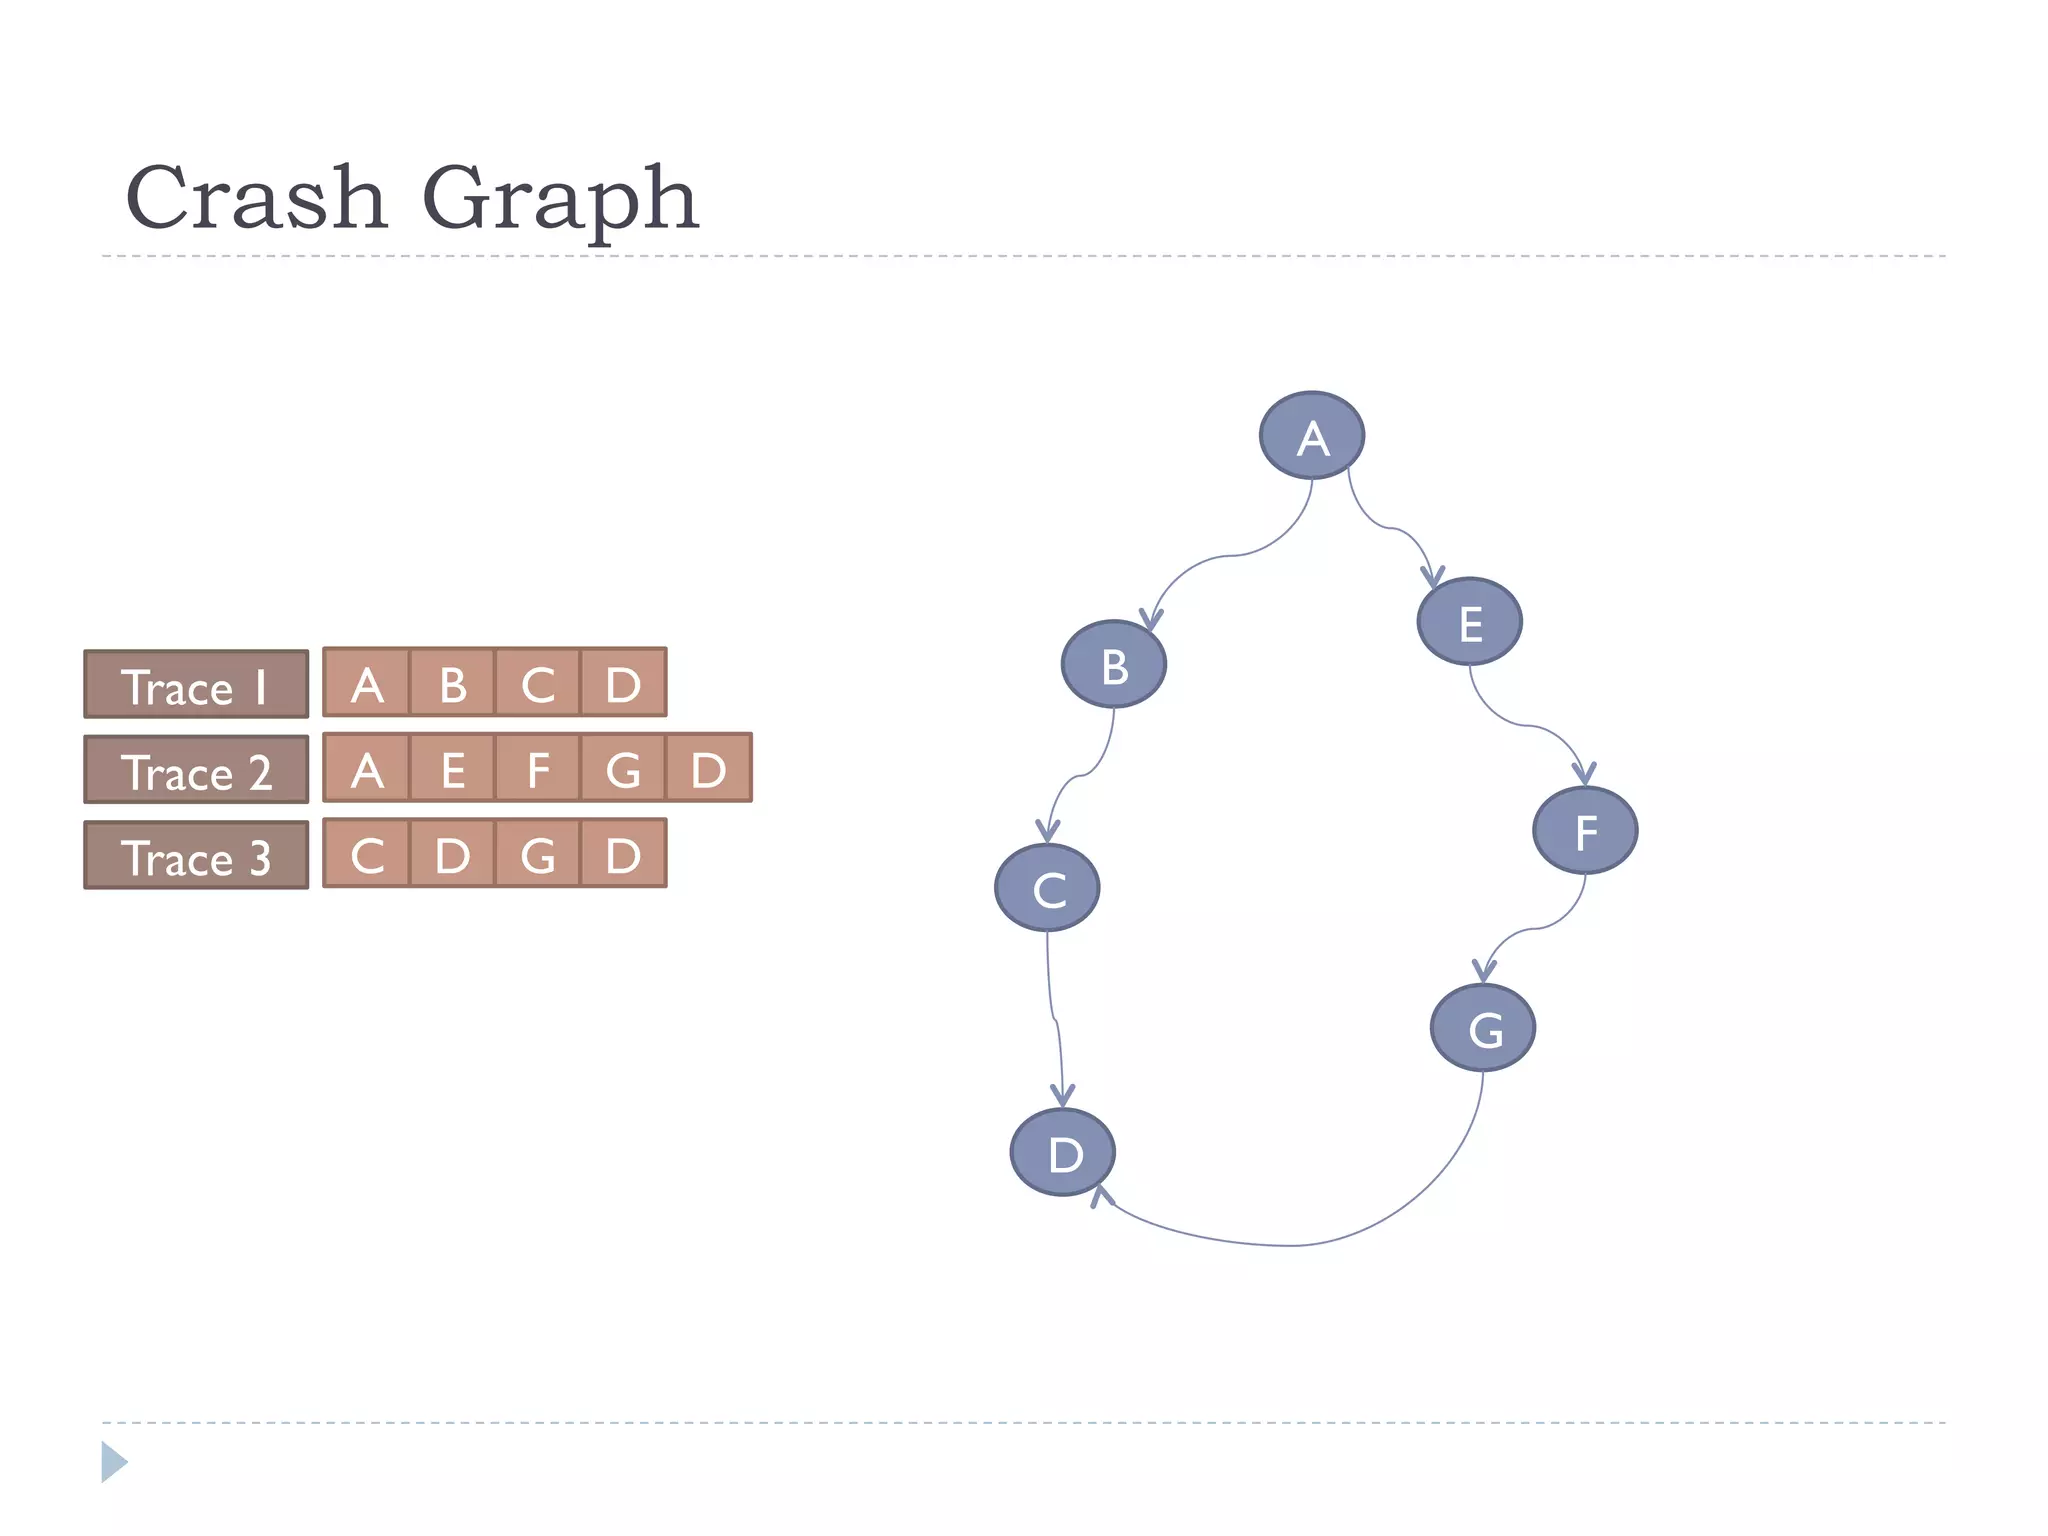
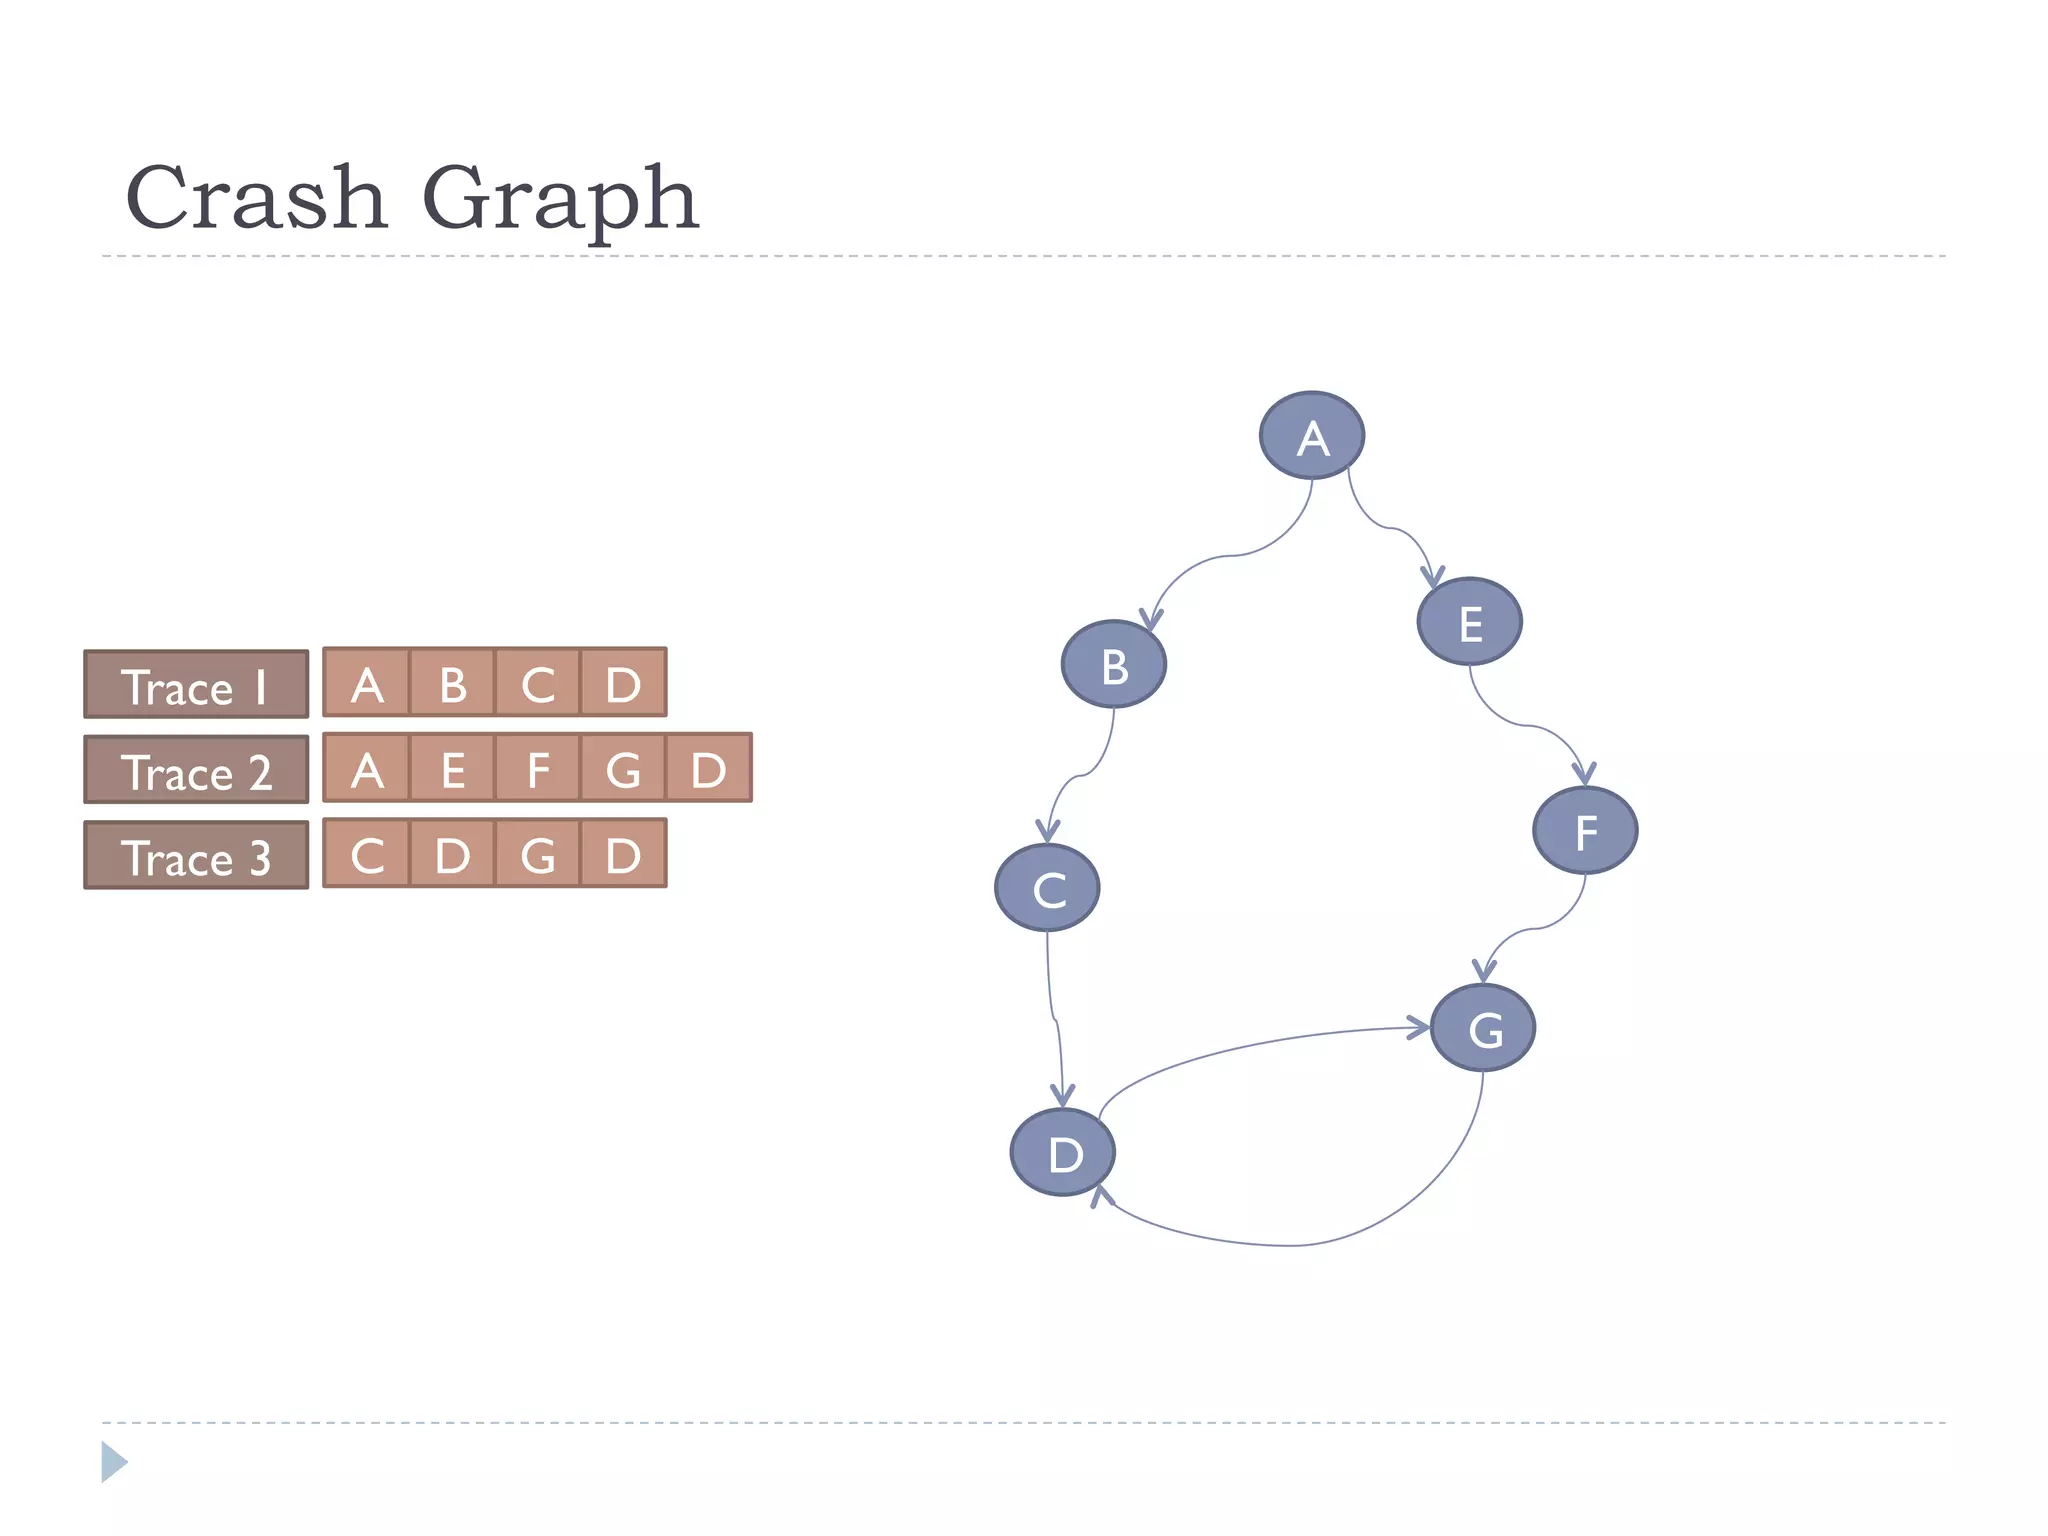
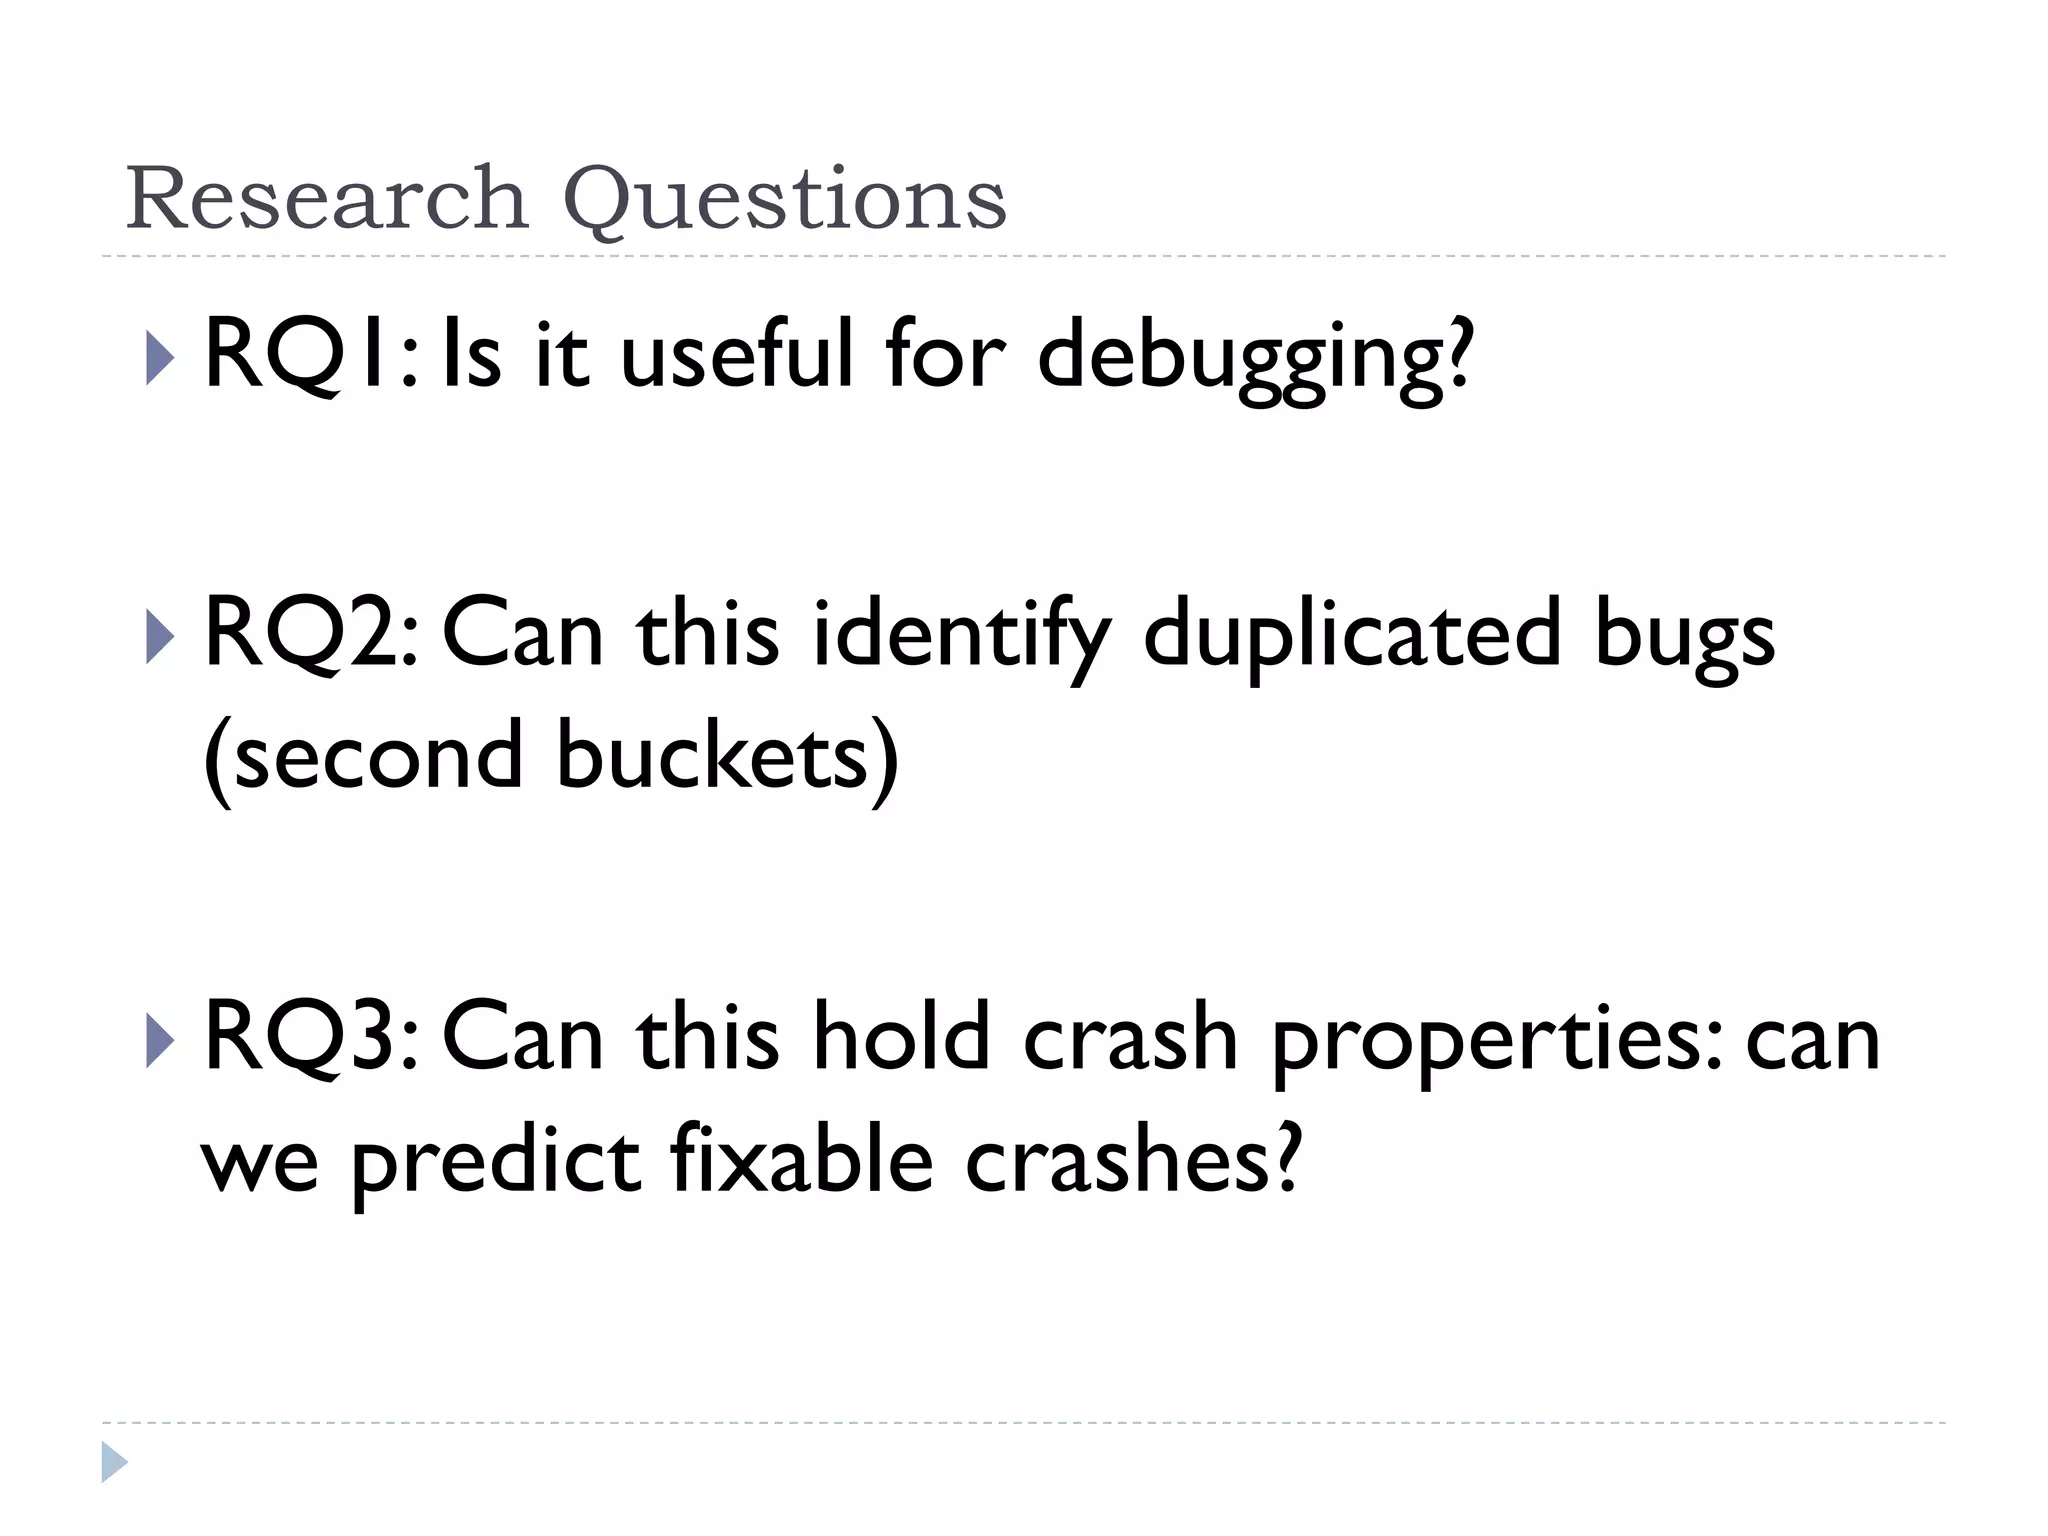
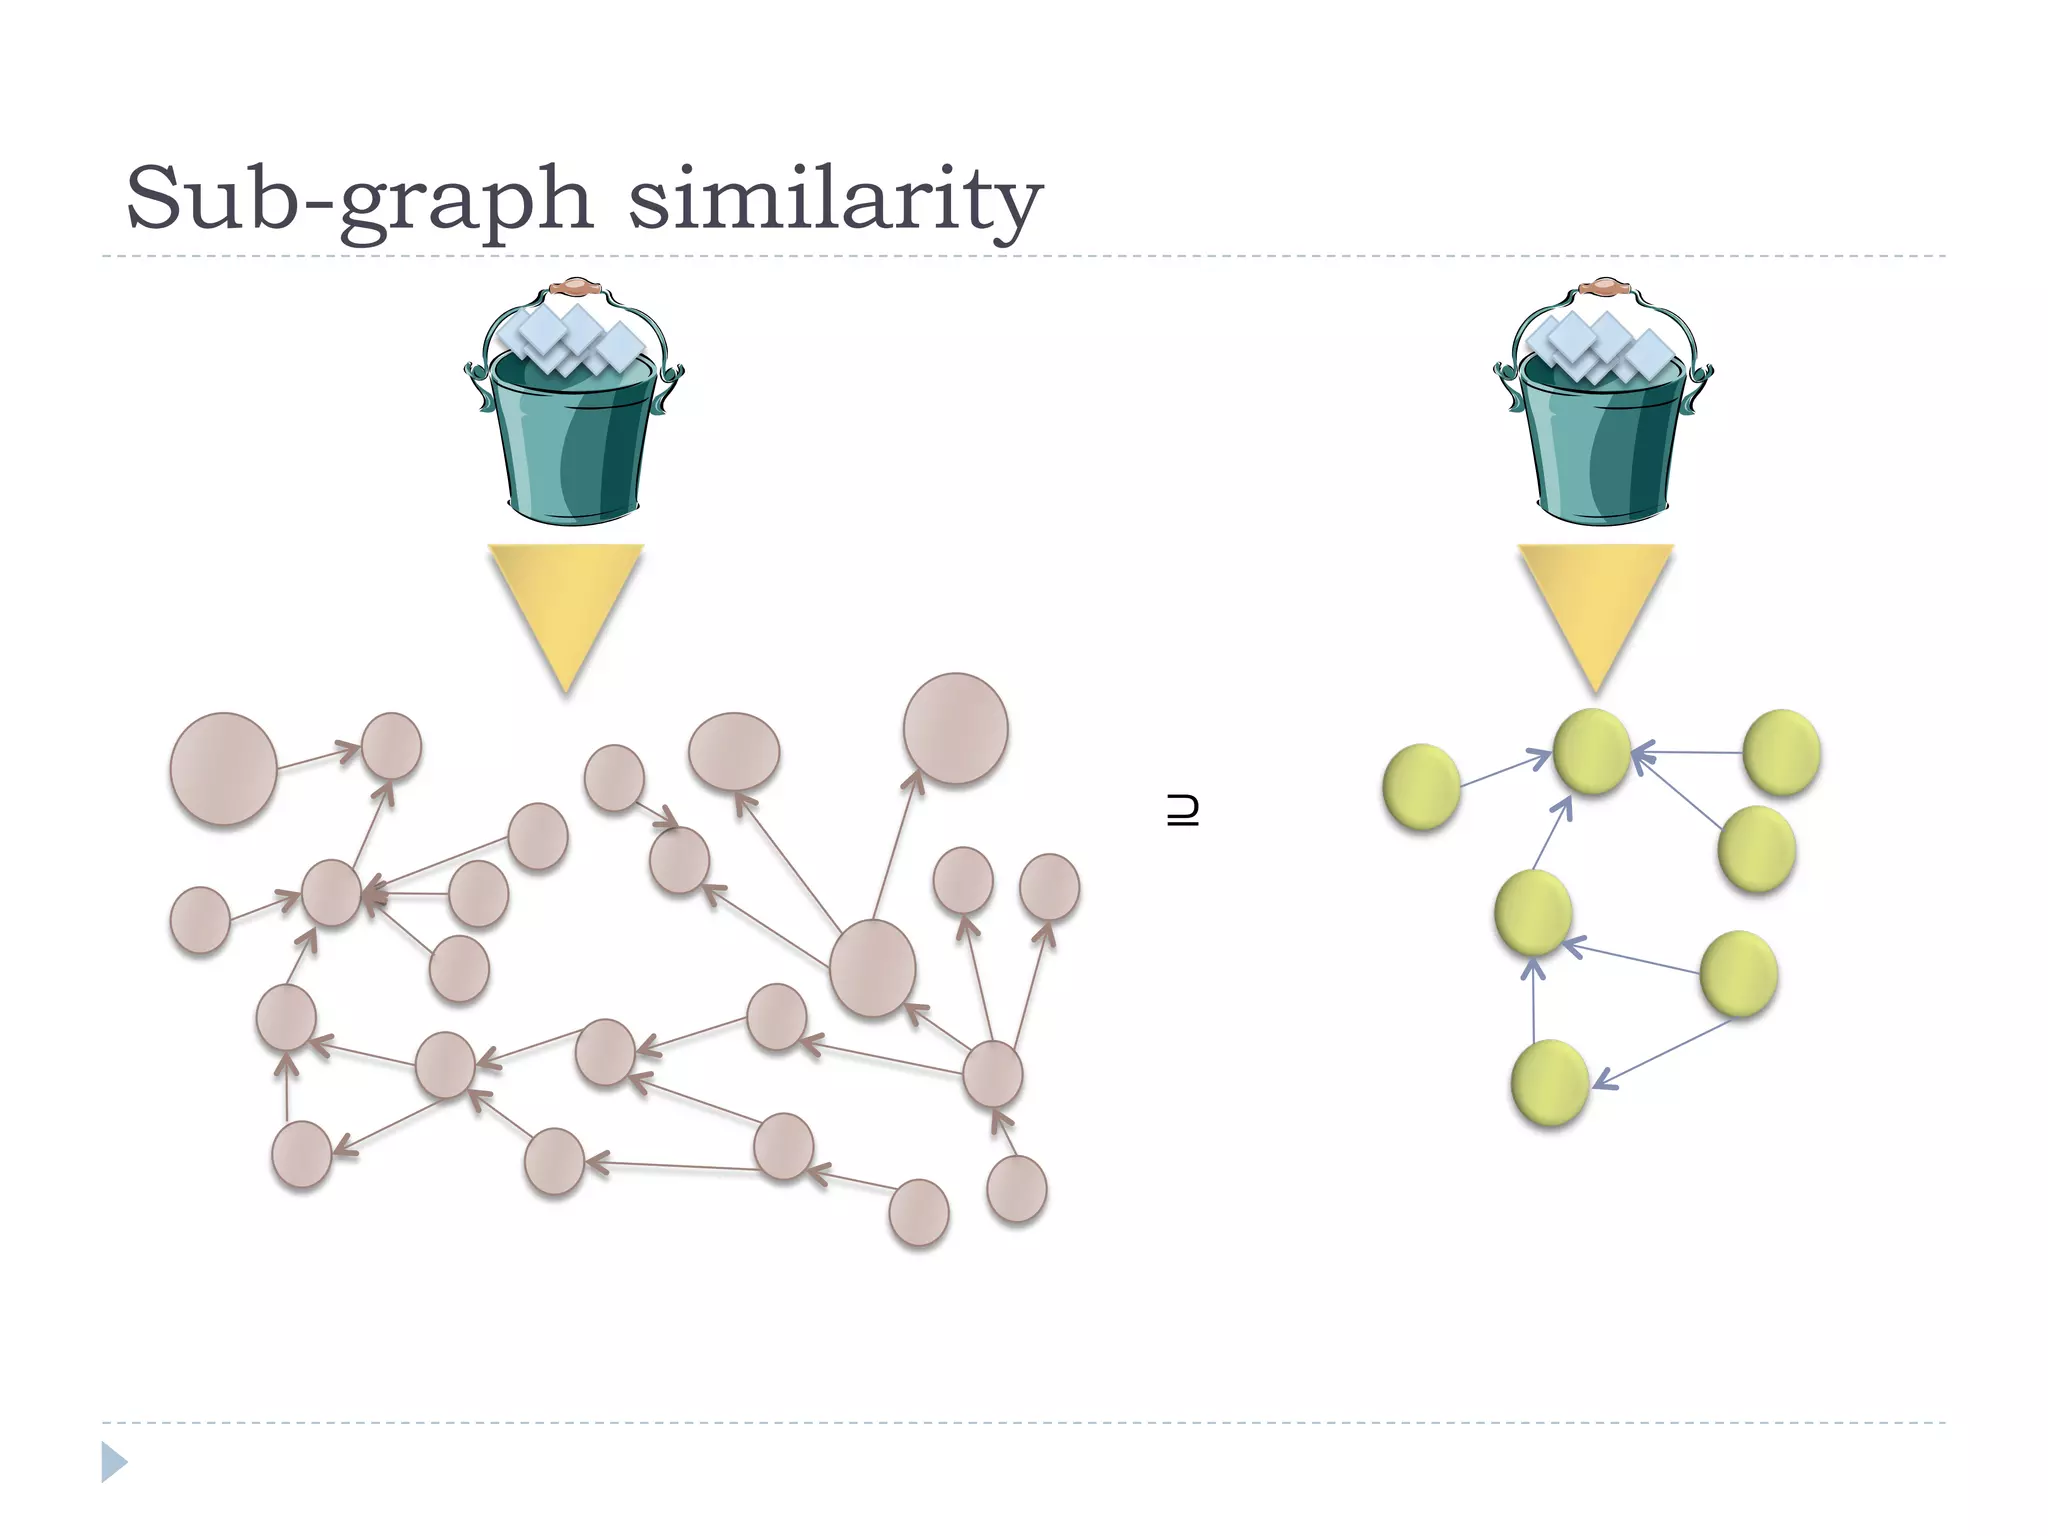
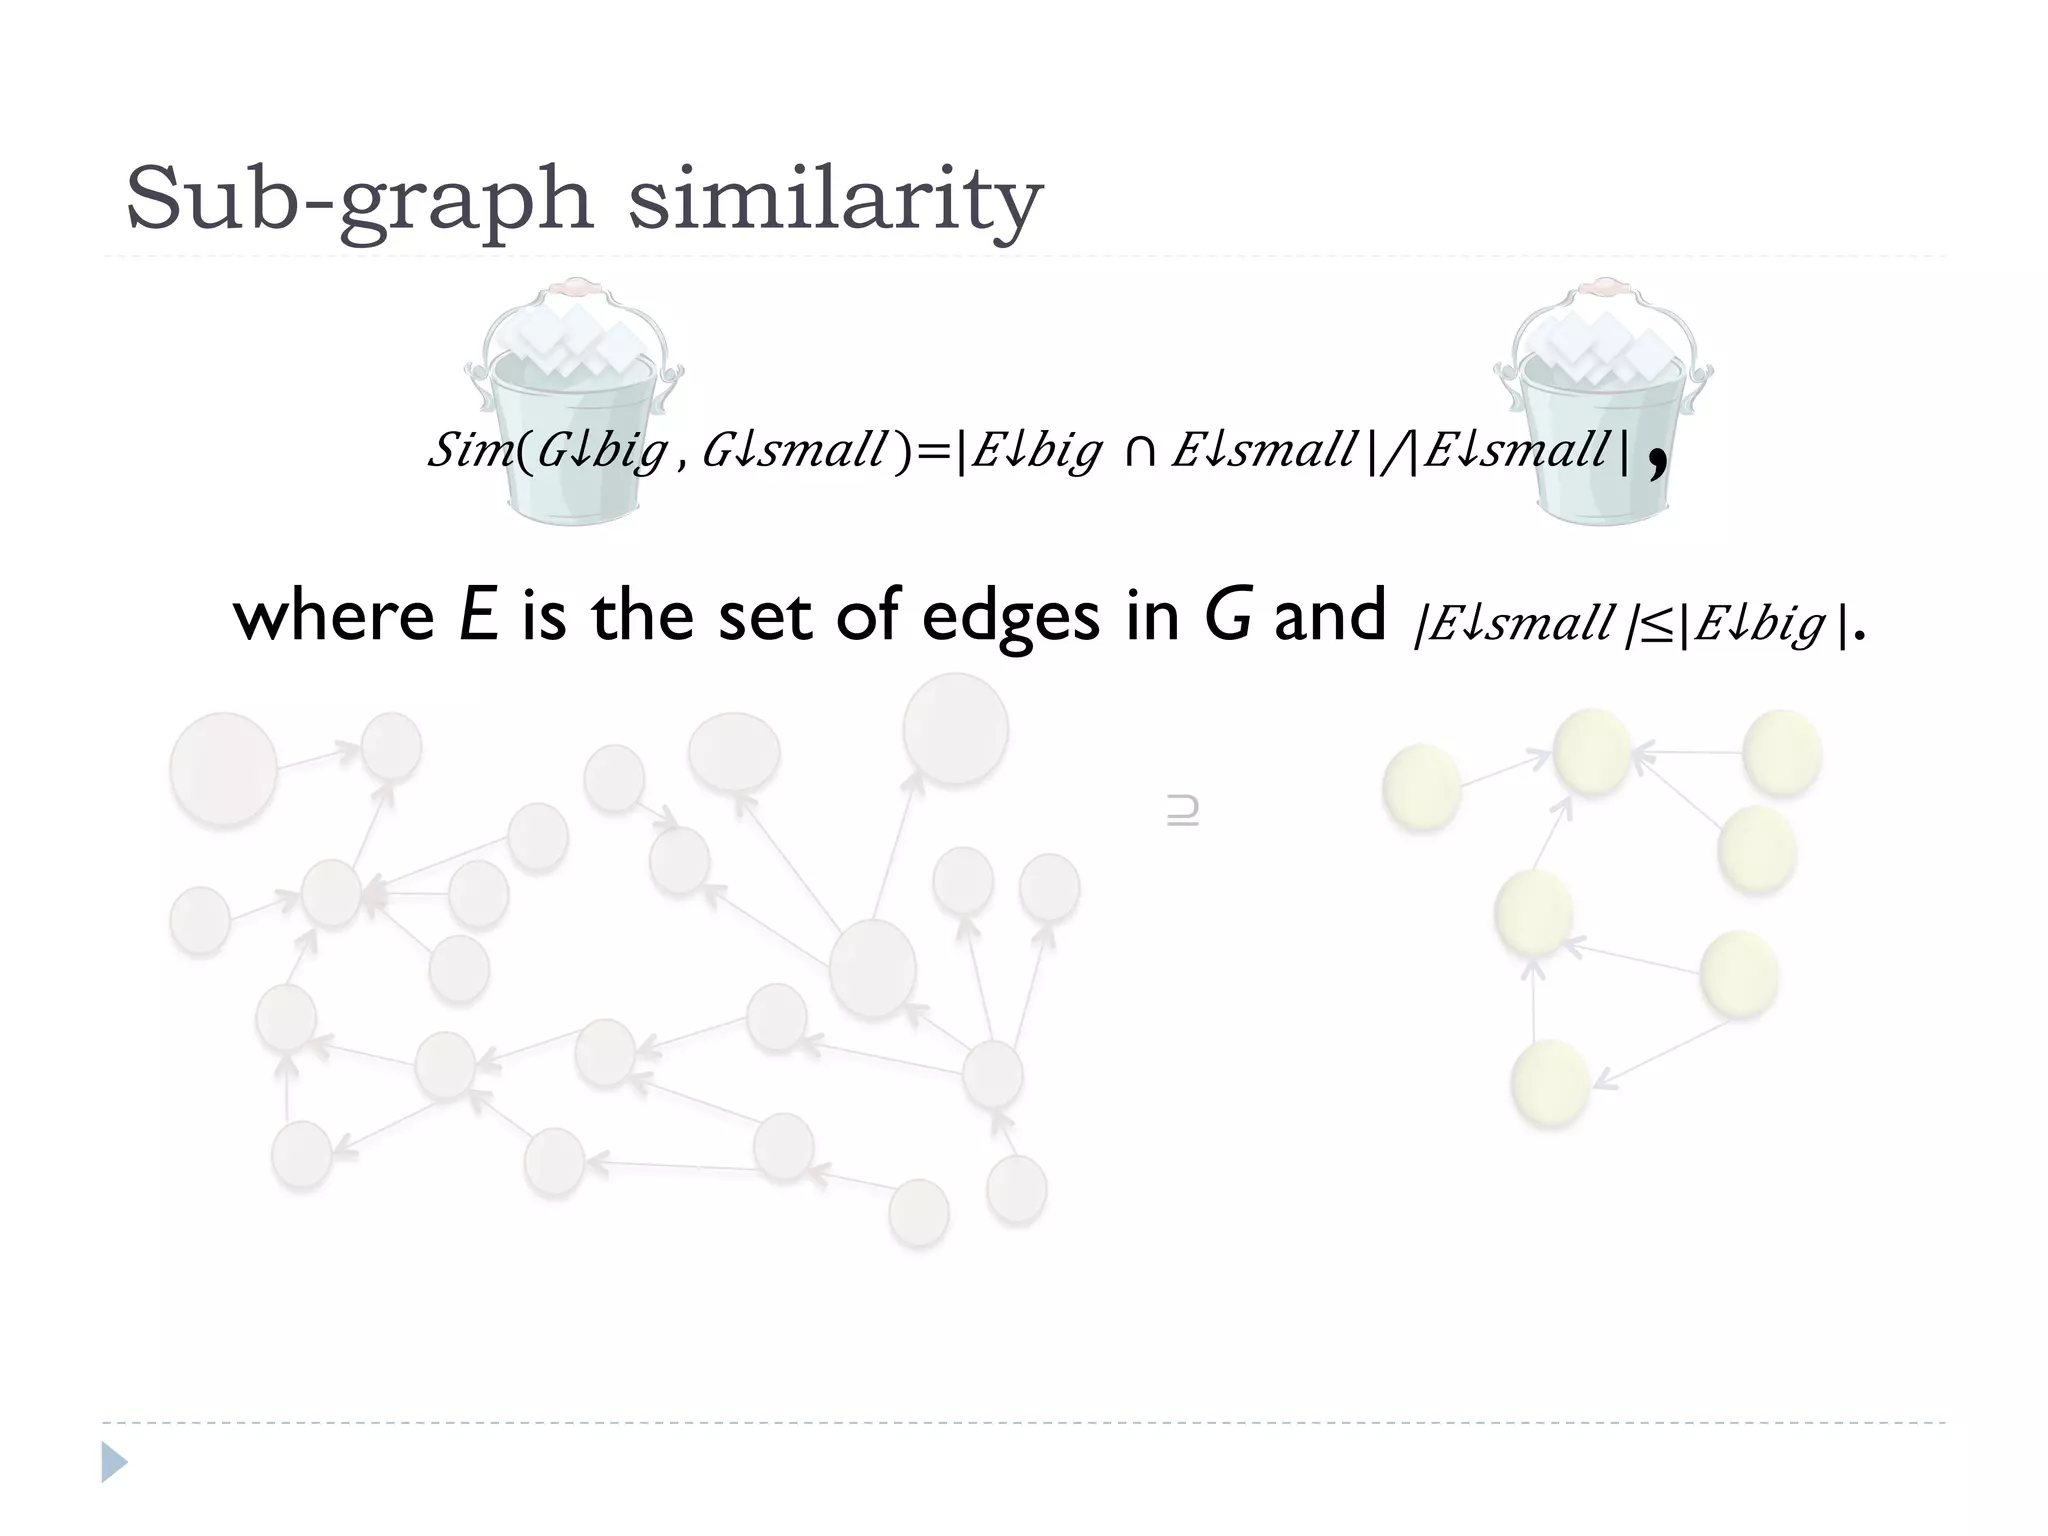
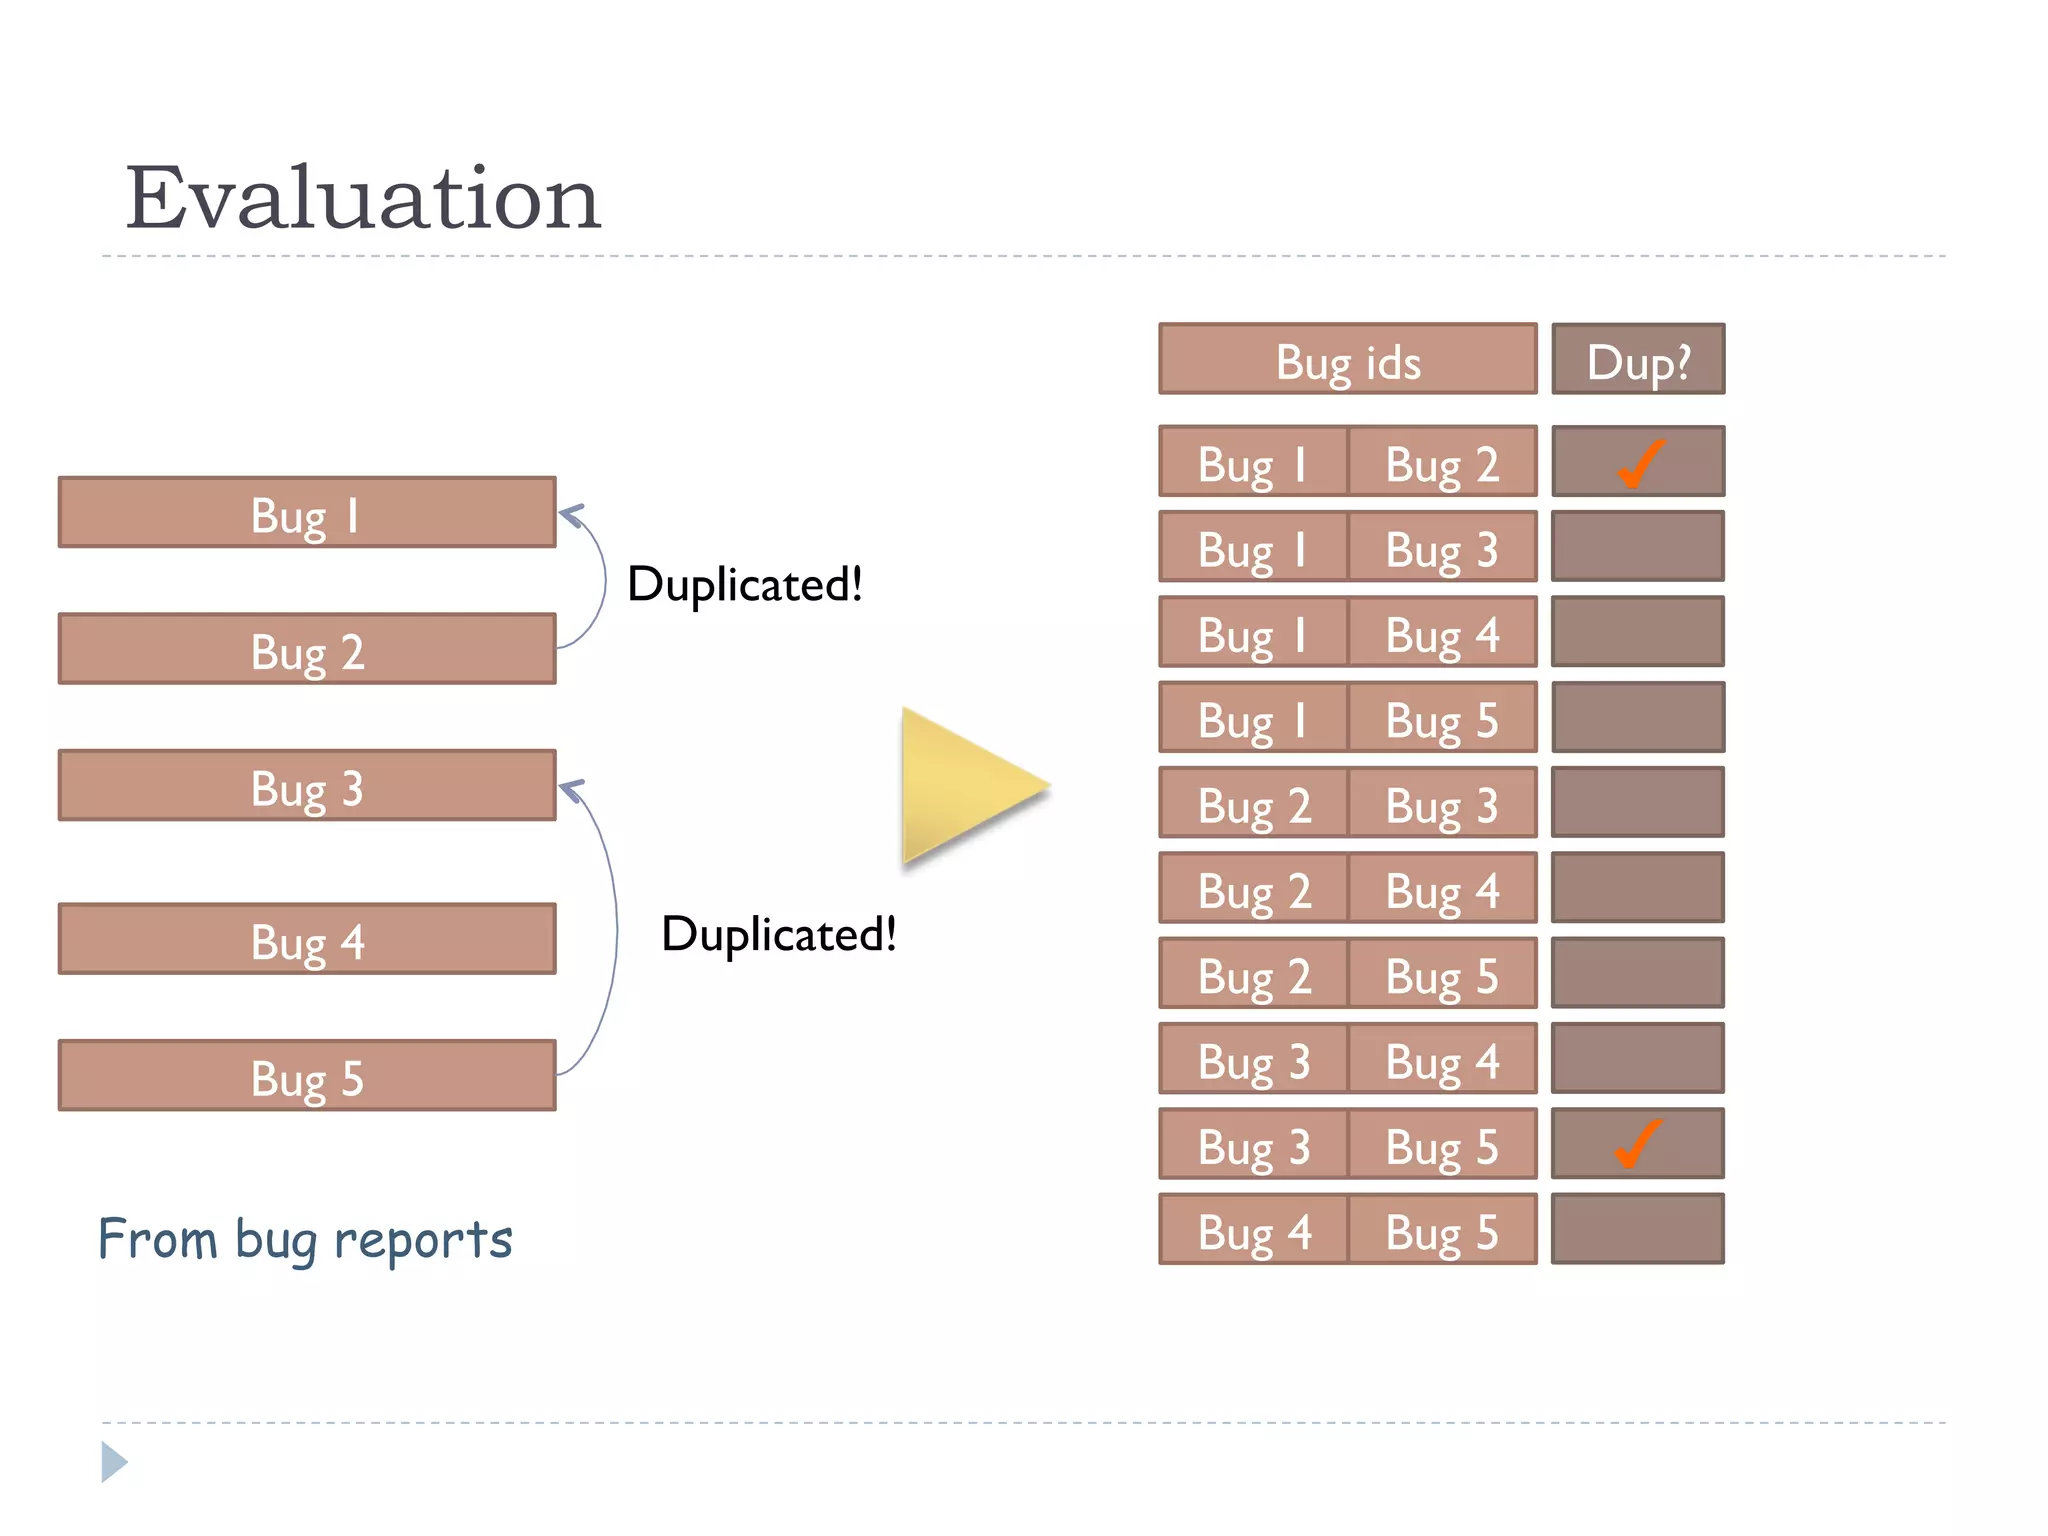
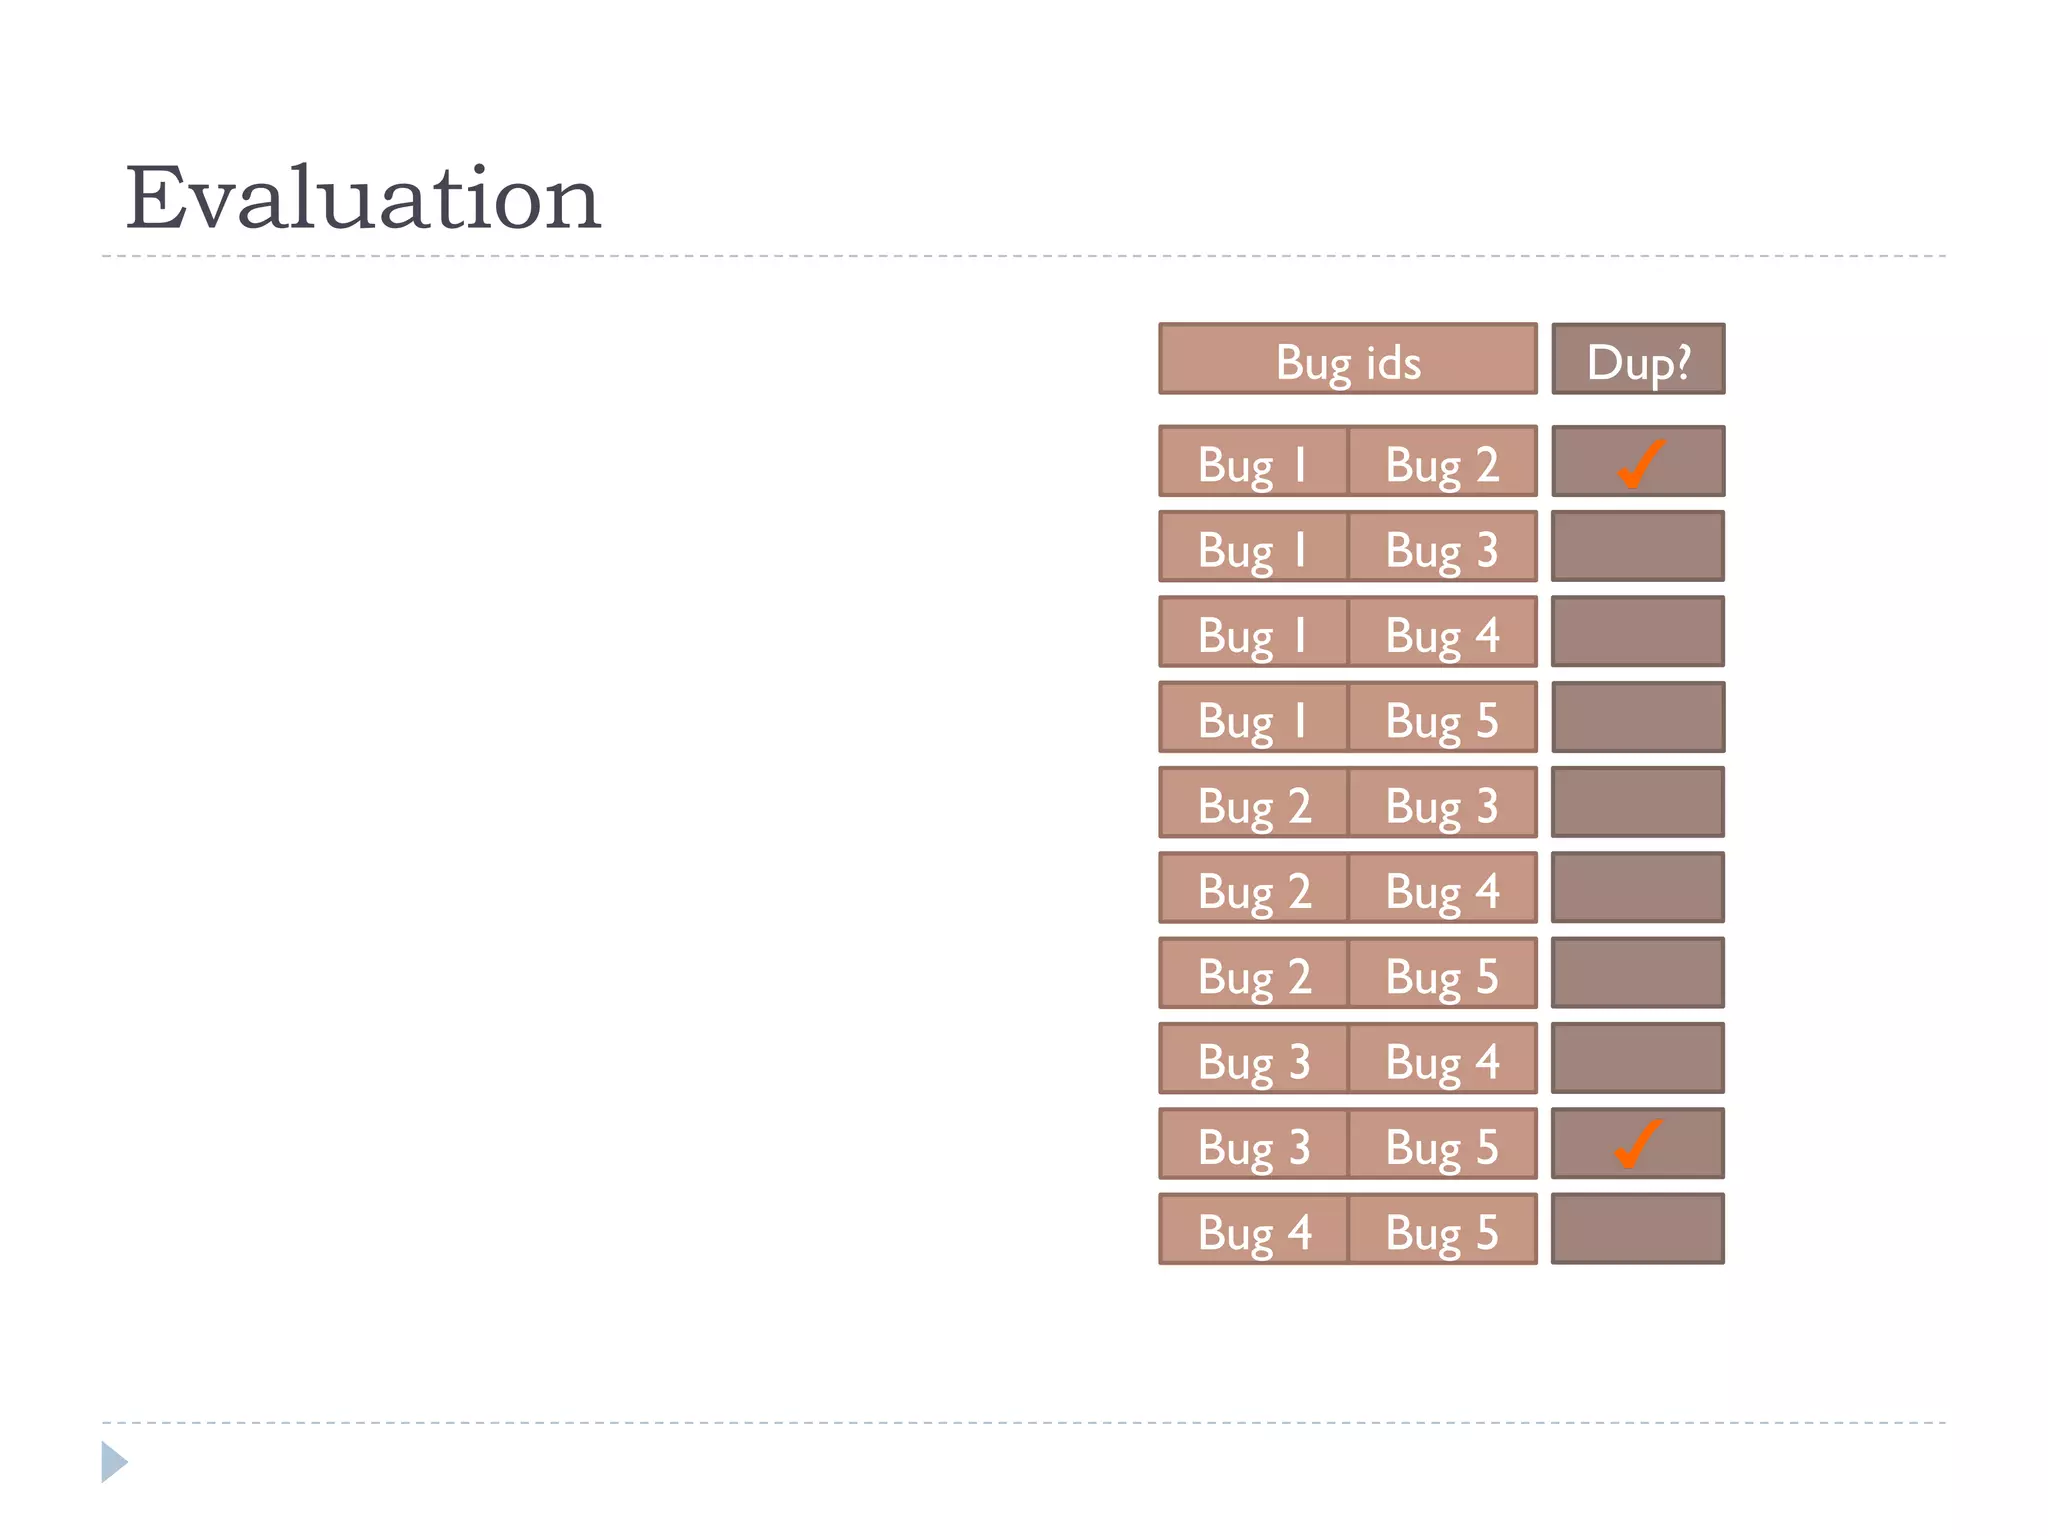
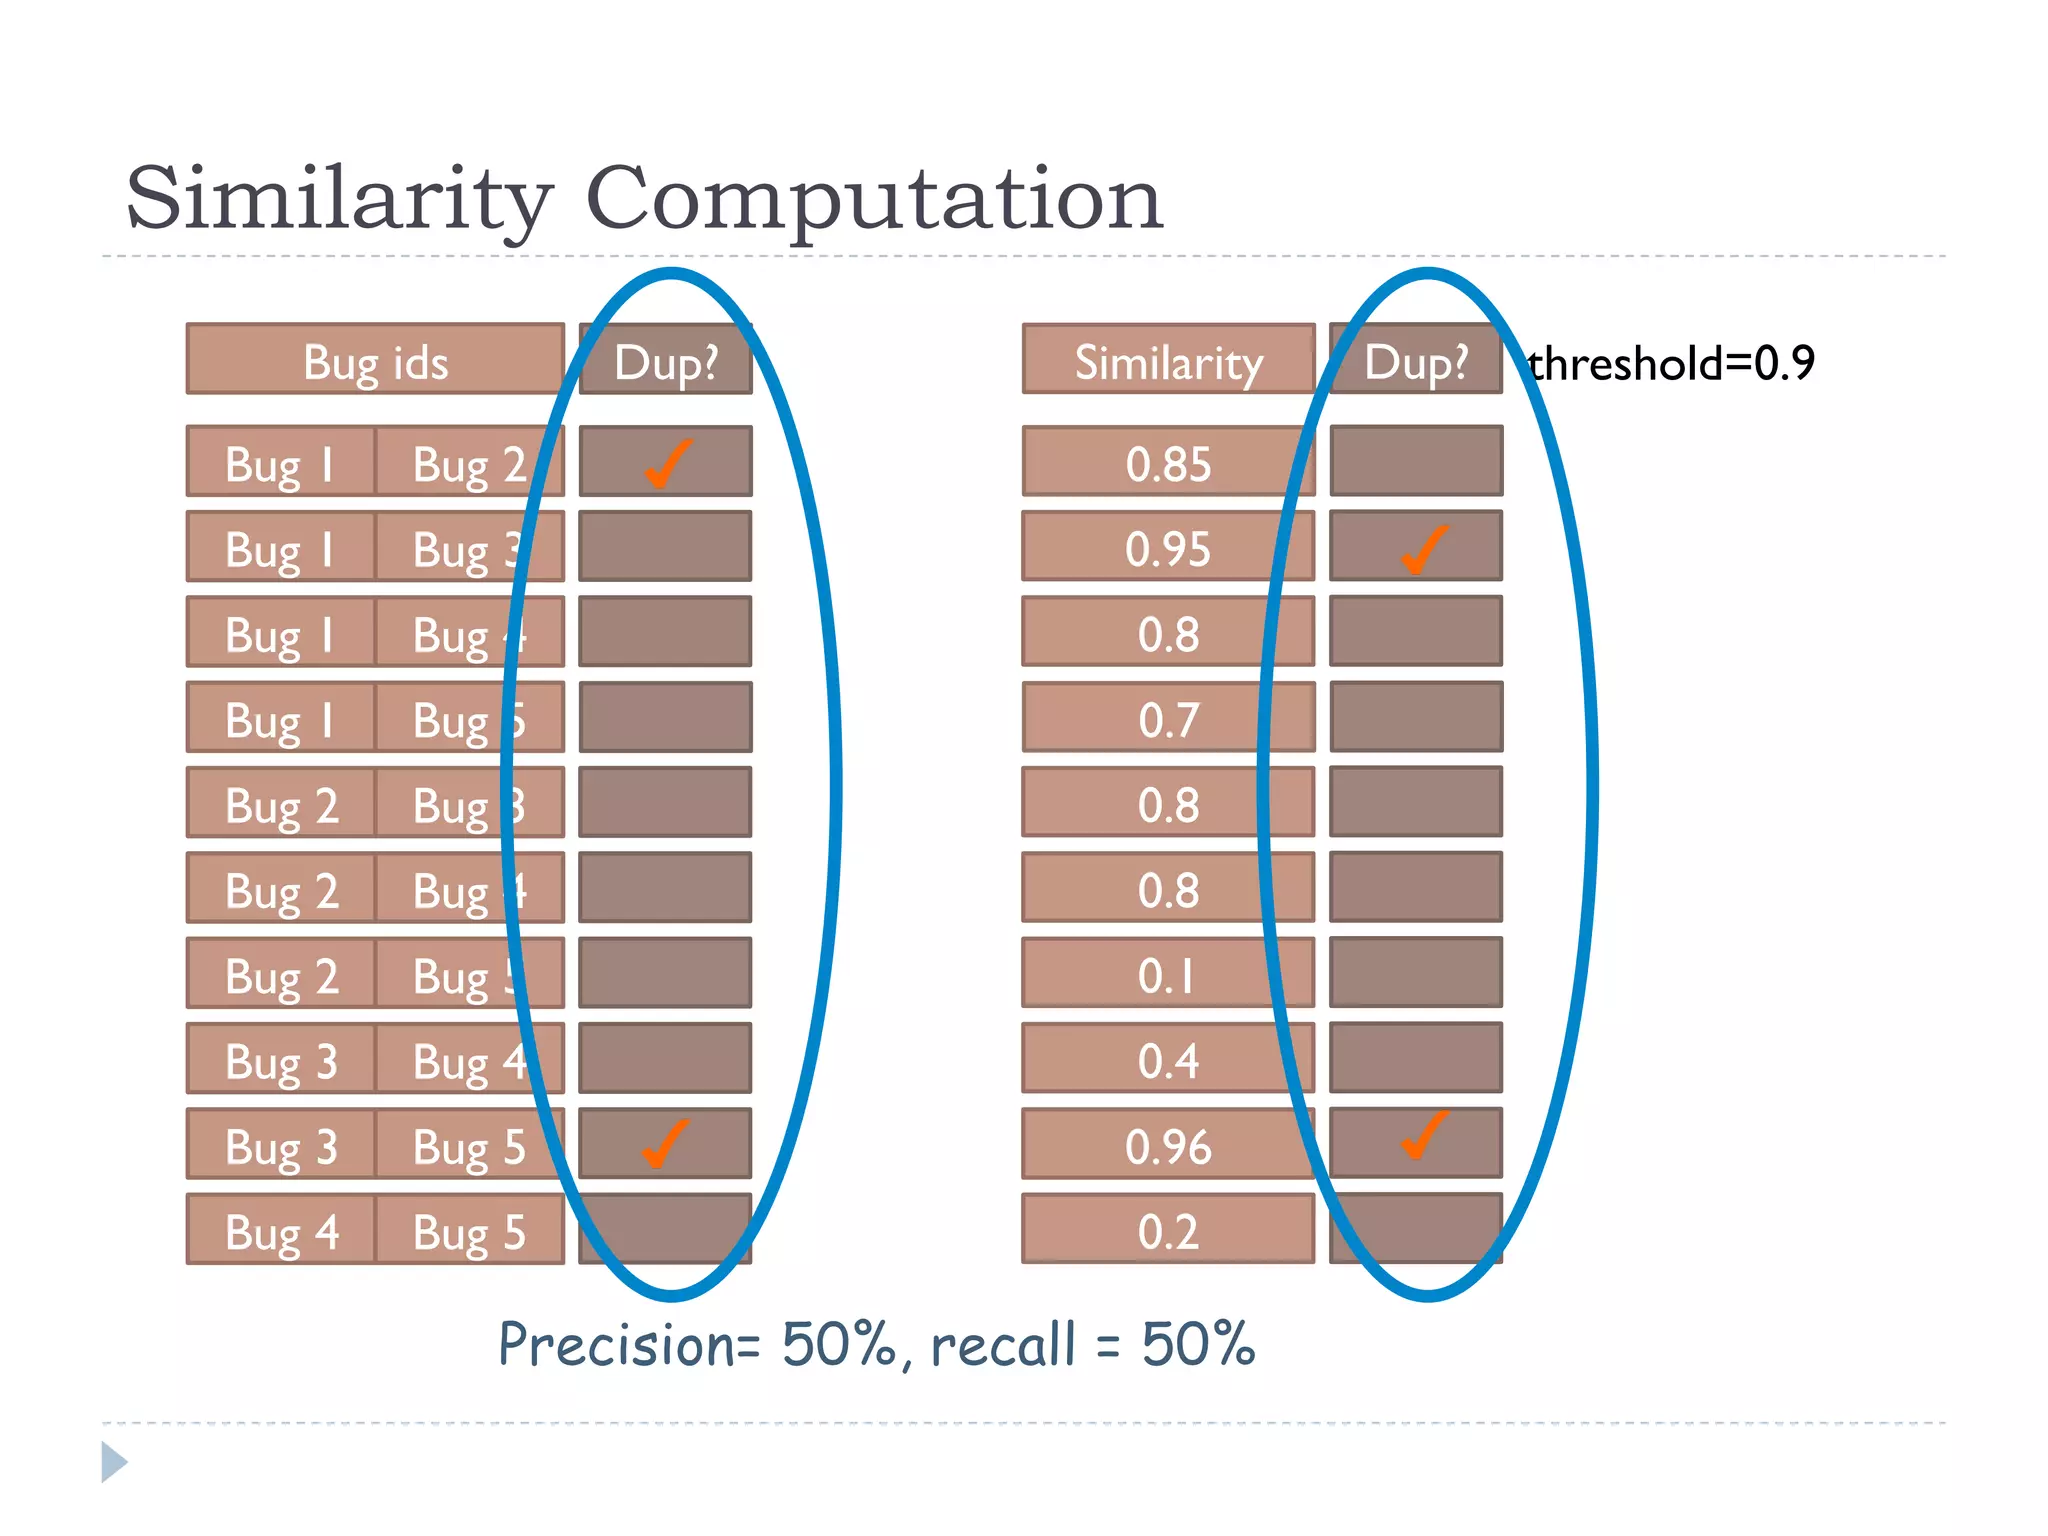
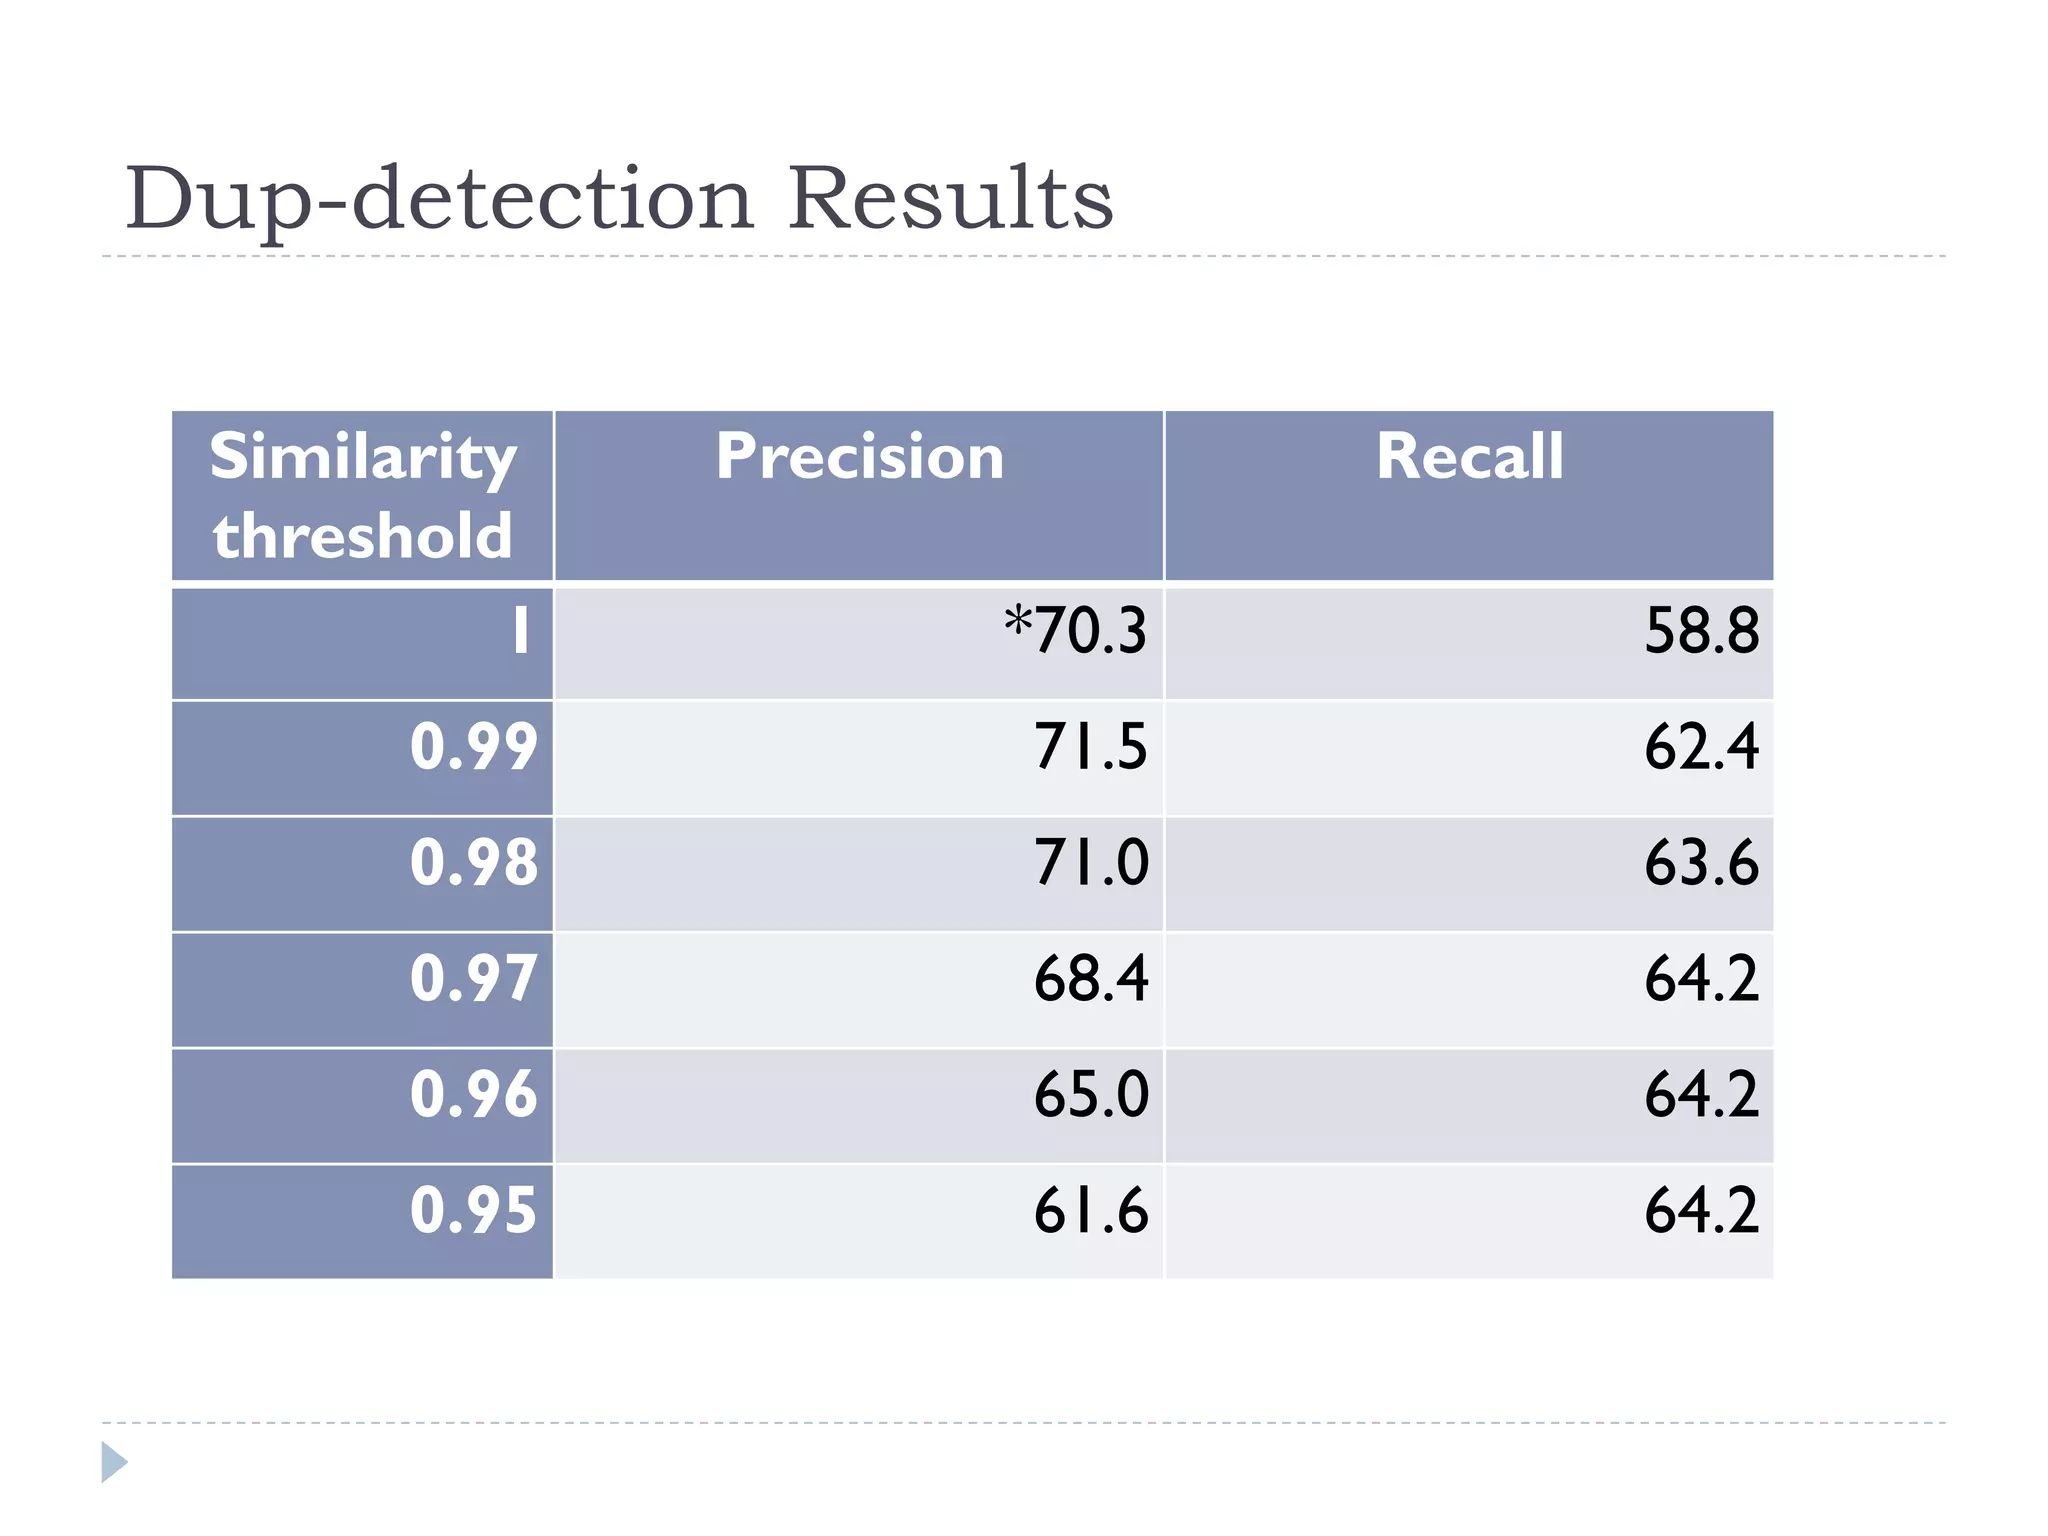
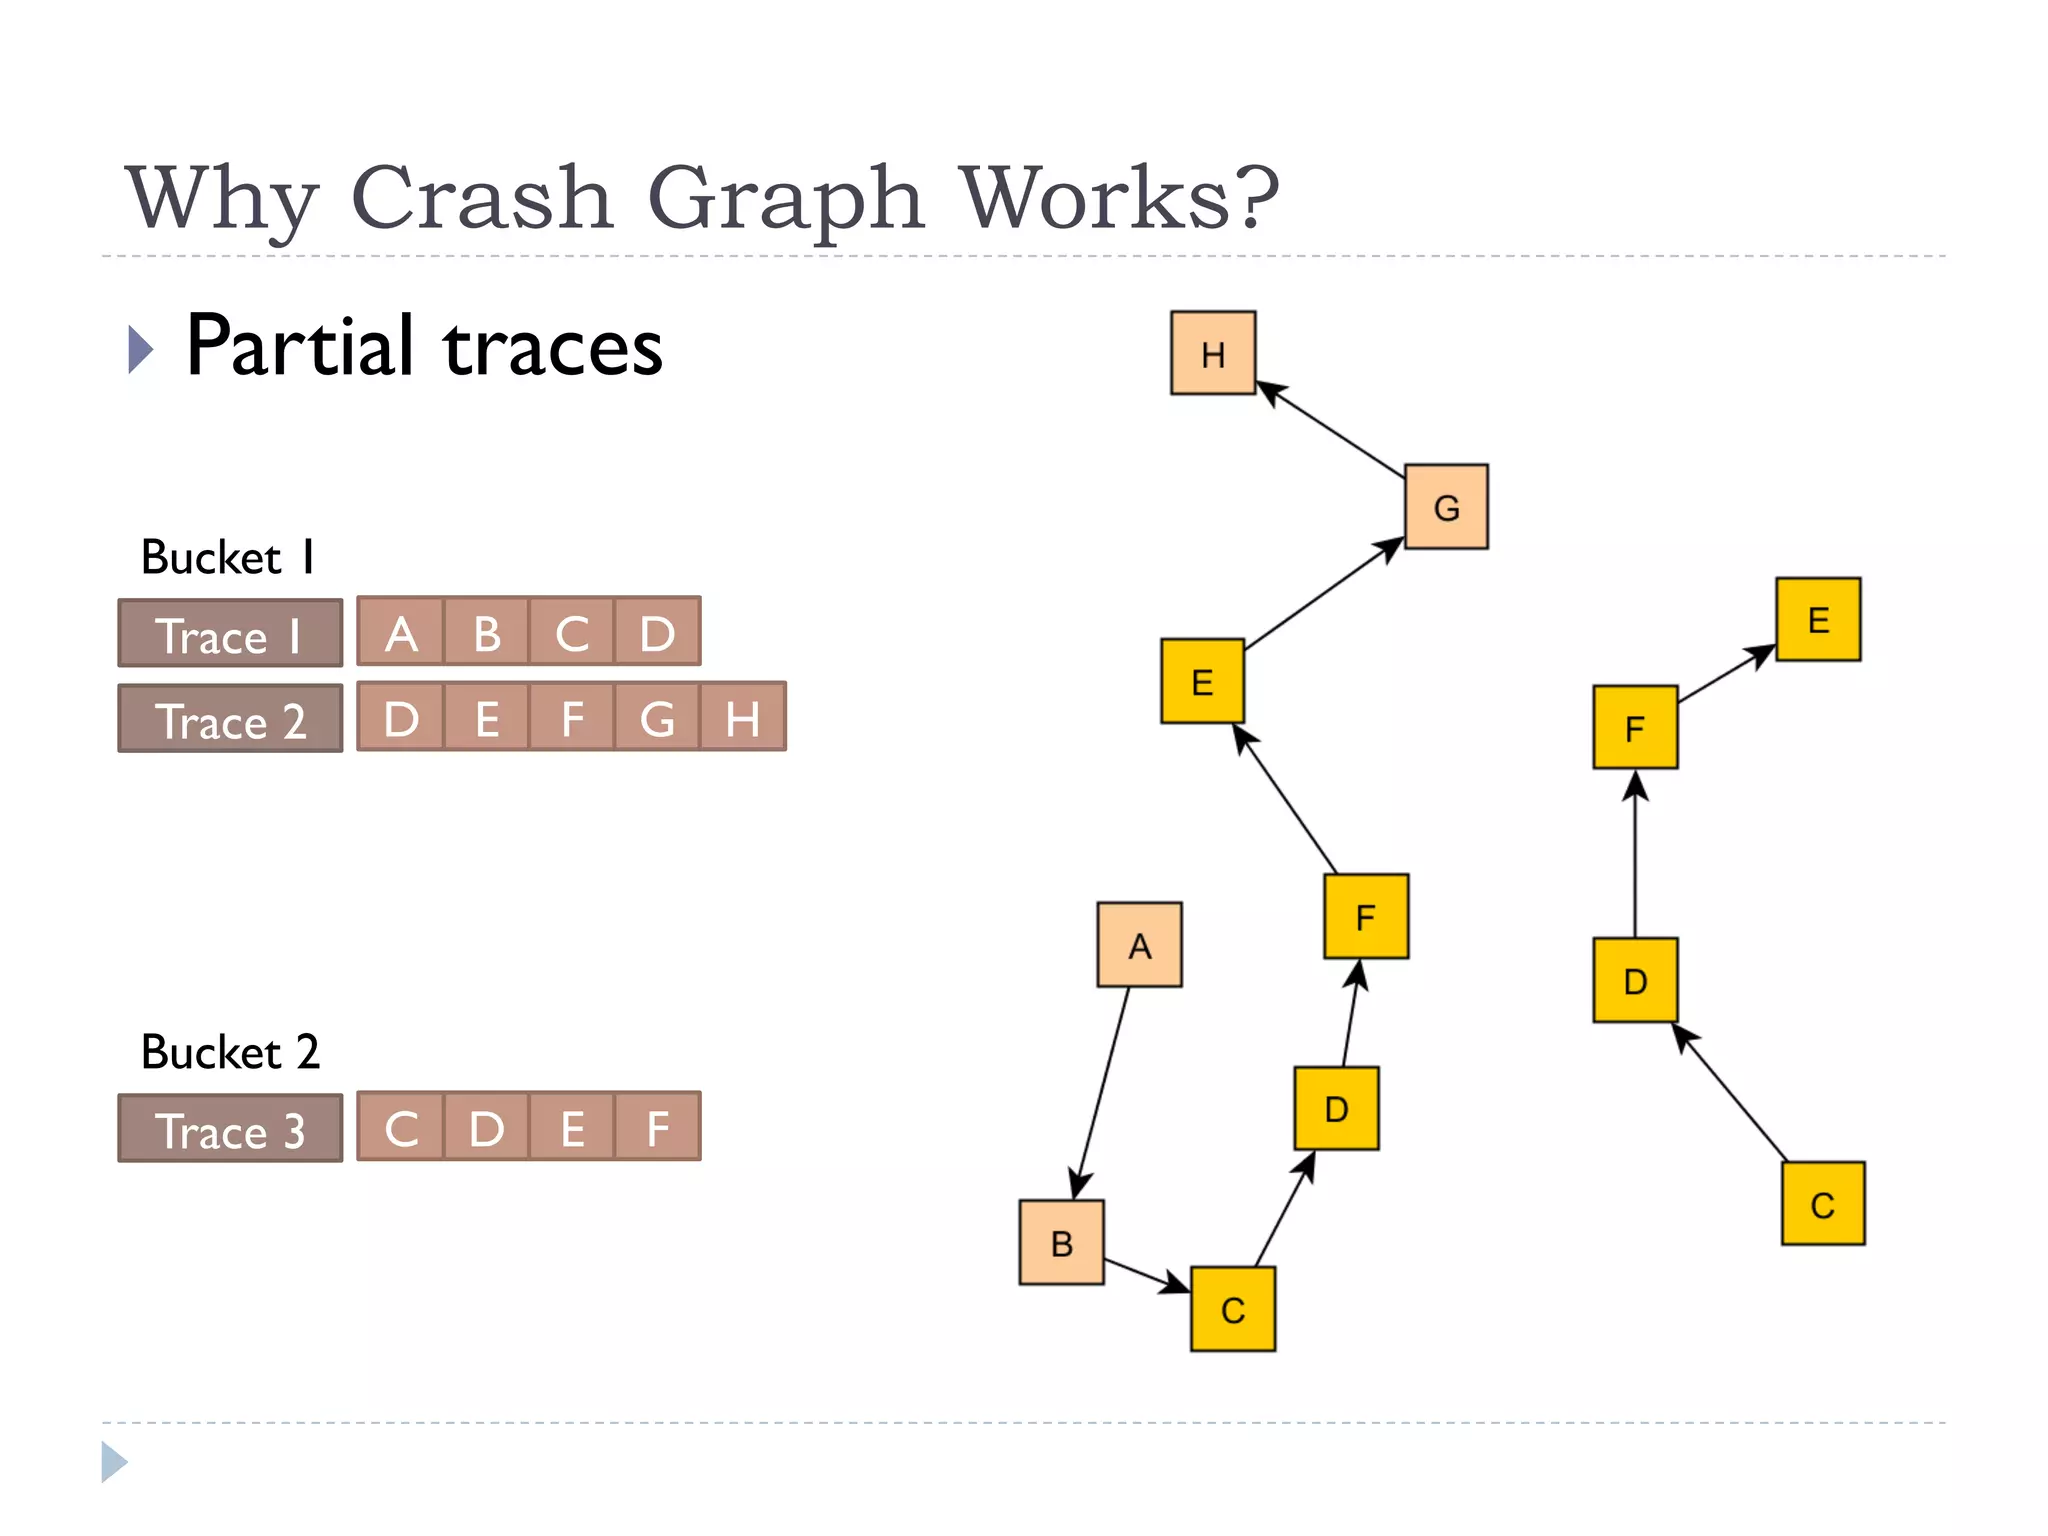
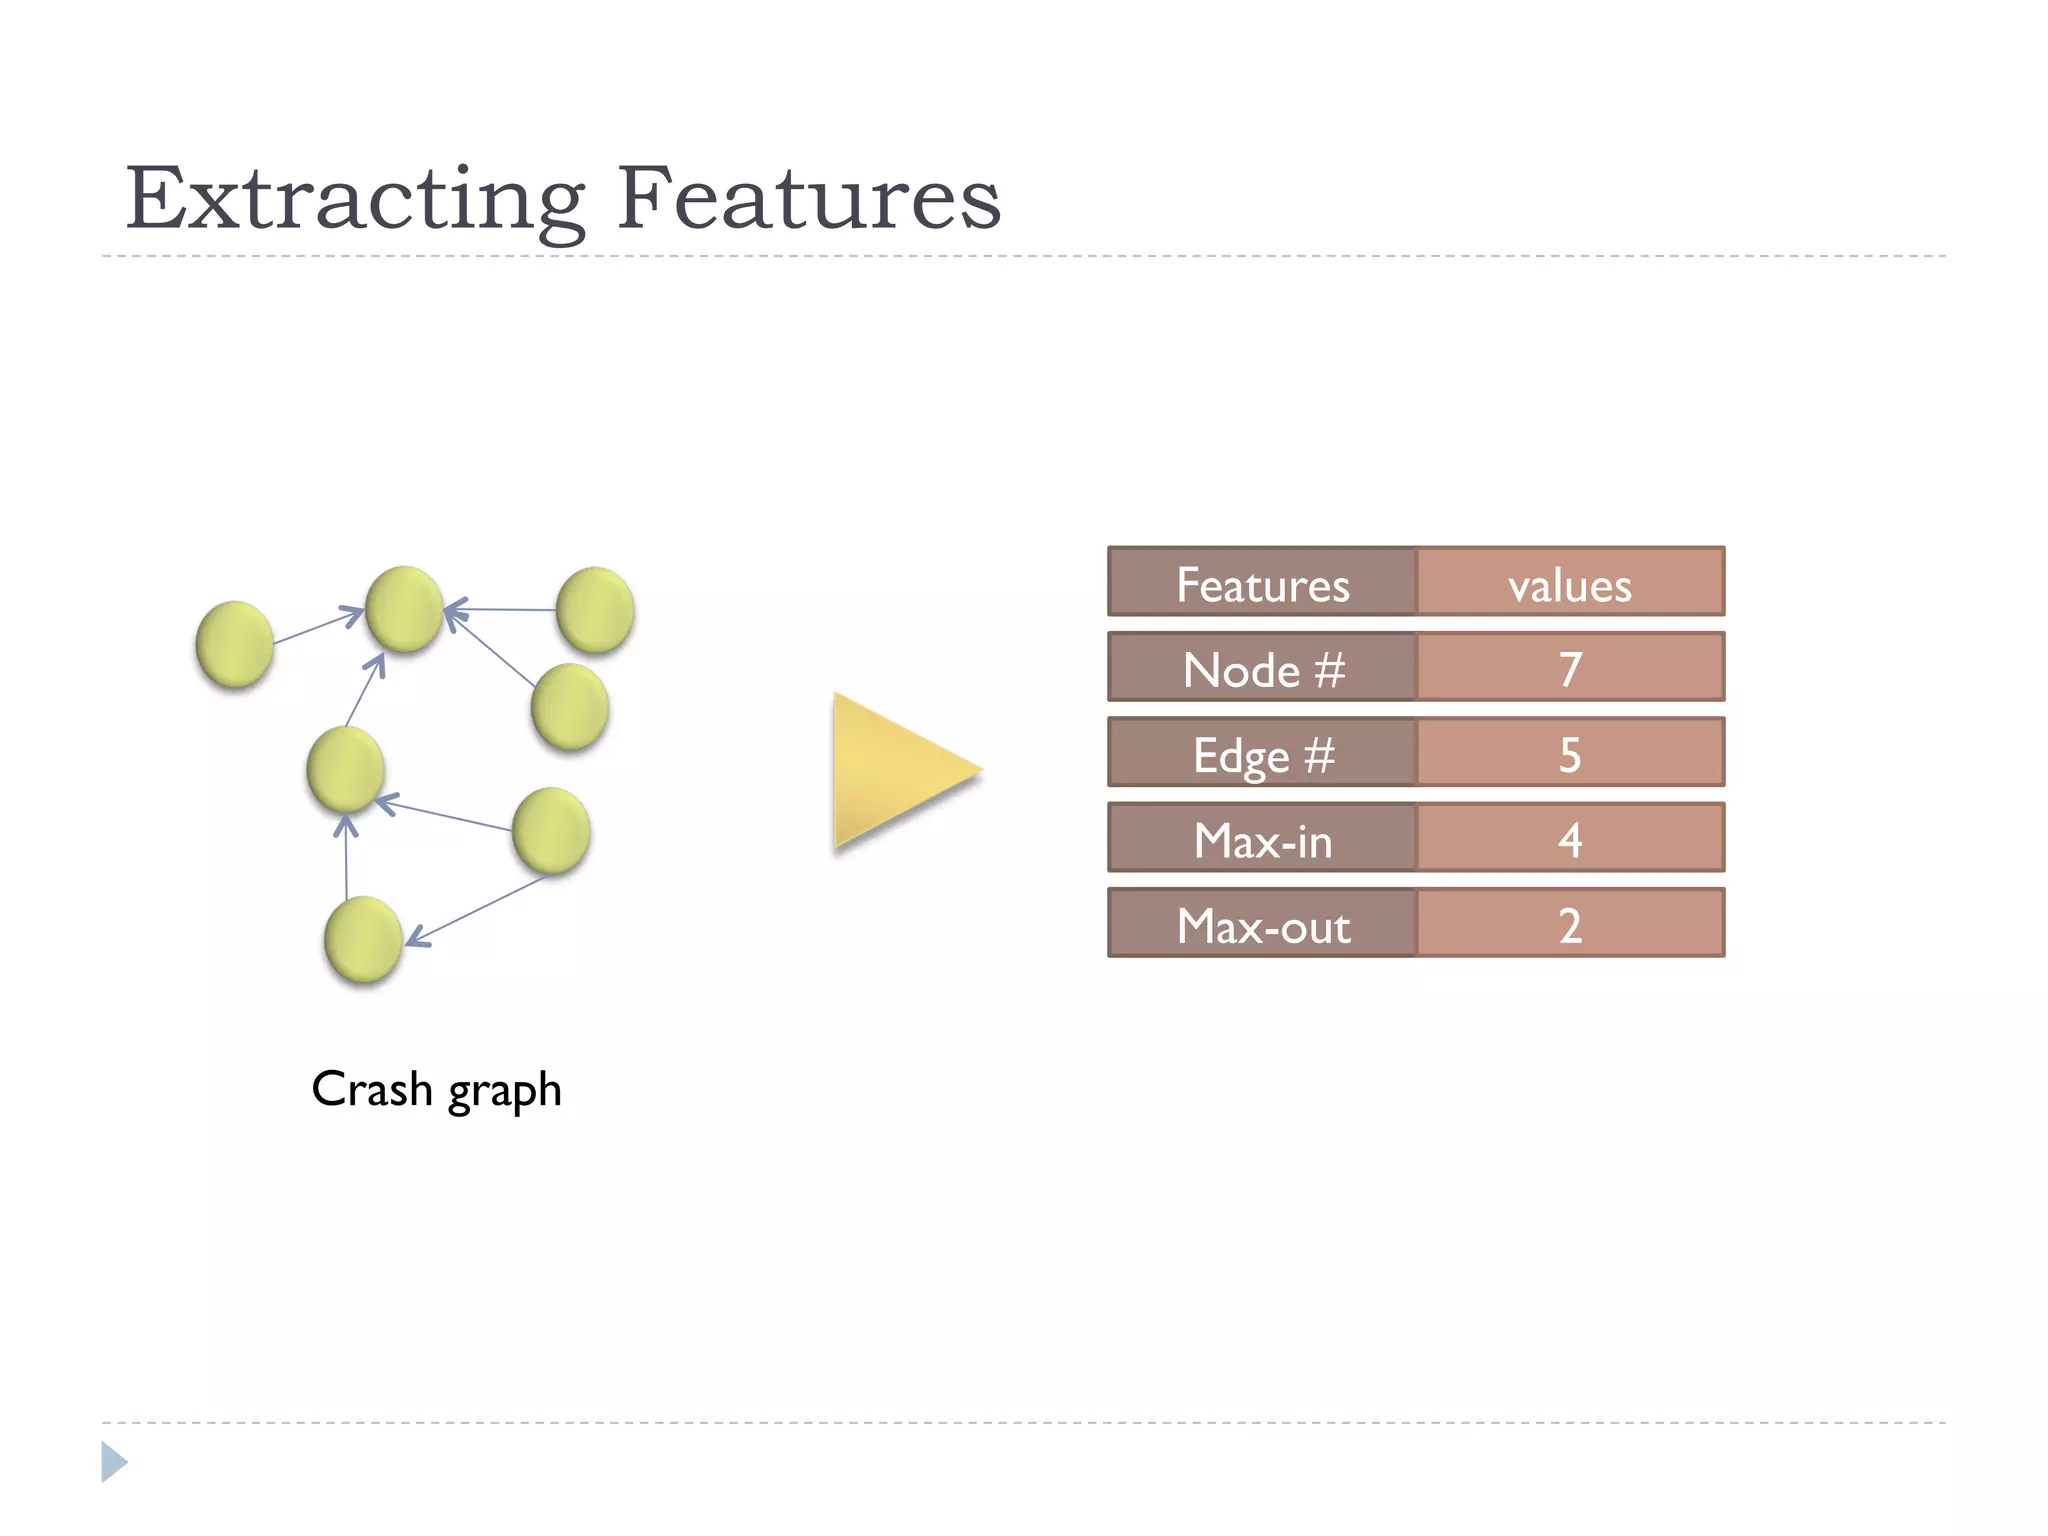
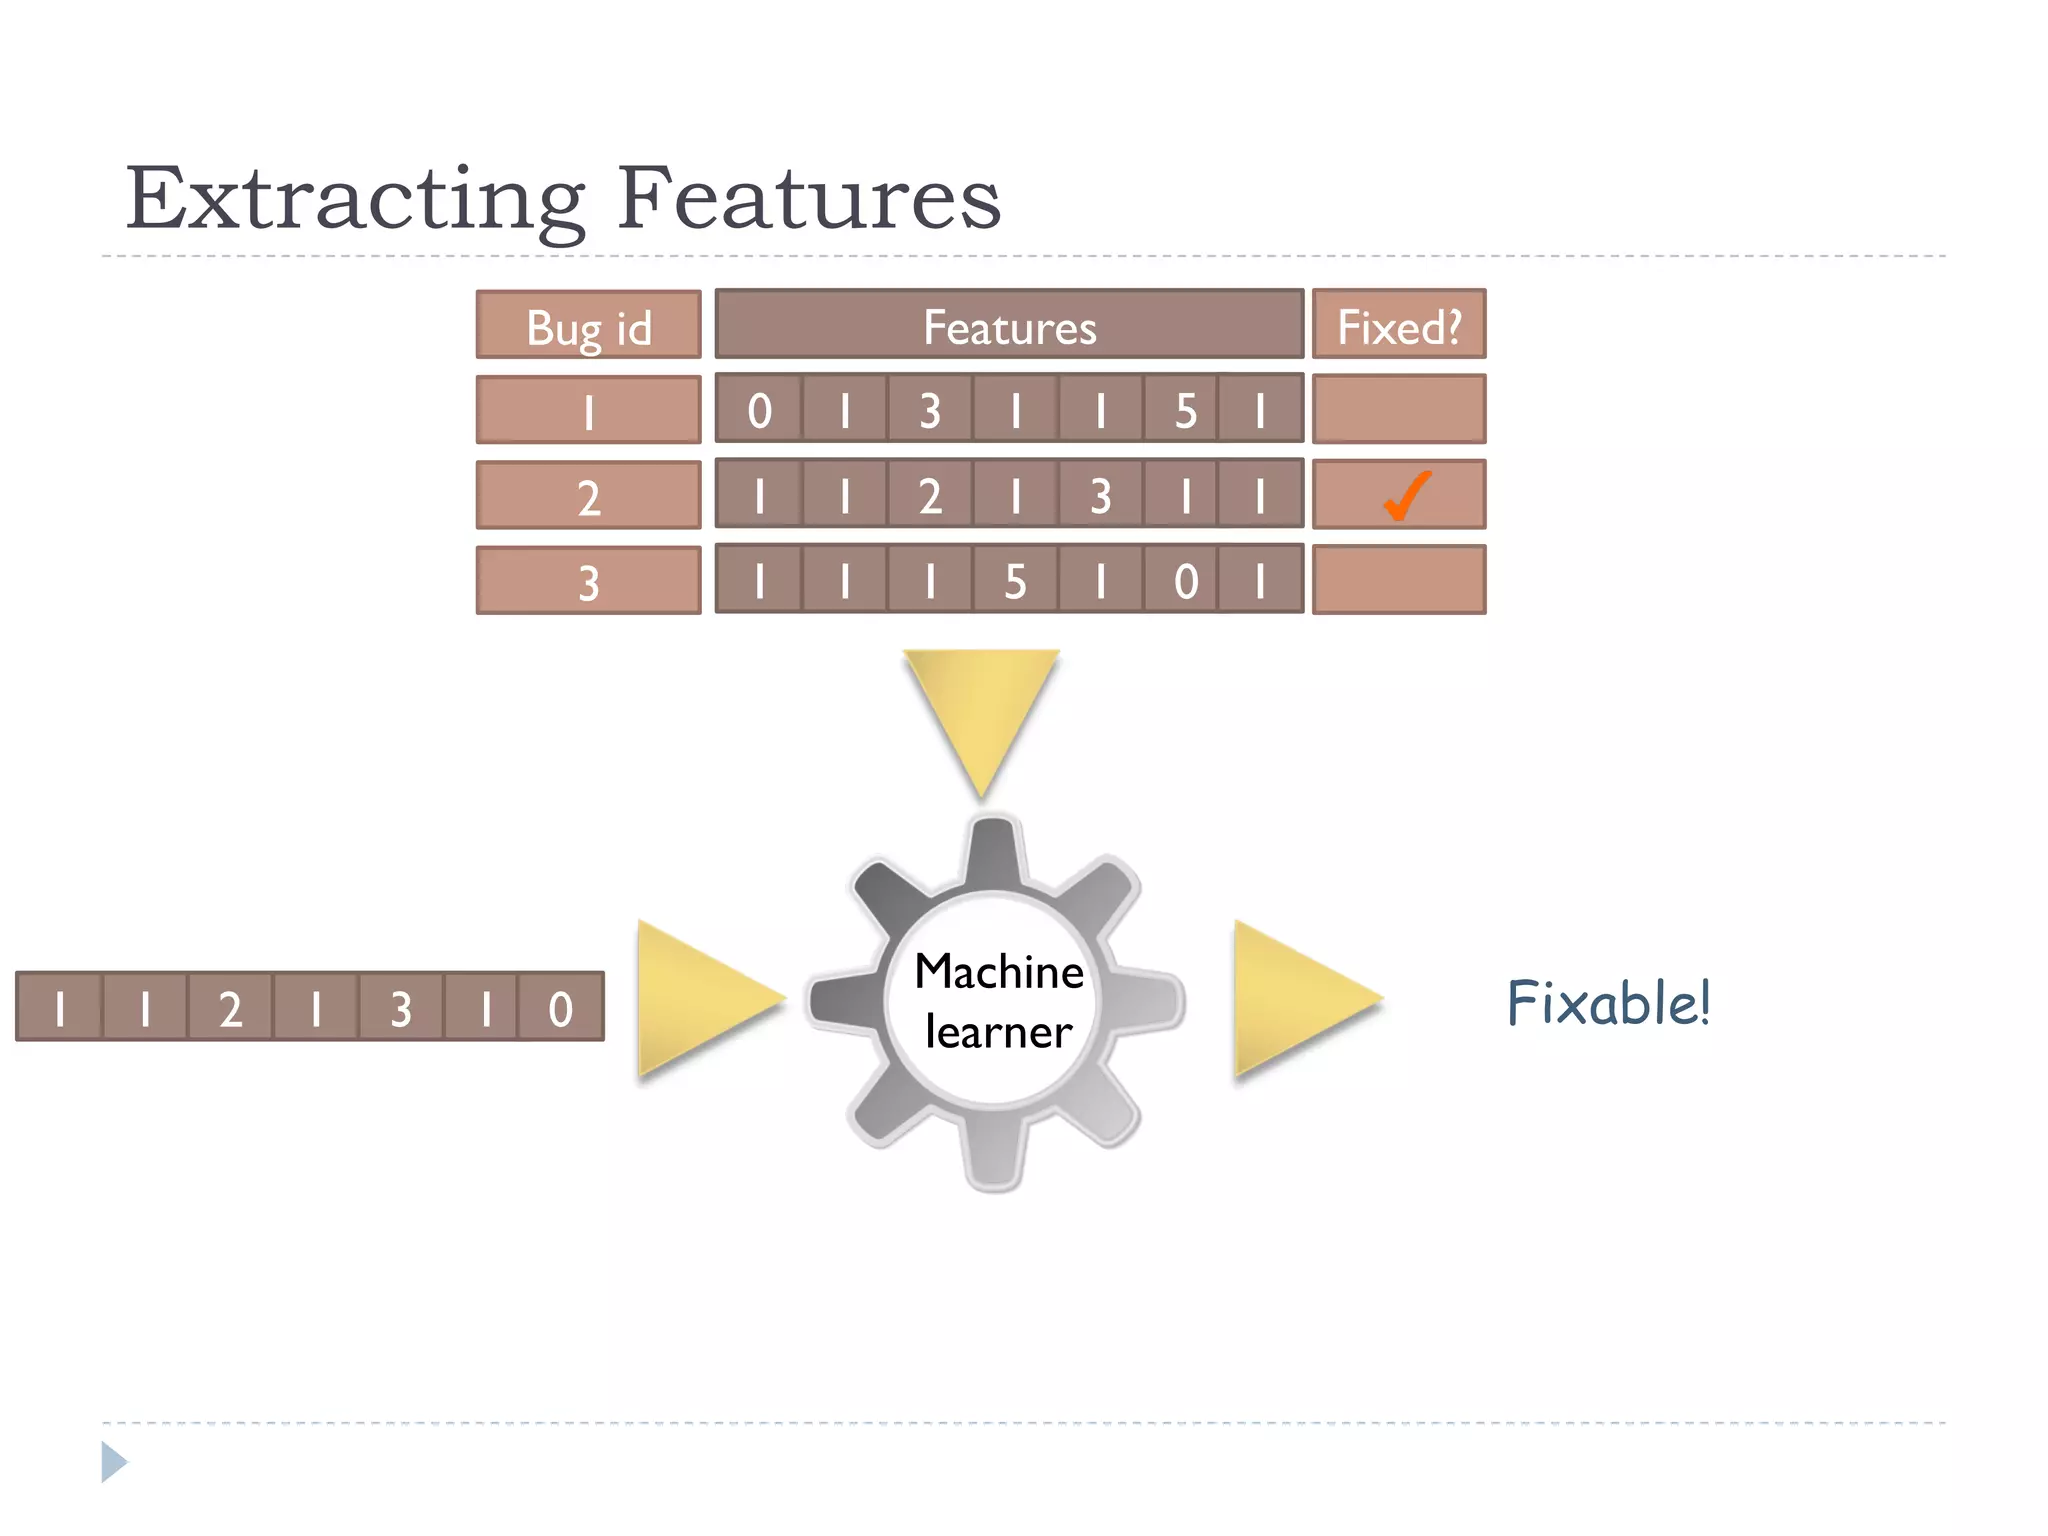
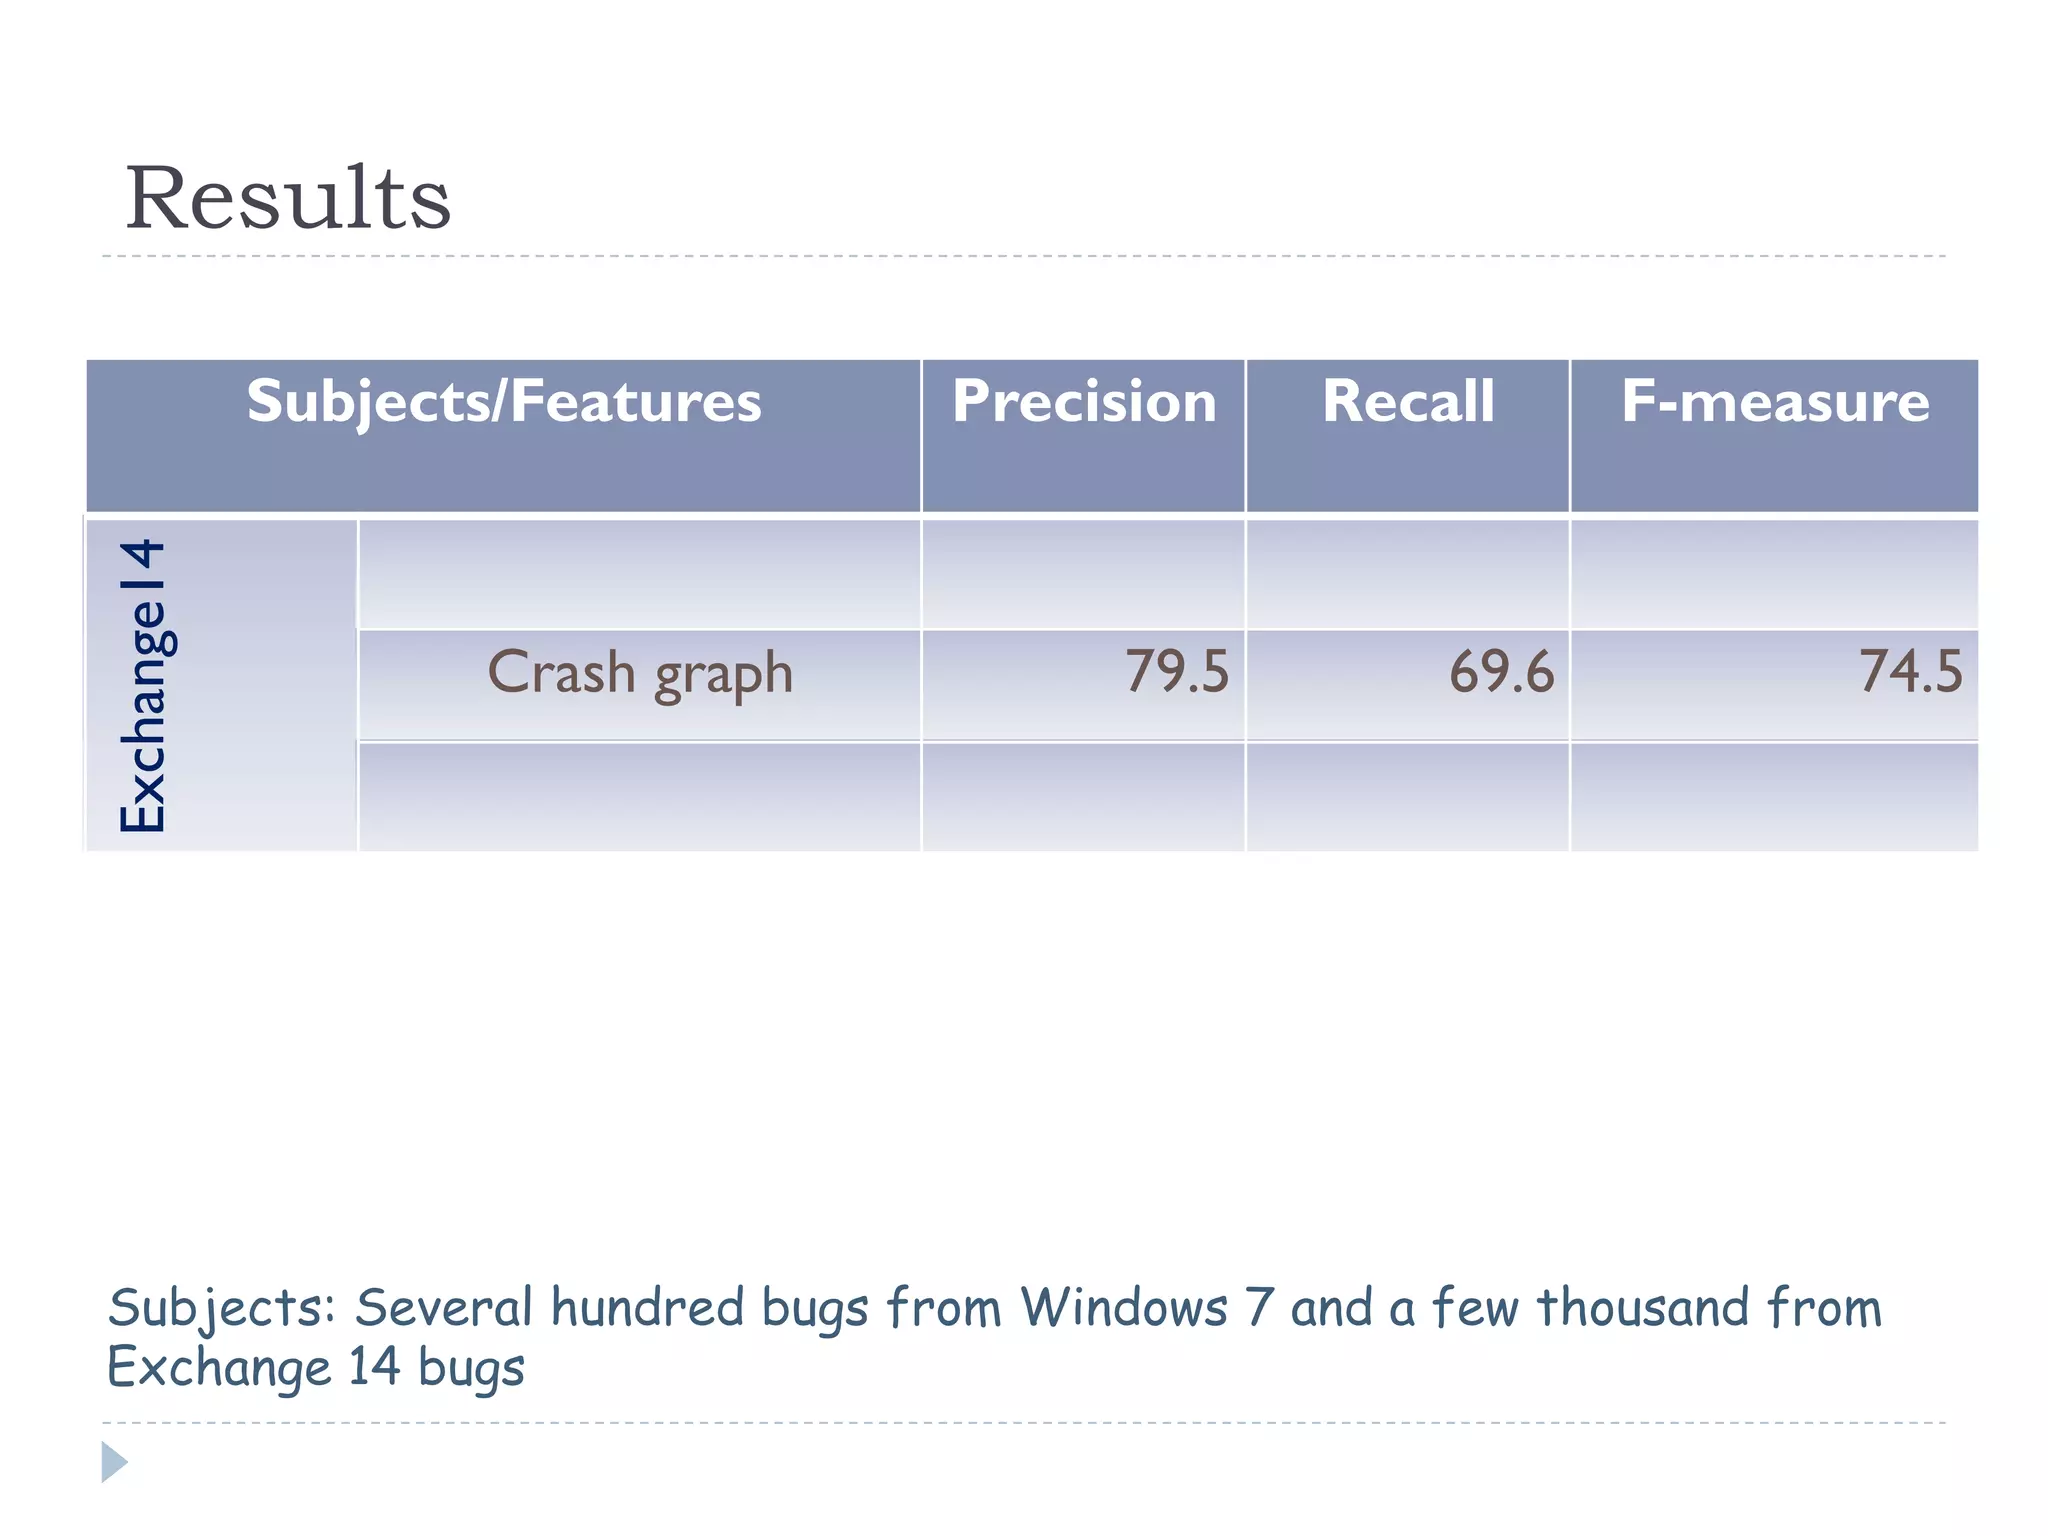
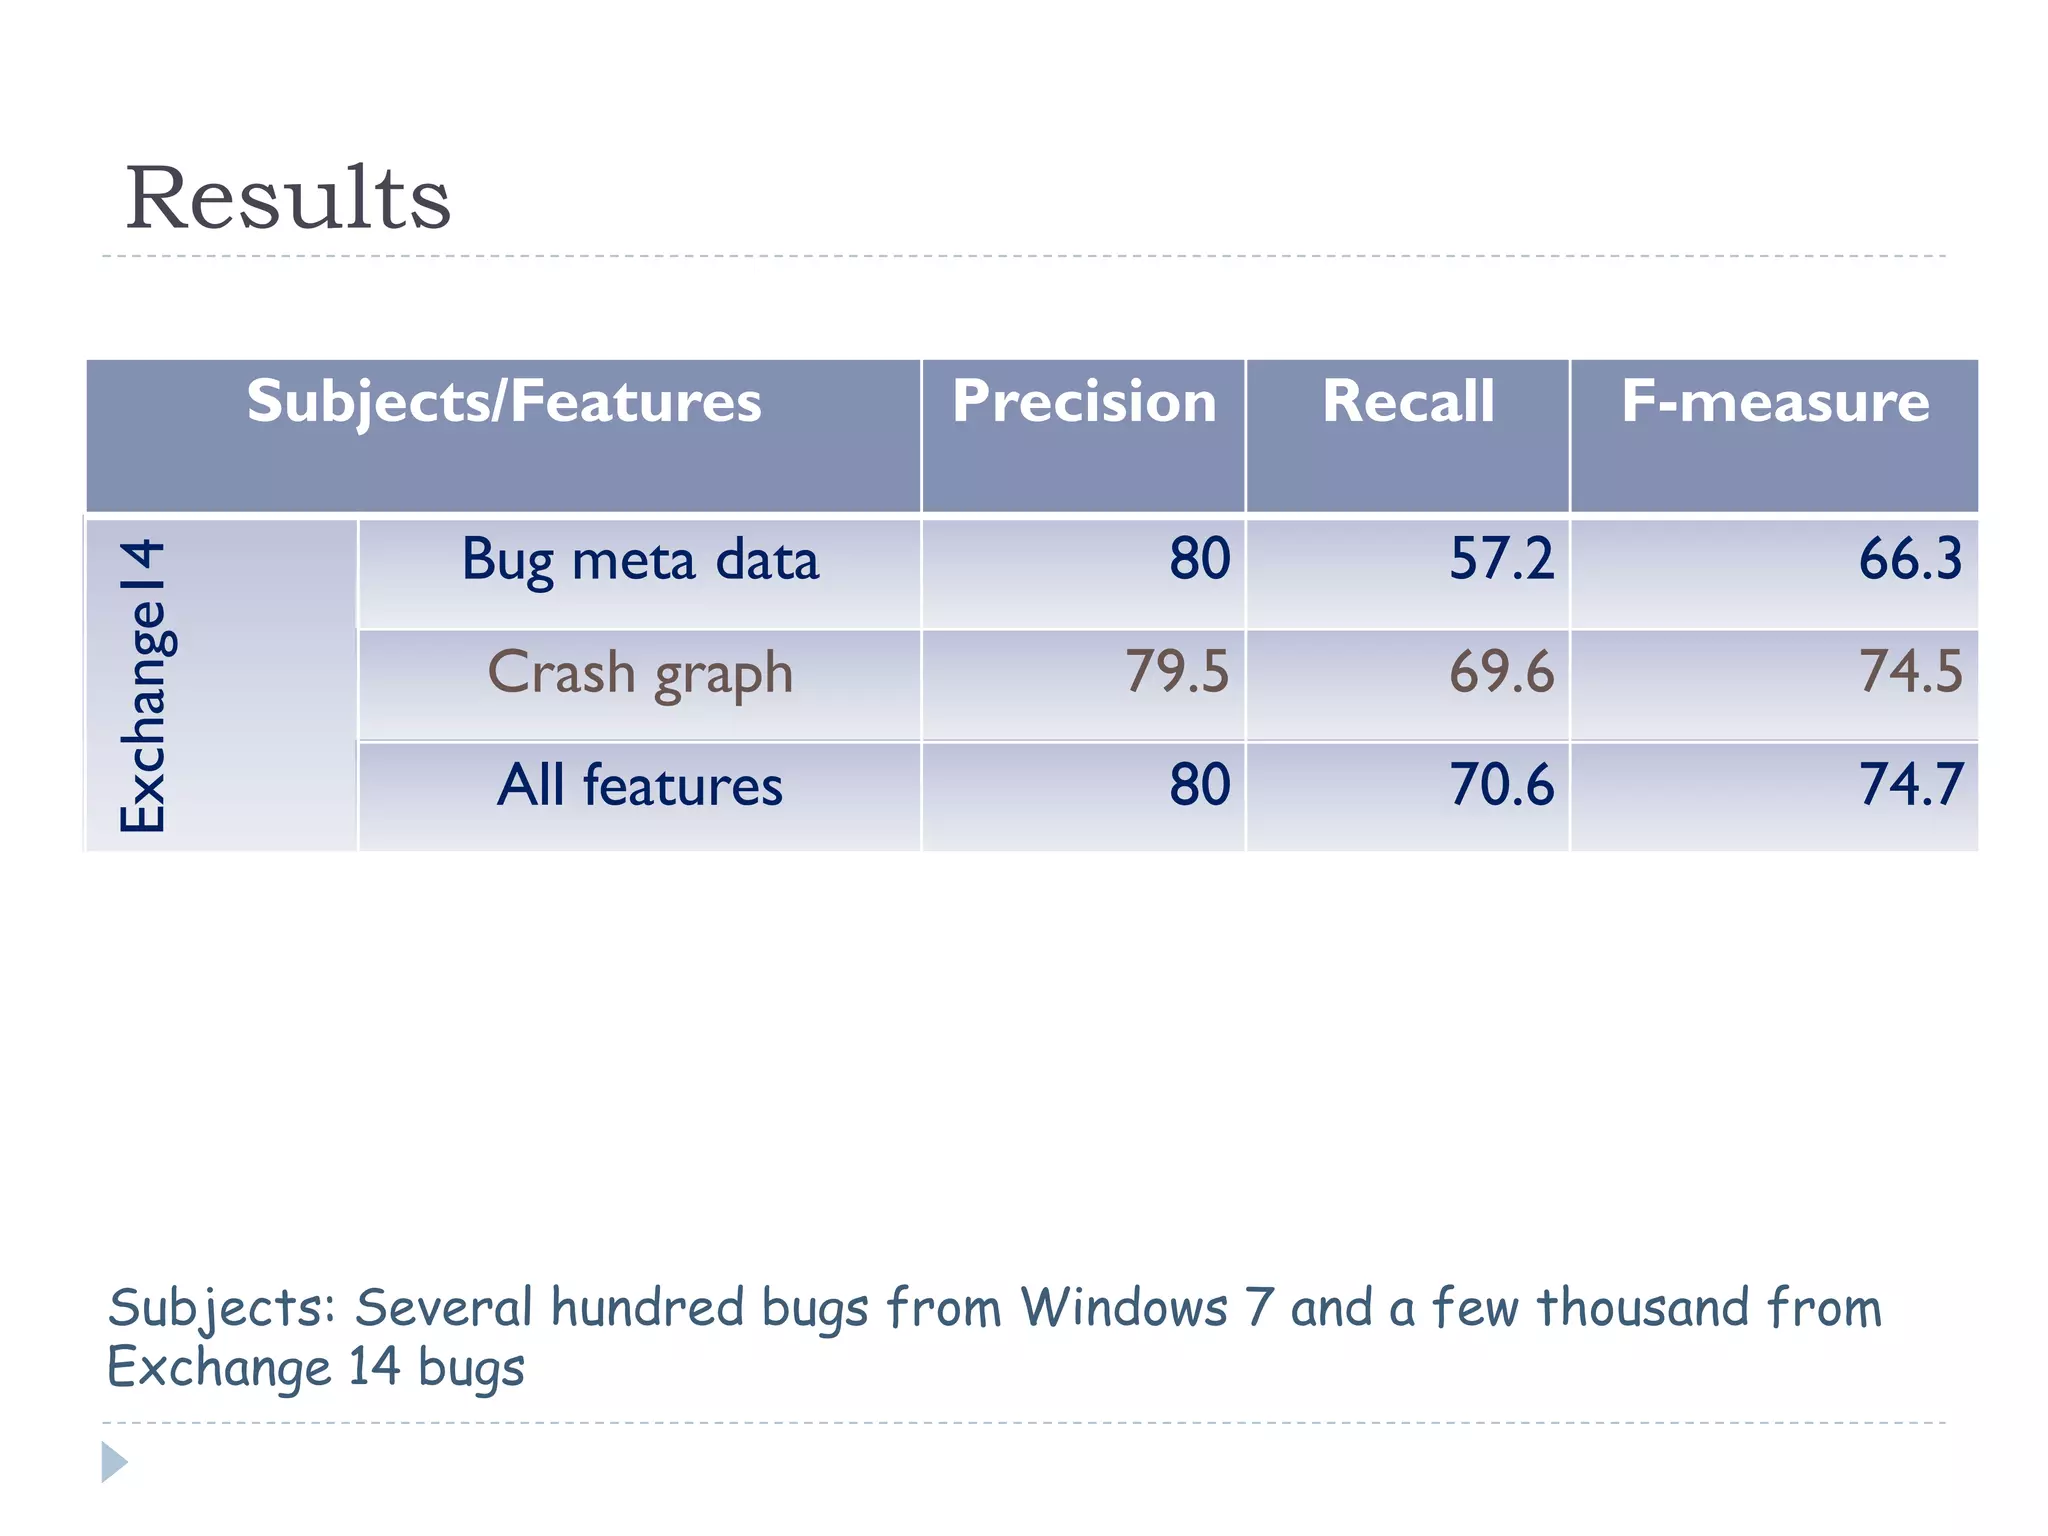
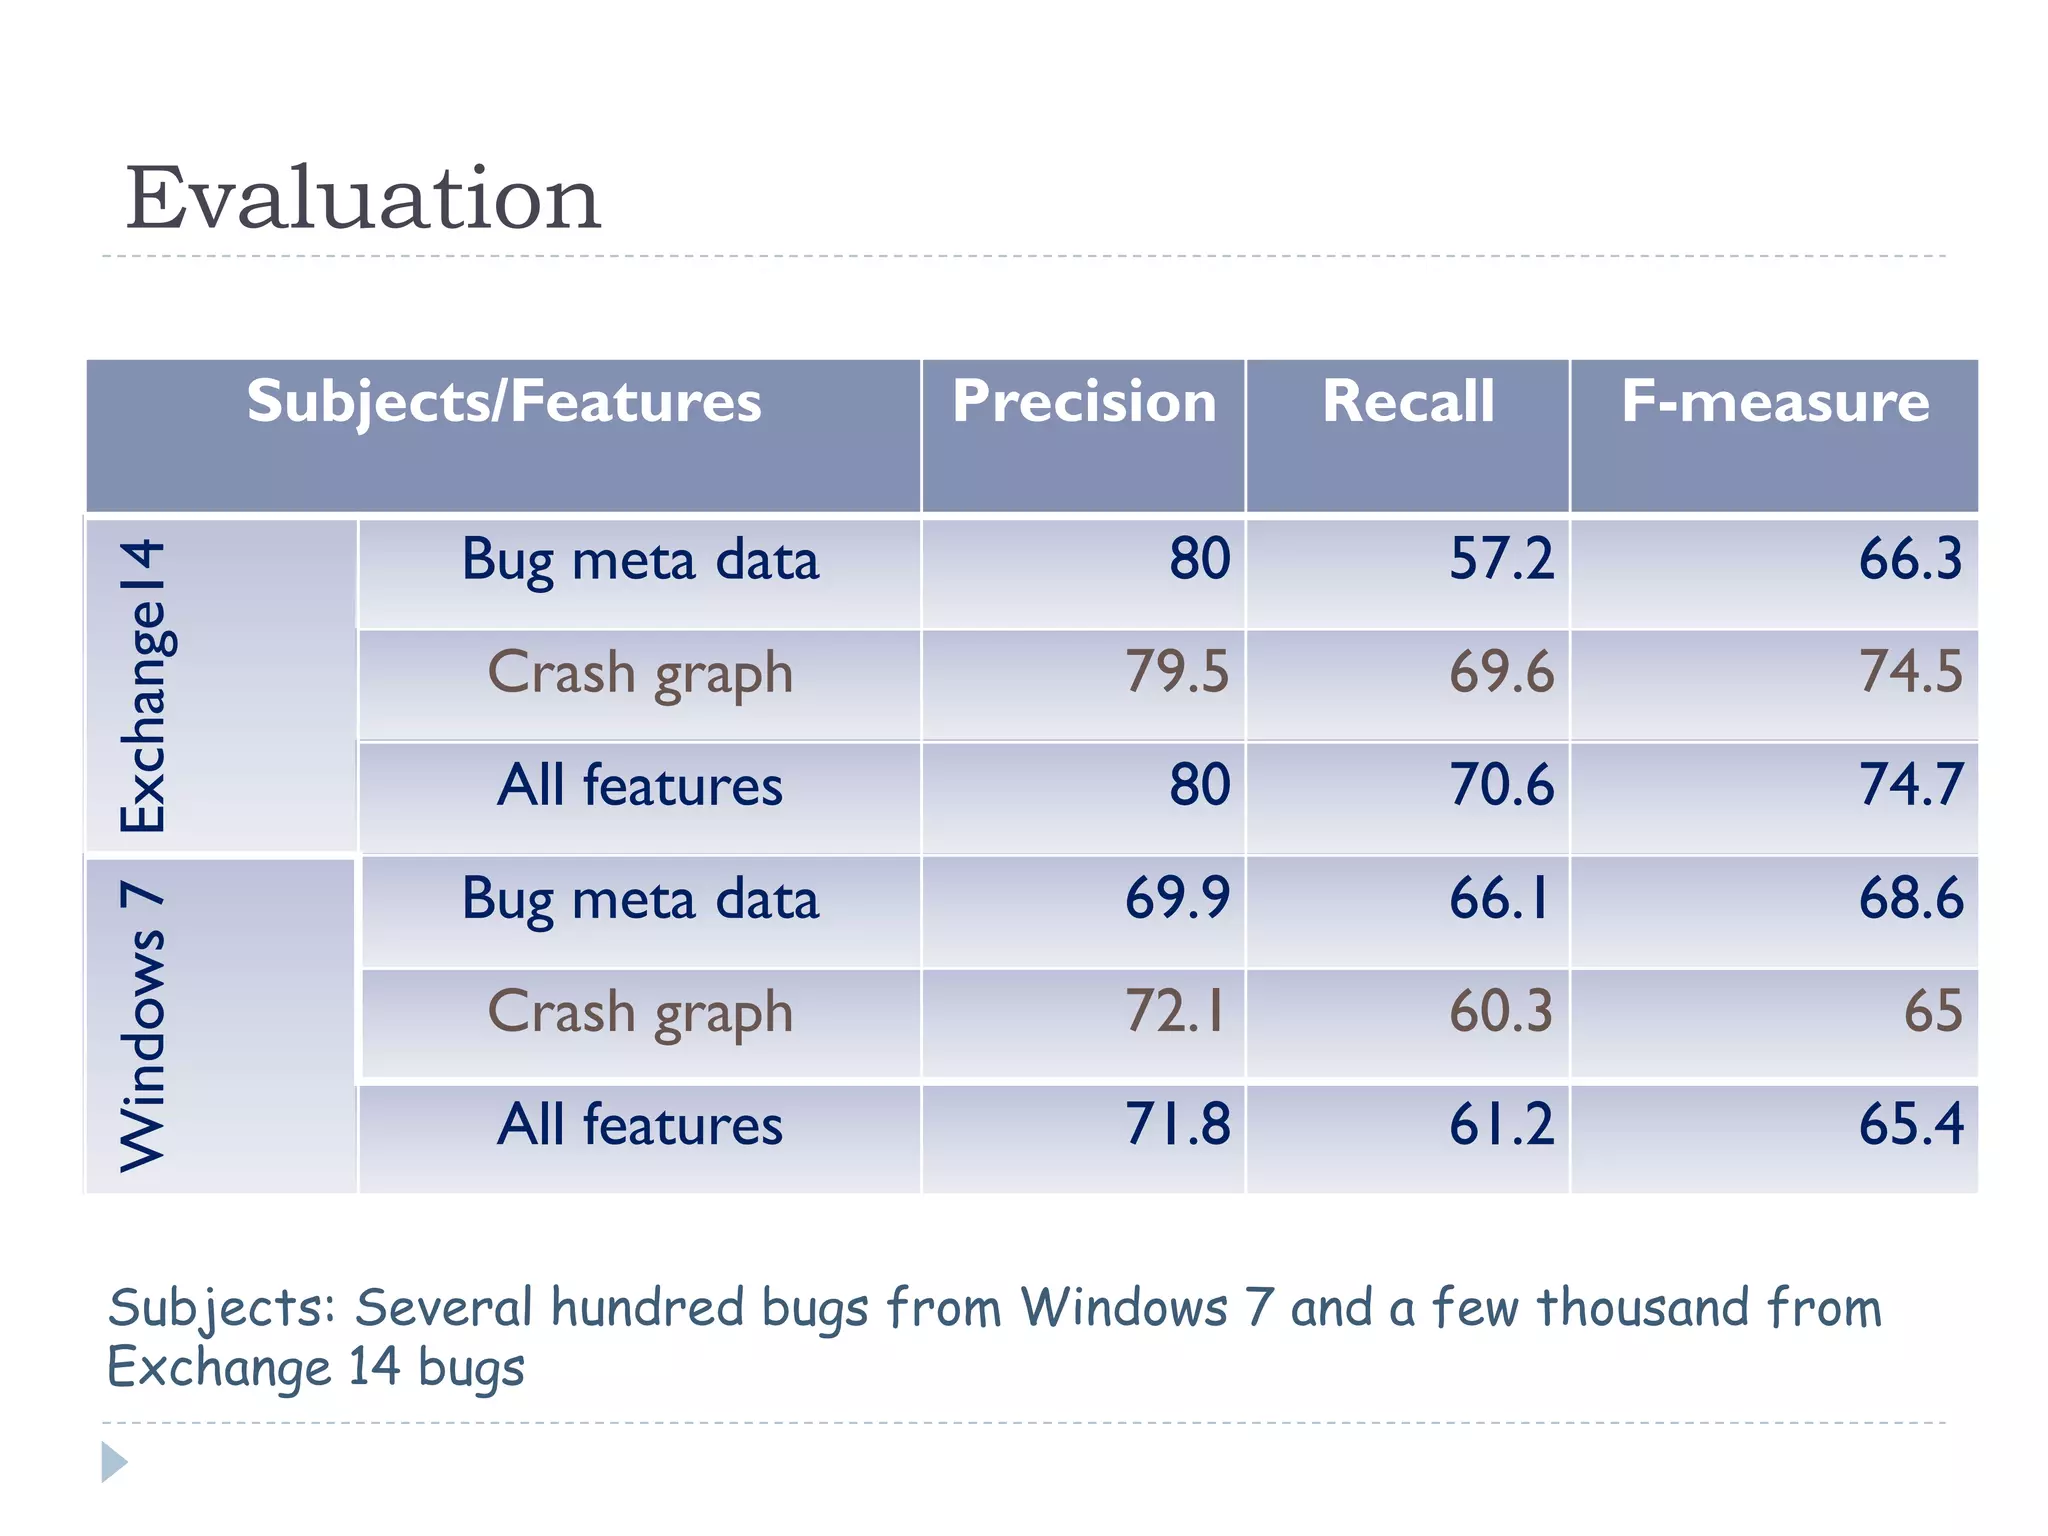
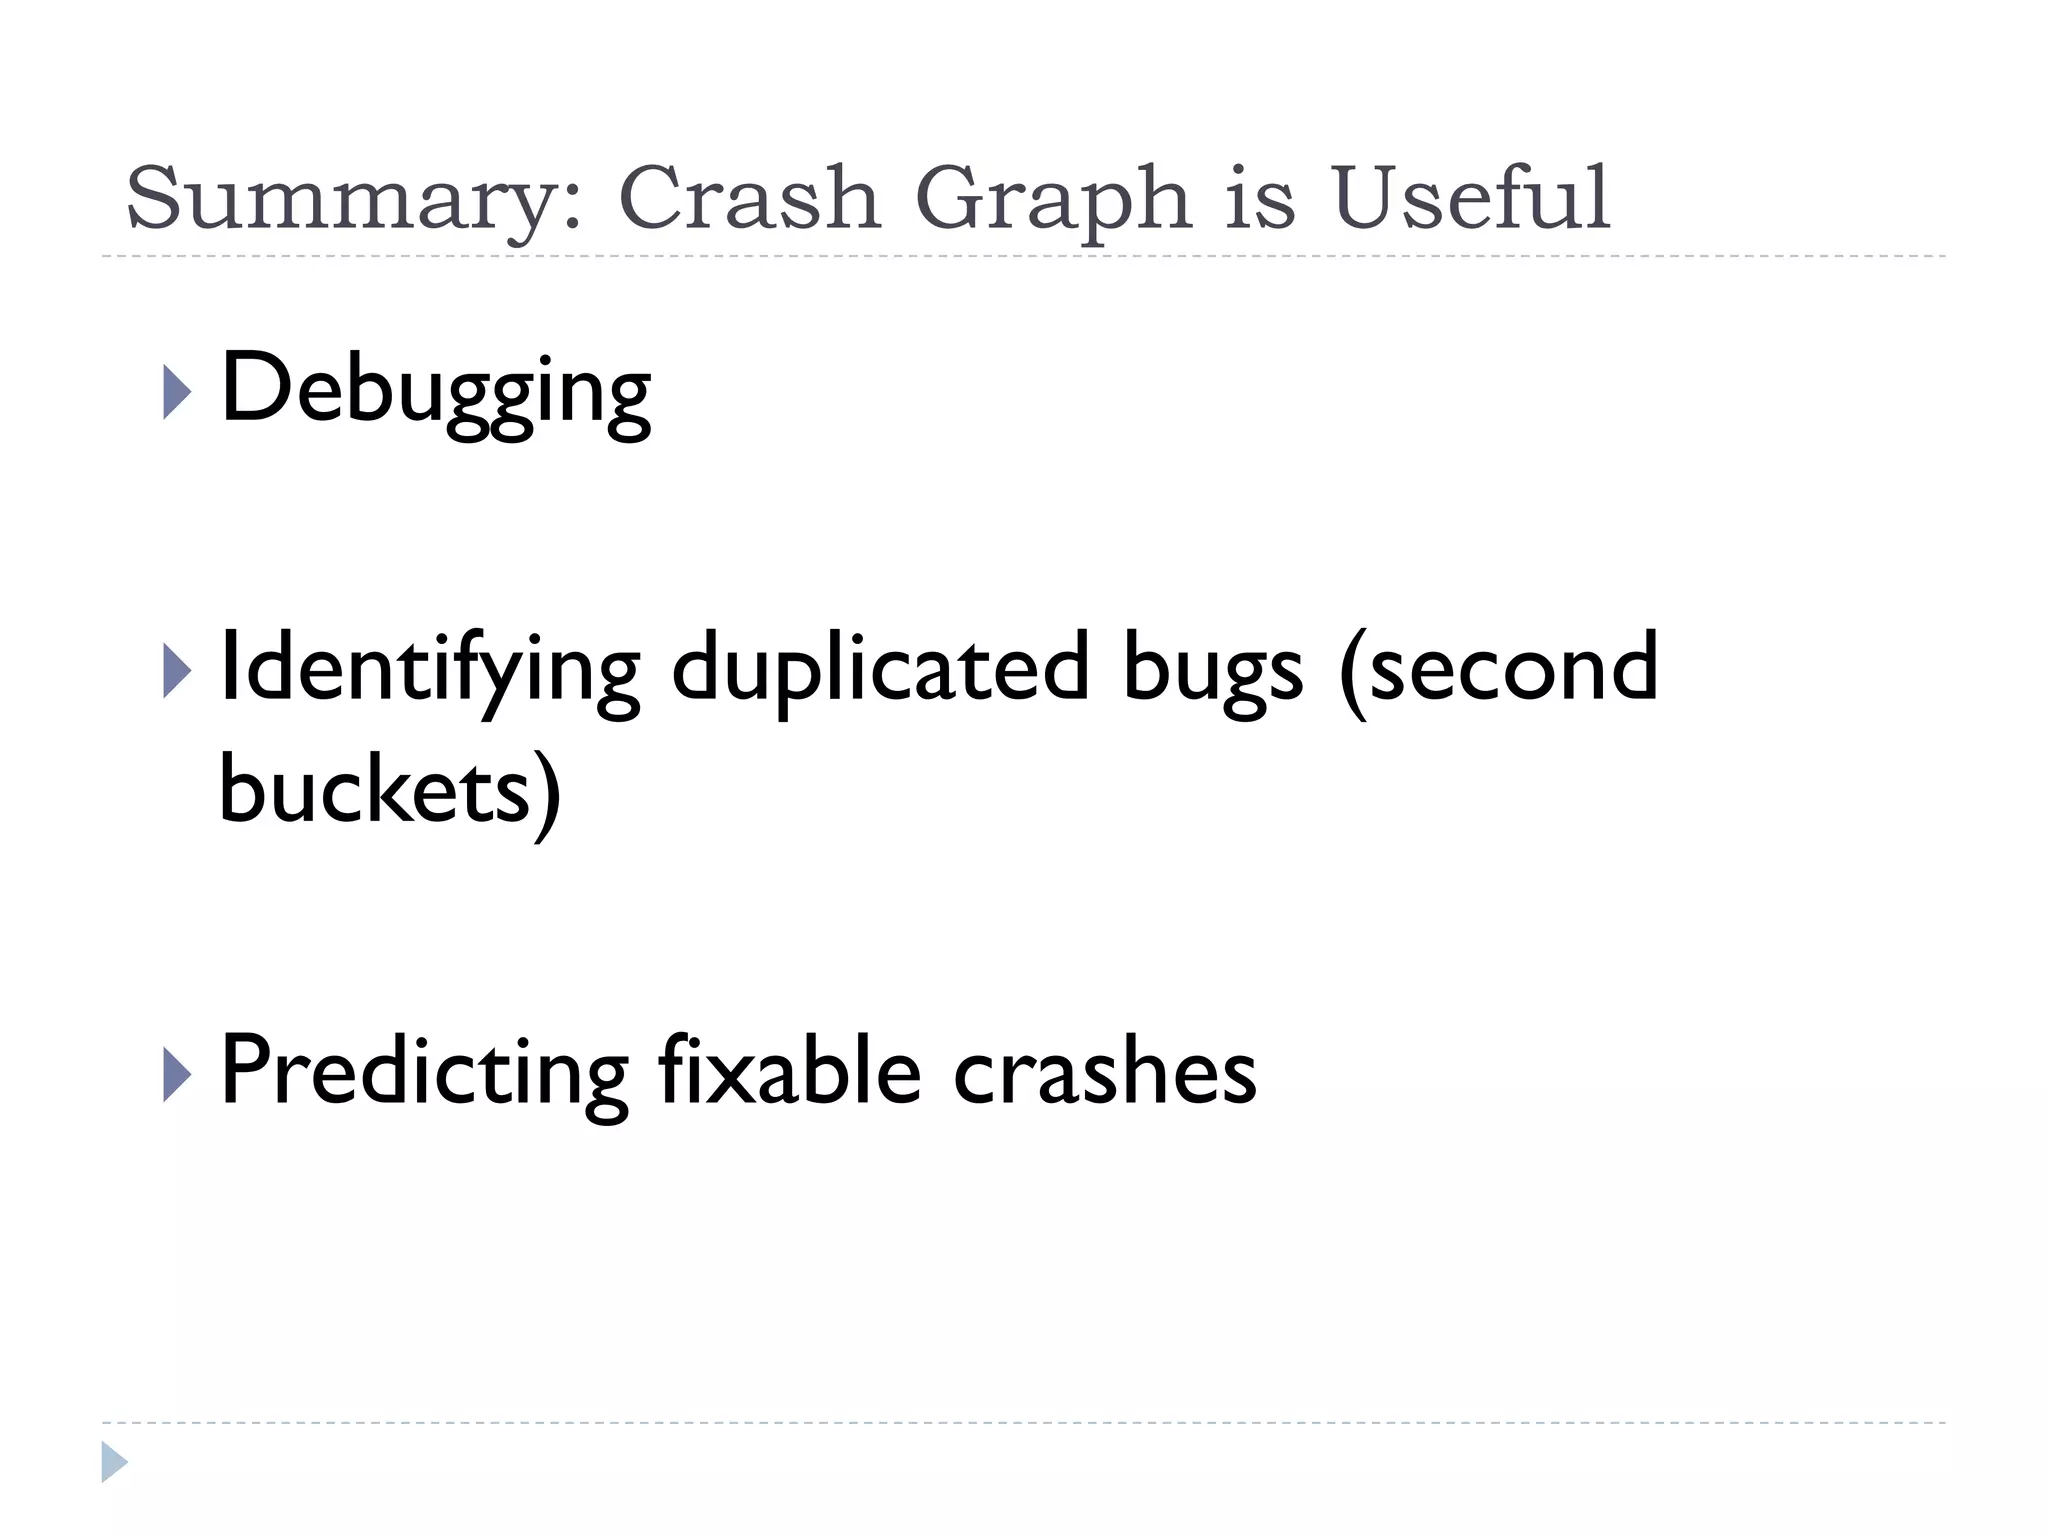
Crash Graphs: An aggregated view of
multiple crashes to improve crash triage

                                       Sung Kim (HKUST)
                 Tom Zimmermann and Nachi Nagappan (MSR)
Windows Error Reporting (WER) System

crashes
Windows Error Reporting (WER) System

Identifying
Crash causes
Windows Error Reporting (WER) System

bucketing
Windows Error Reporting (WER) System


             Bug      Bug      Bug
            report   report   report
              1        2        3

Reporting
bugs
Crash Graph
Aggregation of multiple crashes
Crash Graph


Trace 1   A   B   C D
Trace 2   A   E   F   G D
Trace 3   C D G D
Crash Graph

                                    A


Trace 1   A   B   C D           B

Trace 2   A   E   F   G D
Trace 3   C D G D
                            C


                            D
Crash Graph

                                    A


                                        E
Trace 1   A   B   C D           B

Trace 2   A   E   F   G D
Trace 3   C D G D                           F
                            C

                                        G

                            D
Crash Graph Example
Research Questions
}  RQ1: Is   it useful for debugging?

}  RQ2: Can
           this identify duplicated bugs
 (second buckets)

}  RQ3: Can
           this hold crash properties: can
 we predict fixable crashes?
RQ1: Useful for Debugging?
Evaluation
}  Find fixed bugs reported by Watson(autobug)
}  Draw crash graphs for the bugs
}  Send the graphs to the corresponding fixers
}  Ask fixers for comments
Developer feedback
}    “… the graph would be showing me that a single cab
      could not…”

}    “Your graph looks helpful…”

}    “Usually developers can guess 50-80% the crash
      causes by reading call traces. This graph can help
      developers to see all traces together”
RQ2: Detecting Duplicated Bugs


             Bug      Bug      Bug
            report   report   report
              1        2        3

Reporting
bugs
RQ2: Detecting Duplicated Bugs
                       Duplicated!


               Bug                       Bug          Bug
      Fixed   report                    report       report
                1                         2            3

Reporting
bugs


                                     Second bucket
Sub-graph similarity


                       ⊇
Sub-graph similarity

         !"#(​%↓'"( ,  ​%↓*#+,, )=​|​-↓'"(   ∩​  -↓*#+,, |/|​-↓*#+,, |    ,
  where E is the set of edges in G and |​-↓*#+,, |≤|​-↓'"( |.

                                              ⊇
Evaluation
                                     Bug ids      Dup?
                                  Bug 1   Bug 2
     Bug 1
                                  Bug 1   Bug 3
                   Duplicated!
     Bug 2                        Bug 1   Bug 4
                                  Bug 1   Bug 5
     Bug 3                        Bug 2   Bug 3
                                  Bug 2   Bug 4
     Bug 4          Duplicated!
                                  Bug 2   Bug 5

     Bug 5                        Bug 3   Bug 4
                                  Bug 3   Bug 5
From bug reports                  Bug 4   Bug 5
Evaluation
                Bug ids      Dup?
             Bug 1   Bug 2
             Bug 1   Bug 3
             Bug 1   Bug 4
             Bug 1   Bug 5
             Bug 2   Bug 3
             Bug 2   Bug 4
             Bug 2   Bug 5
             Bug 3   Bug 4
             Bug 3   Bug 5
             Bug 4   Bug 5
Similarity Computation
     Bug ids       Dup?             Similarity   Dup?   threshold=0.9
  Bug 1   Bug 2                       0.85
  Bug 1   Bug 3                       0.95
  Bug 1   Bug 4                        0.8
  Bug 1   Bug 5                        0.7
  Bug 2   Bug 3                        0.8
  Bug 2   Bug 4                        0.8
  Bug 2   Bug 5                        0.1
  Bug 3   Bug 4                        0.4
  Bug 3   Bug 5                       0.96
  Bug 4   Bug 5                        0.2

               Precision= 50%, recall = 50%
Subject (WinOS Bugs)

         Name                Value
         # of bug reports                   X
     # of duplicated bugs               13.3%
       # of total bug pair           (X*X-1/2)

  # of duplicated bug pair              0.32%

  # of non-duplicated bug            Remaining
Dup-detection Results

 Similarity    Precision          Recall
 threshold
           1           *70.3               58.8
       0.99                71.5            62.4
       0.98                71.0            63.6
       0.97                68.4            64.2
       0.96                65.0            64.2
       0.95                61.6            64.2
Why Crash Graph Works?
}  Uses   all traces to compare


                     trace1
Why Crash Graph Works?
}  Uses   all traces to compare


            trace1
Why Crash Graph Works?
}  Uses   all traces to compare


                     90%   trace 2

            trace1
Why Crash Graph Works?
}  Uses   all traces to compare


            trace1


            trace 2
Why Crash Graph Works?
}  Uses   all traces to compare


                      80%   trace 3

            trace1


            trace 2
Why Crash Graph Works?
}  Uses   all traces to compare


            trace1                 trace 3


            trace 2
Why Crash Graph Works?
}  Uses   all traces to compare


            trace1                 trace 3

                          90%
            trace 2
Why Crash Graph Works?
}  Partial    traces

Bucket 1
 Trace 1   A   B   C D
 Trace 2   D   E   F   G H


Bucket 2
 Trace 3   C D     E   F
RQ3: Predicting Fixable Crashes
}  Not all crashes will be fixed
}  There are too many crashes
}  Can we prioritize developers’ effort?
 }  If we know which crashes are likely to be fixed
 }  Developers can focus on these first
Extracting Features


                      Features   values
                      Node #       7
                      Edge #       5
                      Max-in       4
                      Max-out      2


    Crash graph
Extracting Features
                     Bug id           Features            Fixed?
                          1   0   1   3   1     1   5 1
                          2   1   1   2   1     3   1 1
                          3   1   1   1   5     1   0 1


                                      Machine
1   1   2   1   3   1 0               learner                      Fixable!
Results

                       Subjects/Features      Precision   Recall     F-measure
Windows 7 Exchange14


                              Crash graph          79.5       69.6         74.5


                              Bug meta data        69.9       66.1         68.6
                              Crash graph          72.1       60.3           65
                               All features        71.8       61.2         65.4

Subjects: Several hundred bugs from Windows 7 and a few thousand from
Exchange 14 bugs
Results

                       Subjects/Features      Precision   Recall     F-measure

                              Bug meta data          80       57.2         66.3
Windows 7 Exchange14


                              Crash graph          79.5       69.6         74.5
                               All features          80       70.6         74.7
                              Bug meta data        69.9       66.1         68.6
                              Crash graph          72.1       60.3           65
                               All features        71.8       61.2         65.4

Subjects: Several hundred bugs from Windows 7 and a few thousand from
Exchange 14 bugs
Evaluation

                       Subjects/Features      Precision   Recall     F-measure

                              Bug meta data          80       57.2         66.3
Windows 7 Exchange14


                              Crash graph          79.5       69.6         74.5
                               All features          80       70.6         74.7
                              Bug meta data        69.9       66.1         68.6
                              Crash graph          72.1       60.3           65
                               All features        71.8       61.2         65.4

Subjects: Several hundred bugs from Windows 7 and a few thousand from
Exchange 14 bugs
Summary: Crash Graph is Useful

}  Debugging


}  Identifying   duplicated bugs (second
 buckets)

}  Predicting    fixable crashes
Future Work
}          Interactive Crash Graphs
}          Other trace clustering algorithms
       Crash topic analysis
      } 
}  Applying crash graphs for other problems
   }  One-hit buckets
"Crash Graphs: An Aggregated View of Multiple Crashes to Improve Crash Triage" by Sunghun Kim, Thomas Zimmermann and Nachiappan Nagappan.

"Crash Graphs: An Aggregated View of Multiple Crashes to Improve Crash Triage" by Sunghun Kim, Thomas Zimmermann and Nachiappan Nagappan.

  • 1.
    Crash Graphs: Anaggregated view of multiple crashes to improve crash triage Sung Kim (HKUST) Tom Zimmermann and Nachi Nagappan (MSR)
  • 2.
  • 3.
  • 4.
    Windows Error Reporting(WER) System crashes
  • 5.
    Windows Error Reporting(WER) System Identifying Crash causes
  • 6.
    Windows Error Reporting(WER) System bucketing
  • 7.
  • 8.
    Windows Error Reporting(WER) System Bug Bug Bug report report report 1 2 3 Reporting bugs
  • 9.
  • 10.
    Crash Graph Trace 1 A B C D Trace 2 A E F G D Trace 3 C D G D
  • 11.
    Crash Graph A Trace 1 A B C D B Trace 2 A E F G D Trace 3 C D G D C D
  • 12.
    Crash Graph A E Trace 1 A B C D B Trace 2 A E F G D Trace 3 C D G D F C G D
  • 13.
    Crash Graph A E Trace 1 A B C D B Trace 2 A E F G D Trace 3 C D G D F C G D
  • 14.
    Crash Graph A E Trace 1 A B C D B Trace 2 A E F G D Trace 3 C D G D F C G D
  • 15.
  • 16.
    Research Questions }  RQ1:Is it useful for debugging? }  RQ2: Can this identify duplicated bugs (second buckets) }  RQ3: Can this hold crash properties: can we predict fixable crashes?
  • 17.
    RQ1: Useful forDebugging?
  • 18.
    Evaluation }  Find fixedbugs reported by Watson(autobug) }  Draw crash graphs for the bugs }  Send the graphs to the corresponding fixers }  Ask fixers for comments
  • 19.
    Developer feedback }  “… the graph would be showing me that a single cab could not…” }  “Your graph looks helpful…” }  “Usually developers can guess 50-80% the crash causes by reading call traces. This graph can help developers to see all traces together”
  • 20.
    RQ2: Detecting DuplicatedBugs Bug Bug Bug report report report 1 2 3 Reporting bugs
  • 21.
    RQ2: Detecting DuplicatedBugs Duplicated! Bug Bug Bug Fixed report report report 1 2 3 Reporting bugs Second bucket
  • 22.
  • 23.
    Sub-graph similarity !"#(​%↓'"( ,  ​%↓*#+,, )=​|​-↓'"(   ∩​  -↓*#+,, |/|​-↓*#+,, |  , where E is the set of edges in G and |​-↓*#+,, |≤|​-↓'"( |. ⊇
  • 24.
    Evaluation Bug ids Dup? Bug 1 Bug 2 Bug 1 Bug 1 Bug 3 Duplicated! Bug 2 Bug 1 Bug 4 Bug 1 Bug 5 Bug 3 Bug 2 Bug 3 Bug 2 Bug 4 Bug 4 Duplicated! Bug 2 Bug 5 Bug 5 Bug 3 Bug 4 Bug 3 Bug 5 From bug reports Bug 4 Bug 5
  • 25.
    Evaluation Bug ids Dup? Bug 1 Bug 2 Bug 1 Bug 3 Bug 1 Bug 4 Bug 1 Bug 5 Bug 2 Bug 3 Bug 2 Bug 4 Bug 2 Bug 5 Bug 3 Bug 4 Bug 3 Bug 5 Bug 4 Bug 5
  • 26.
    Similarity Computation Bug ids Dup? Similarity Dup? threshold=0.9 Bug 1 Bug 2 0.85 Bug 1 Bug 3 0.95 Bug 1 Bug 4 0.8 Bug 1 Bug 5 0.7 Bug 2 Bug 3 0.8 Bug 2 Bug 4 0.8 Bug 2 Bug 5 0.1 Bug 3 Bug 4 0.4 Bug 3 Bug 5 0.96 Bug 4 Bug 5 0.2 Precision= 50%, recall = 50%
  • 27.
    Subject (WinOS Bugs) Name Value # of bug reports X # of duplicated bugs 13.3% # of total bug pair (X*X-1/2) # of duplicated bug pair 0.32% # of non-duplicated bug Remaining
  • 28.
    Dup-detection Results Similarity Precision Recall threshold 1 *70.3 58.8 0.99 71.5 62.4 0.98 71.0 63.6 0.97 68.4 64.2 0.96 65.0 64.2 0.95 61.6 64.2
  • 29.
    Why Crash GraphWorks? }  Uses all traces to compare trace1
  • 30.
    Why Crash GraphWorks? }  Uses all traces to compare trace1
  • 31.
    Why Crash GraphWorks? }  Uses all traces to compare 90% trace 2 trace1
  • 32.
    Why Crash GraphWorks? }  Uses all traces to compare trace1 trace 2
  • 33.
    Why Crash GraphWorks? }  Uses all traces to compare 80% trace 3 trace1 trace 2
  • 34.
    Why Crash GraphWorks? }  Uses all traces to compare trace1 trace 3 trace 2
  • 35.
    Why Crash GraphWorks? }  Uses all traces to compare trace1 trace 3 90% trace 2
  • 36.
    Why Crash GraphWorks? }  Partial traces Bucket 1 Trace 1 A B C D Trace 2 D E F G H Bucket 2 Trace 3 C D E F
  • 37.
    RQ3: Predicting FixableCrashes }  Not all crashes will be fixed }  There are too many crashes }  Can we prioritize developers’ effort? }  If we know which crashes are likely to be fixed }  Developers can focus on these first
  • 38.
    Extracting Features Features values Node # 7 Edge # 5 Max-in 4 Max-out 2 Crash graph
  • 39.
    Extracting Features Bug id Features Fixed? 1 0 1 3 1 1 5 1 2 1 1 2 1 3 1 1 3 1 1 1 5 1 0 1 Machine 1 1 2 1 3 1 0 learner Fixable!
  • 40.
    Results Subjects/Features Precision Recall F-measure Windows 7 Exchange14 Crash graph 79.5 69.6 74.5 Bug meta data 69.9 66.1 68.6 Crash graph 72.1 60.3 65 All features 71.8 61.2 65.4 Subjects: Several hundred bugs from Windows 7 and a few thousand from Exchange 14 bugs
  • 41.
    Results Subjects/Features Precision Recall F-measure Bug meta data 80 57.2 66.3 Windows 7 Exchange14 Crash graph 79.5 69.6 74.5 All features 80 70.6 74.7 Bug meta data 69.9 66.1 68.6 Crash graph 72.1 60.3 65 All features 71.8 61.2 65.4 Subjects: Several hundred bugs from Windows 7 and a few thousand from Exchange 14 bugs
  • 42.
    Evaluation Subjects/Features Precision Recall F-measure Bug meta data 80 57.2 66.3 Windows 7 Exchange14 Crash graph 79.5 69.6 74.5 All features 80 70.6 74.7 Bug meta data 69.9 66.1 68.6 Crash graph 72.1 60.3 65 All features 71.8 61.2 65.4 Subjects: Several hundred bugs from Windows 7 and a few thousand from Exchange 14 bugs
  • 43.
    Summary: Crash Graphis Useful }  Debugging }  Identifying duplicated bugs (second buckets) }  Predicting fixable crashes
  • 44.
    Future Work }  Interactive Crash Graphs }  Other trace clustering algorithms Crash topic analysis }  }  Applying crash graphs for other problems }  One-hit buckets