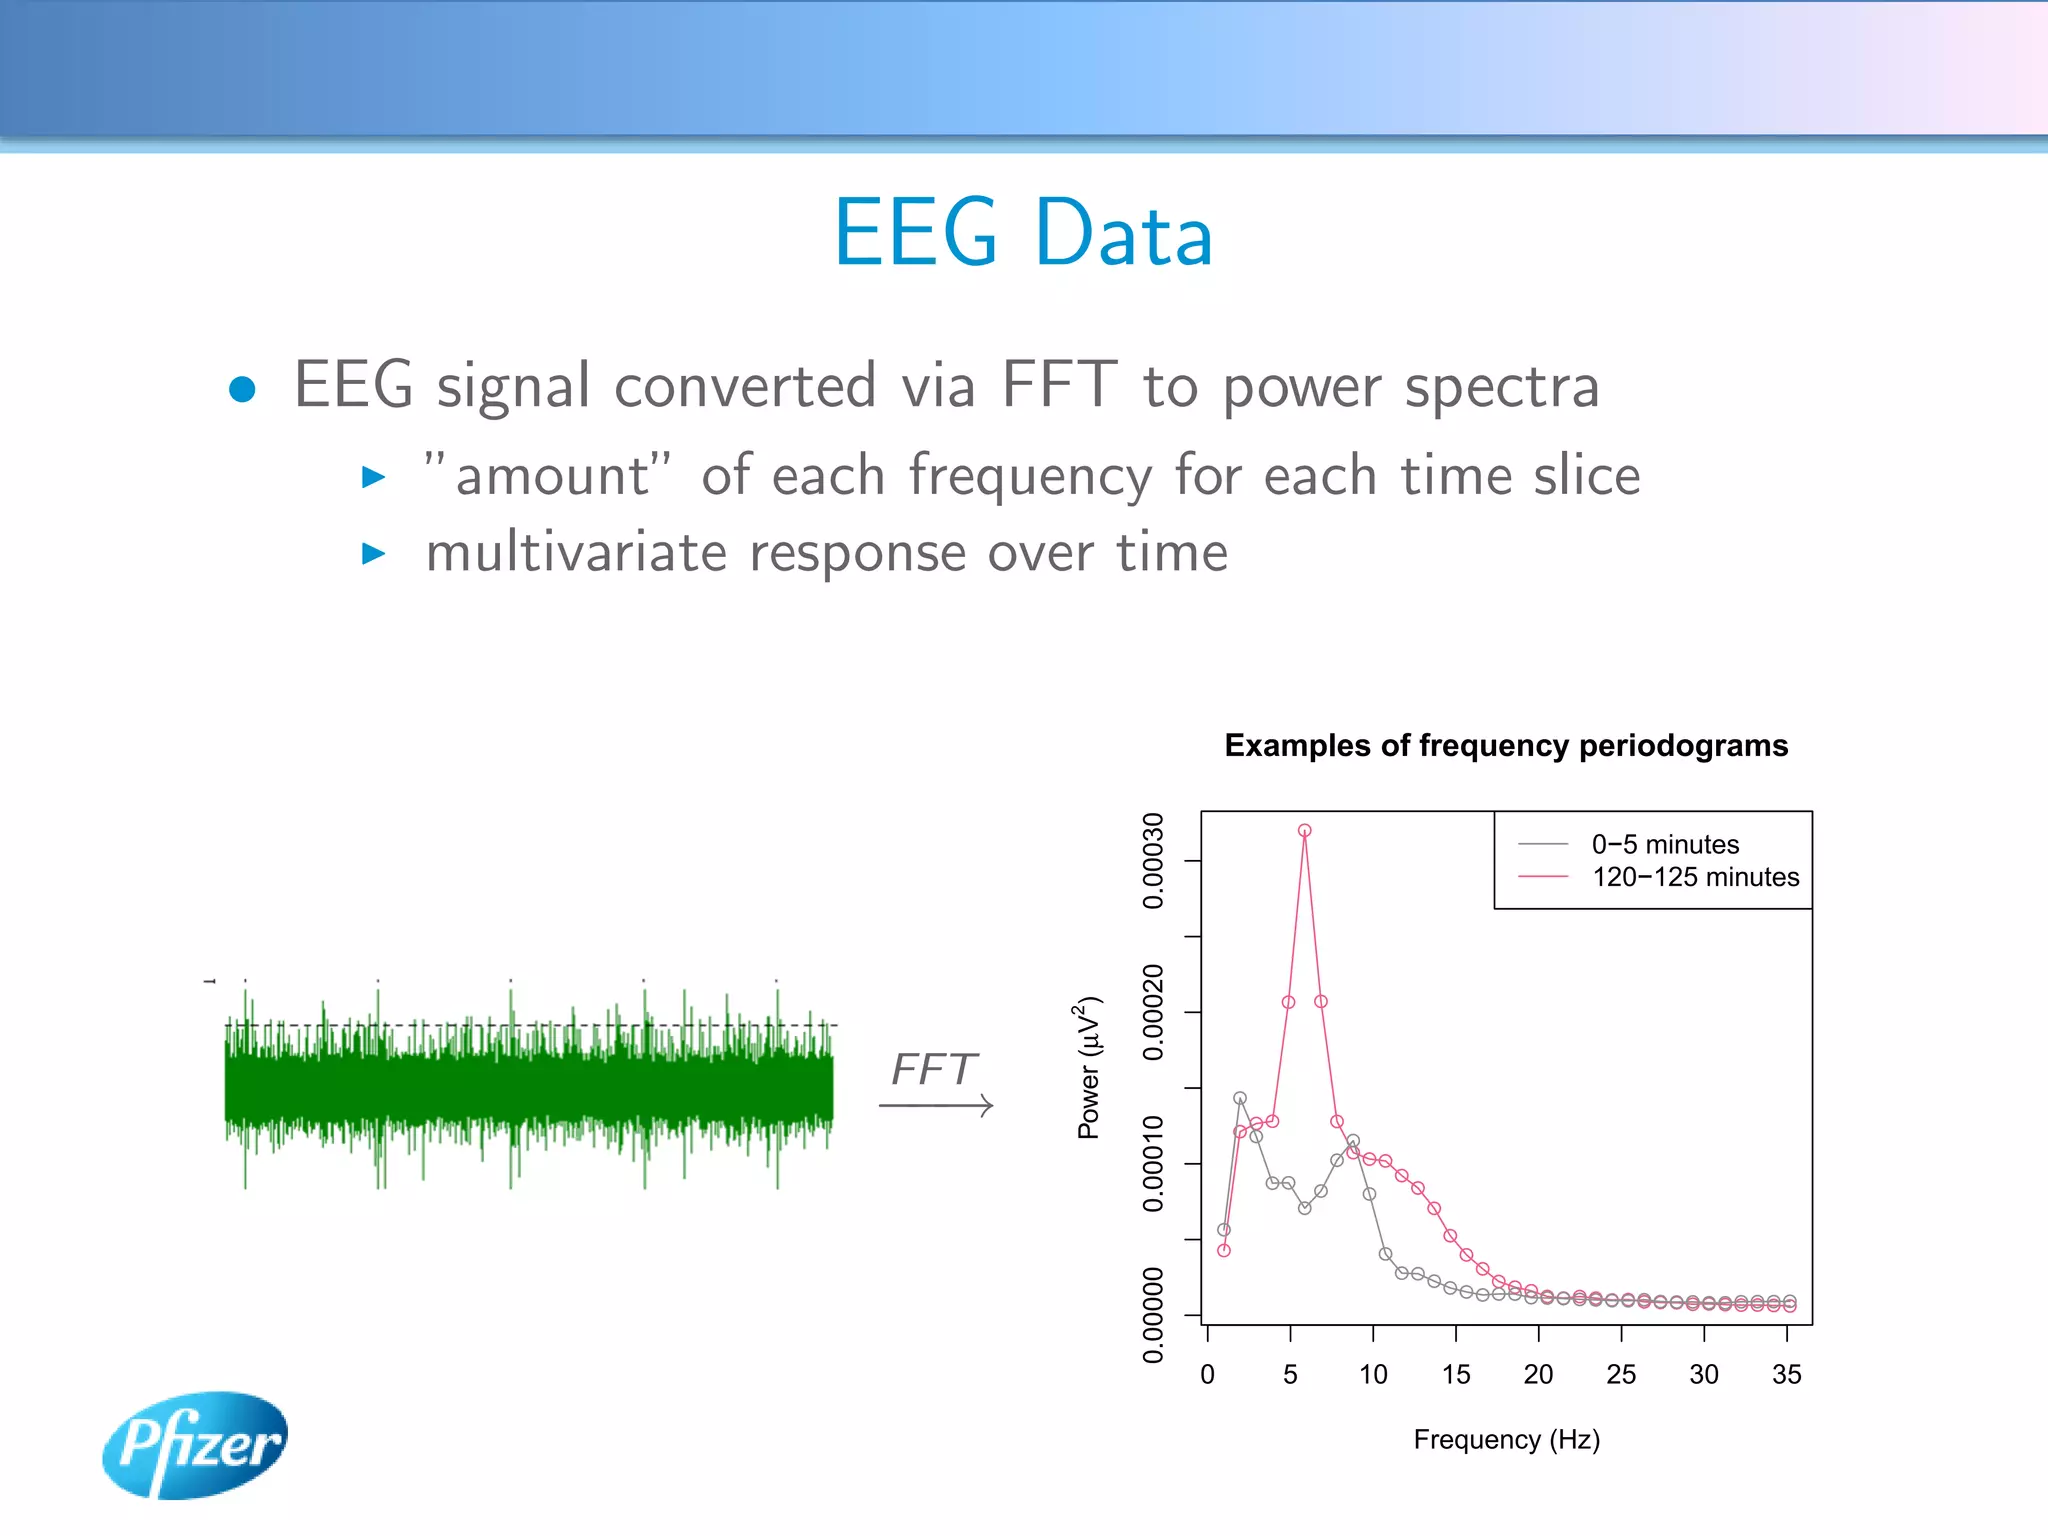
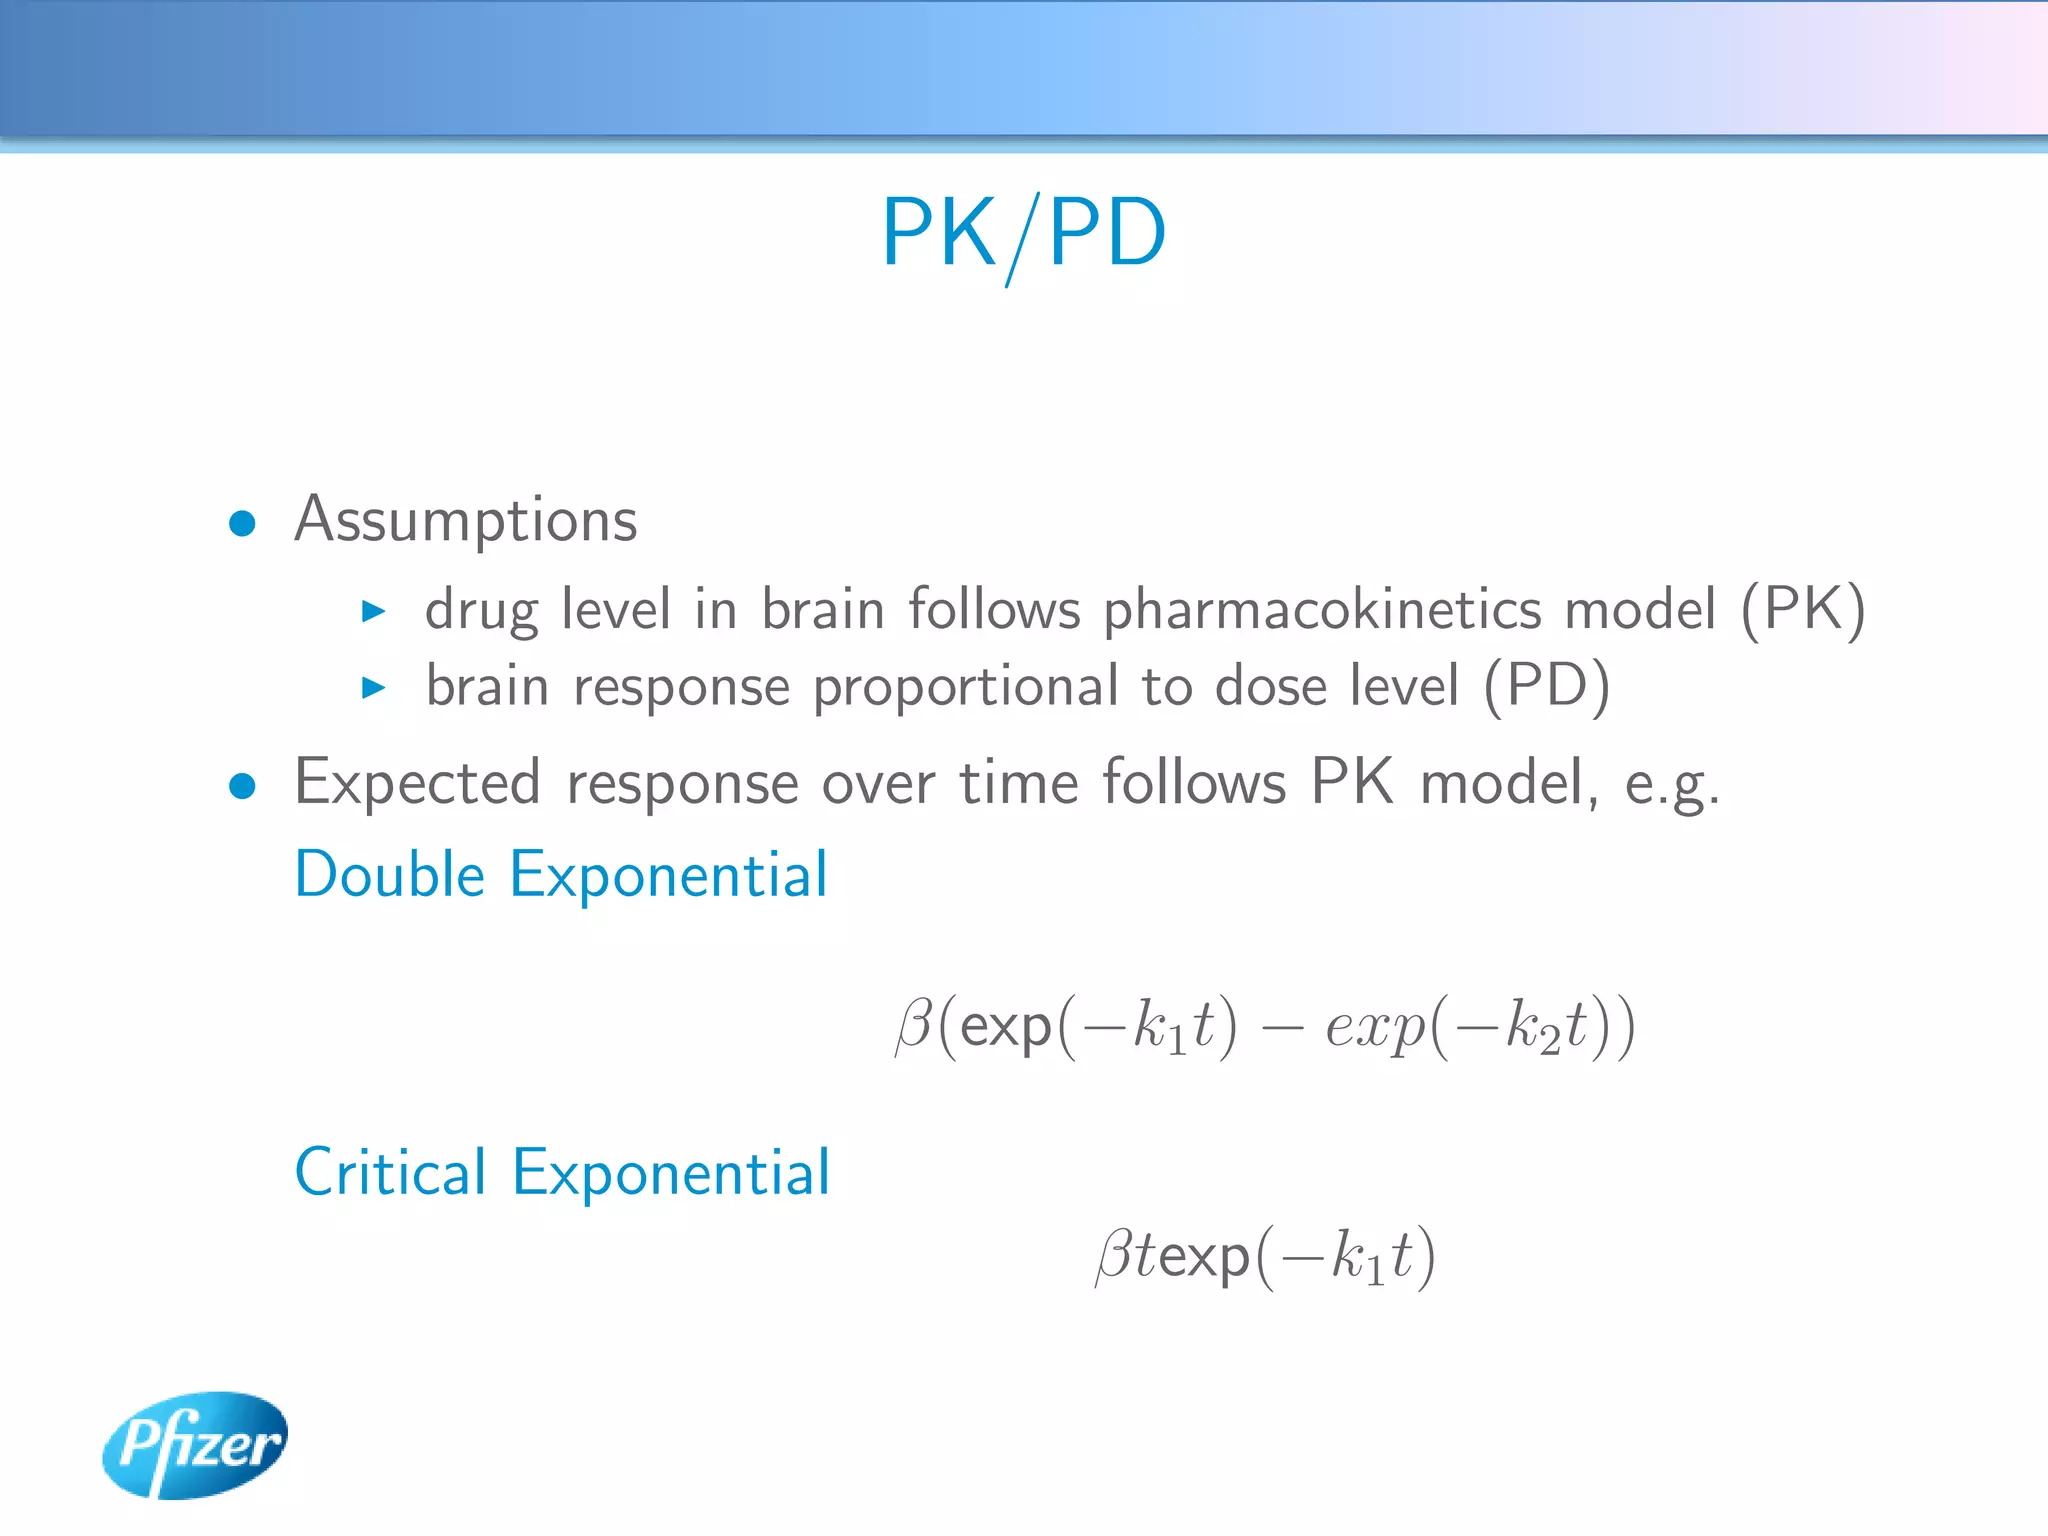
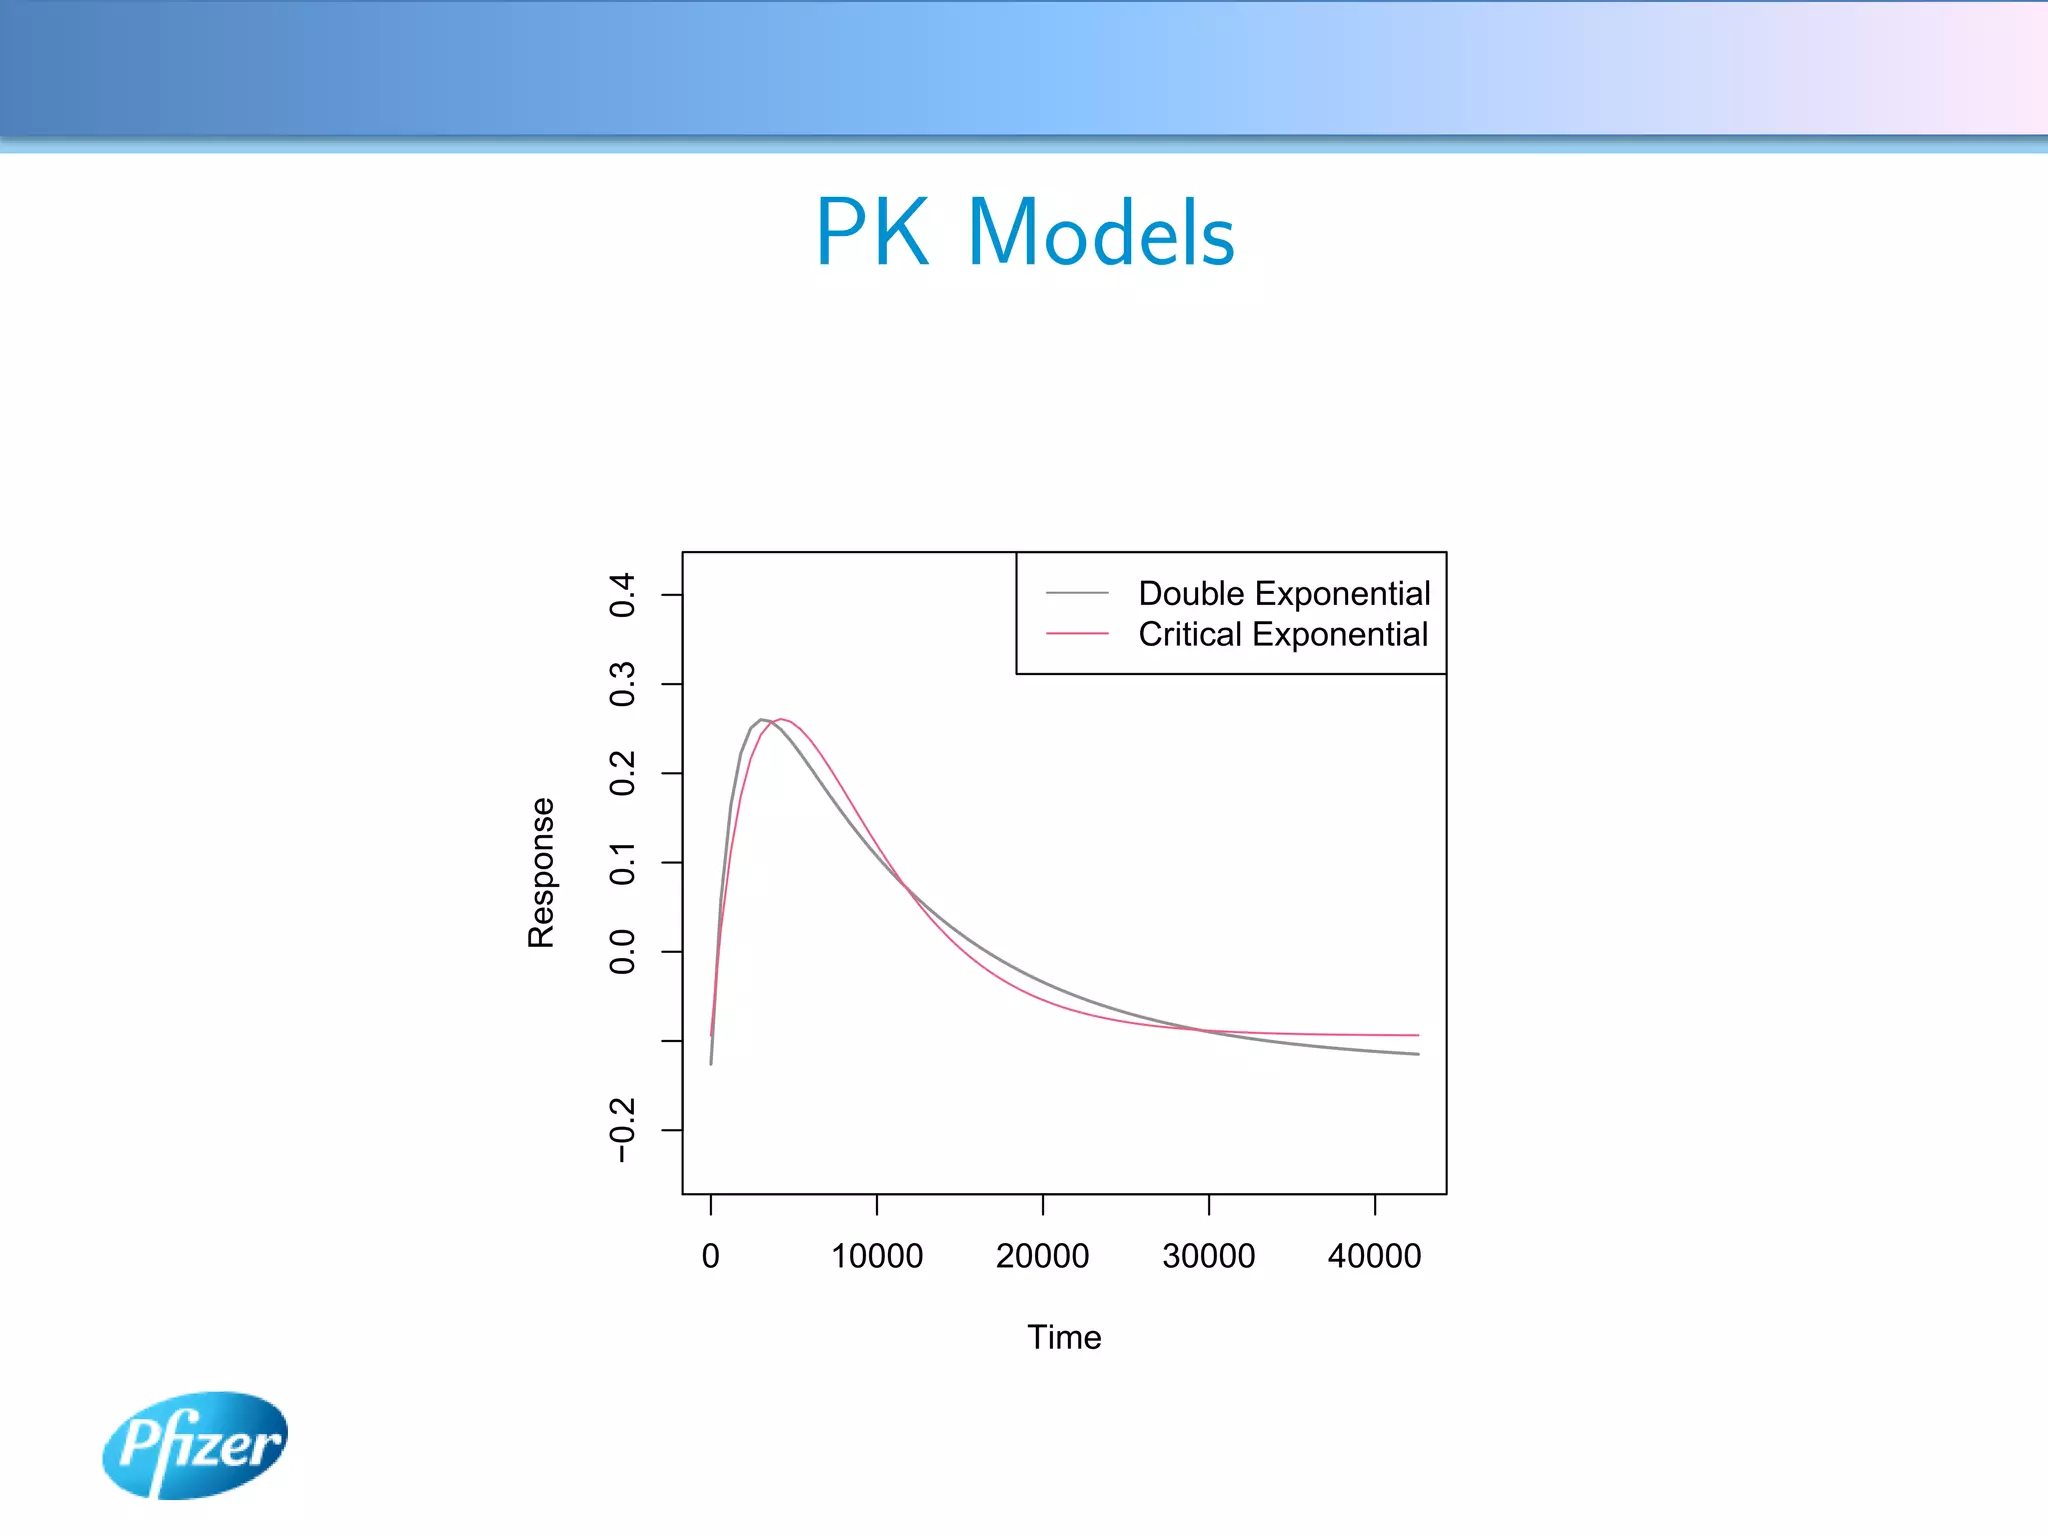
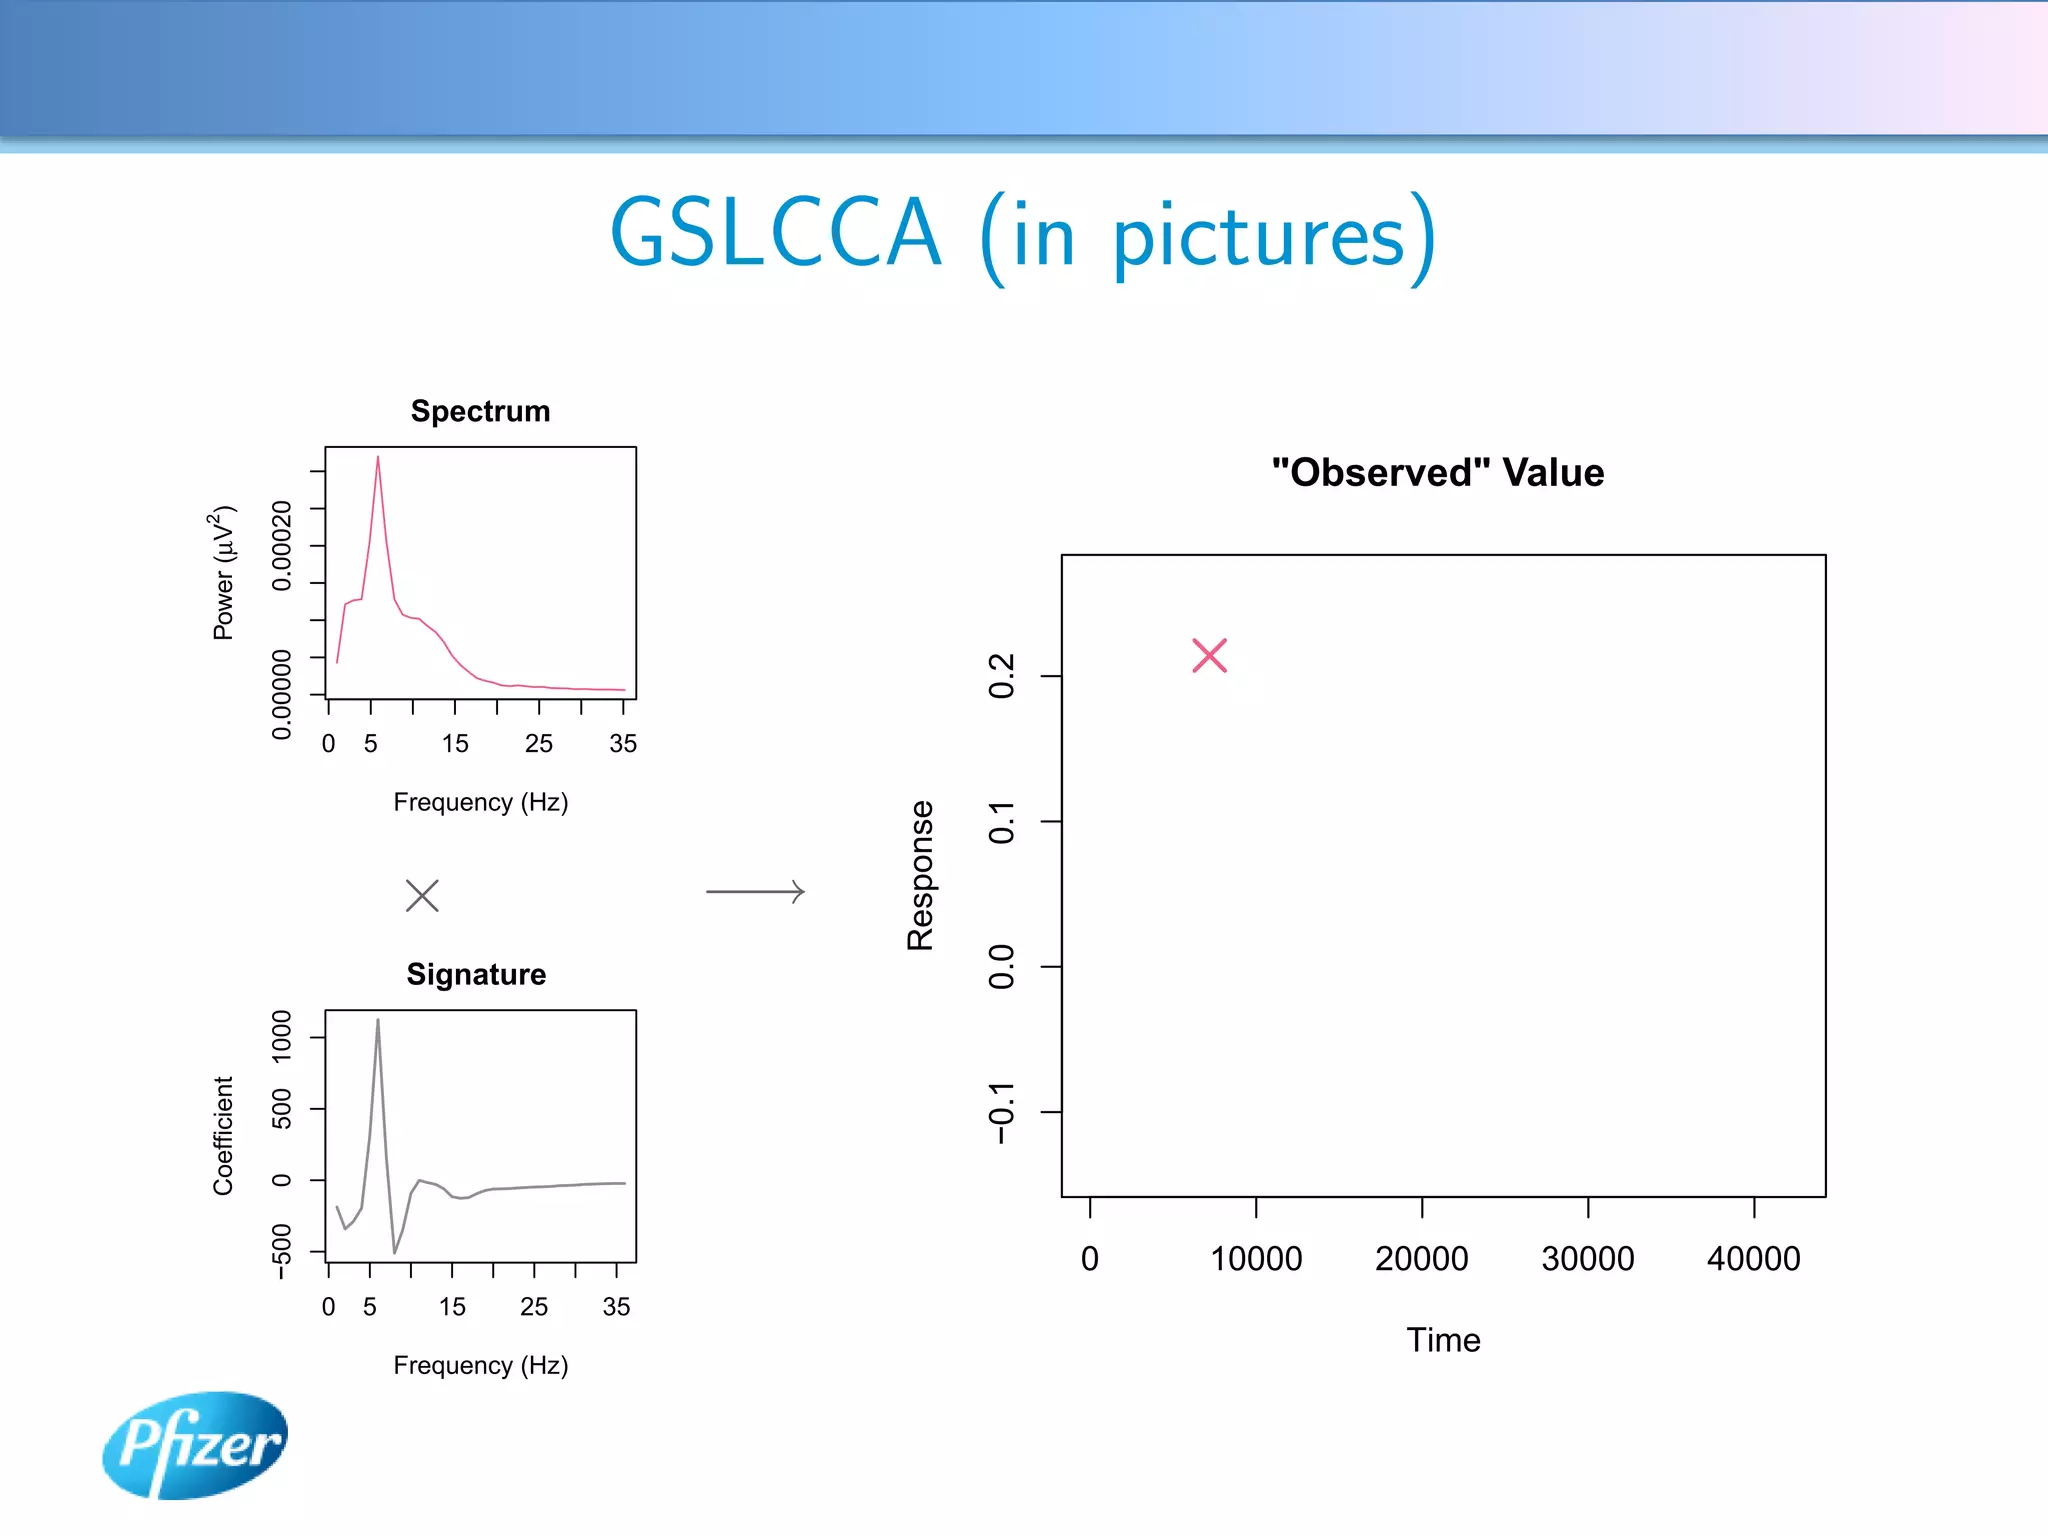
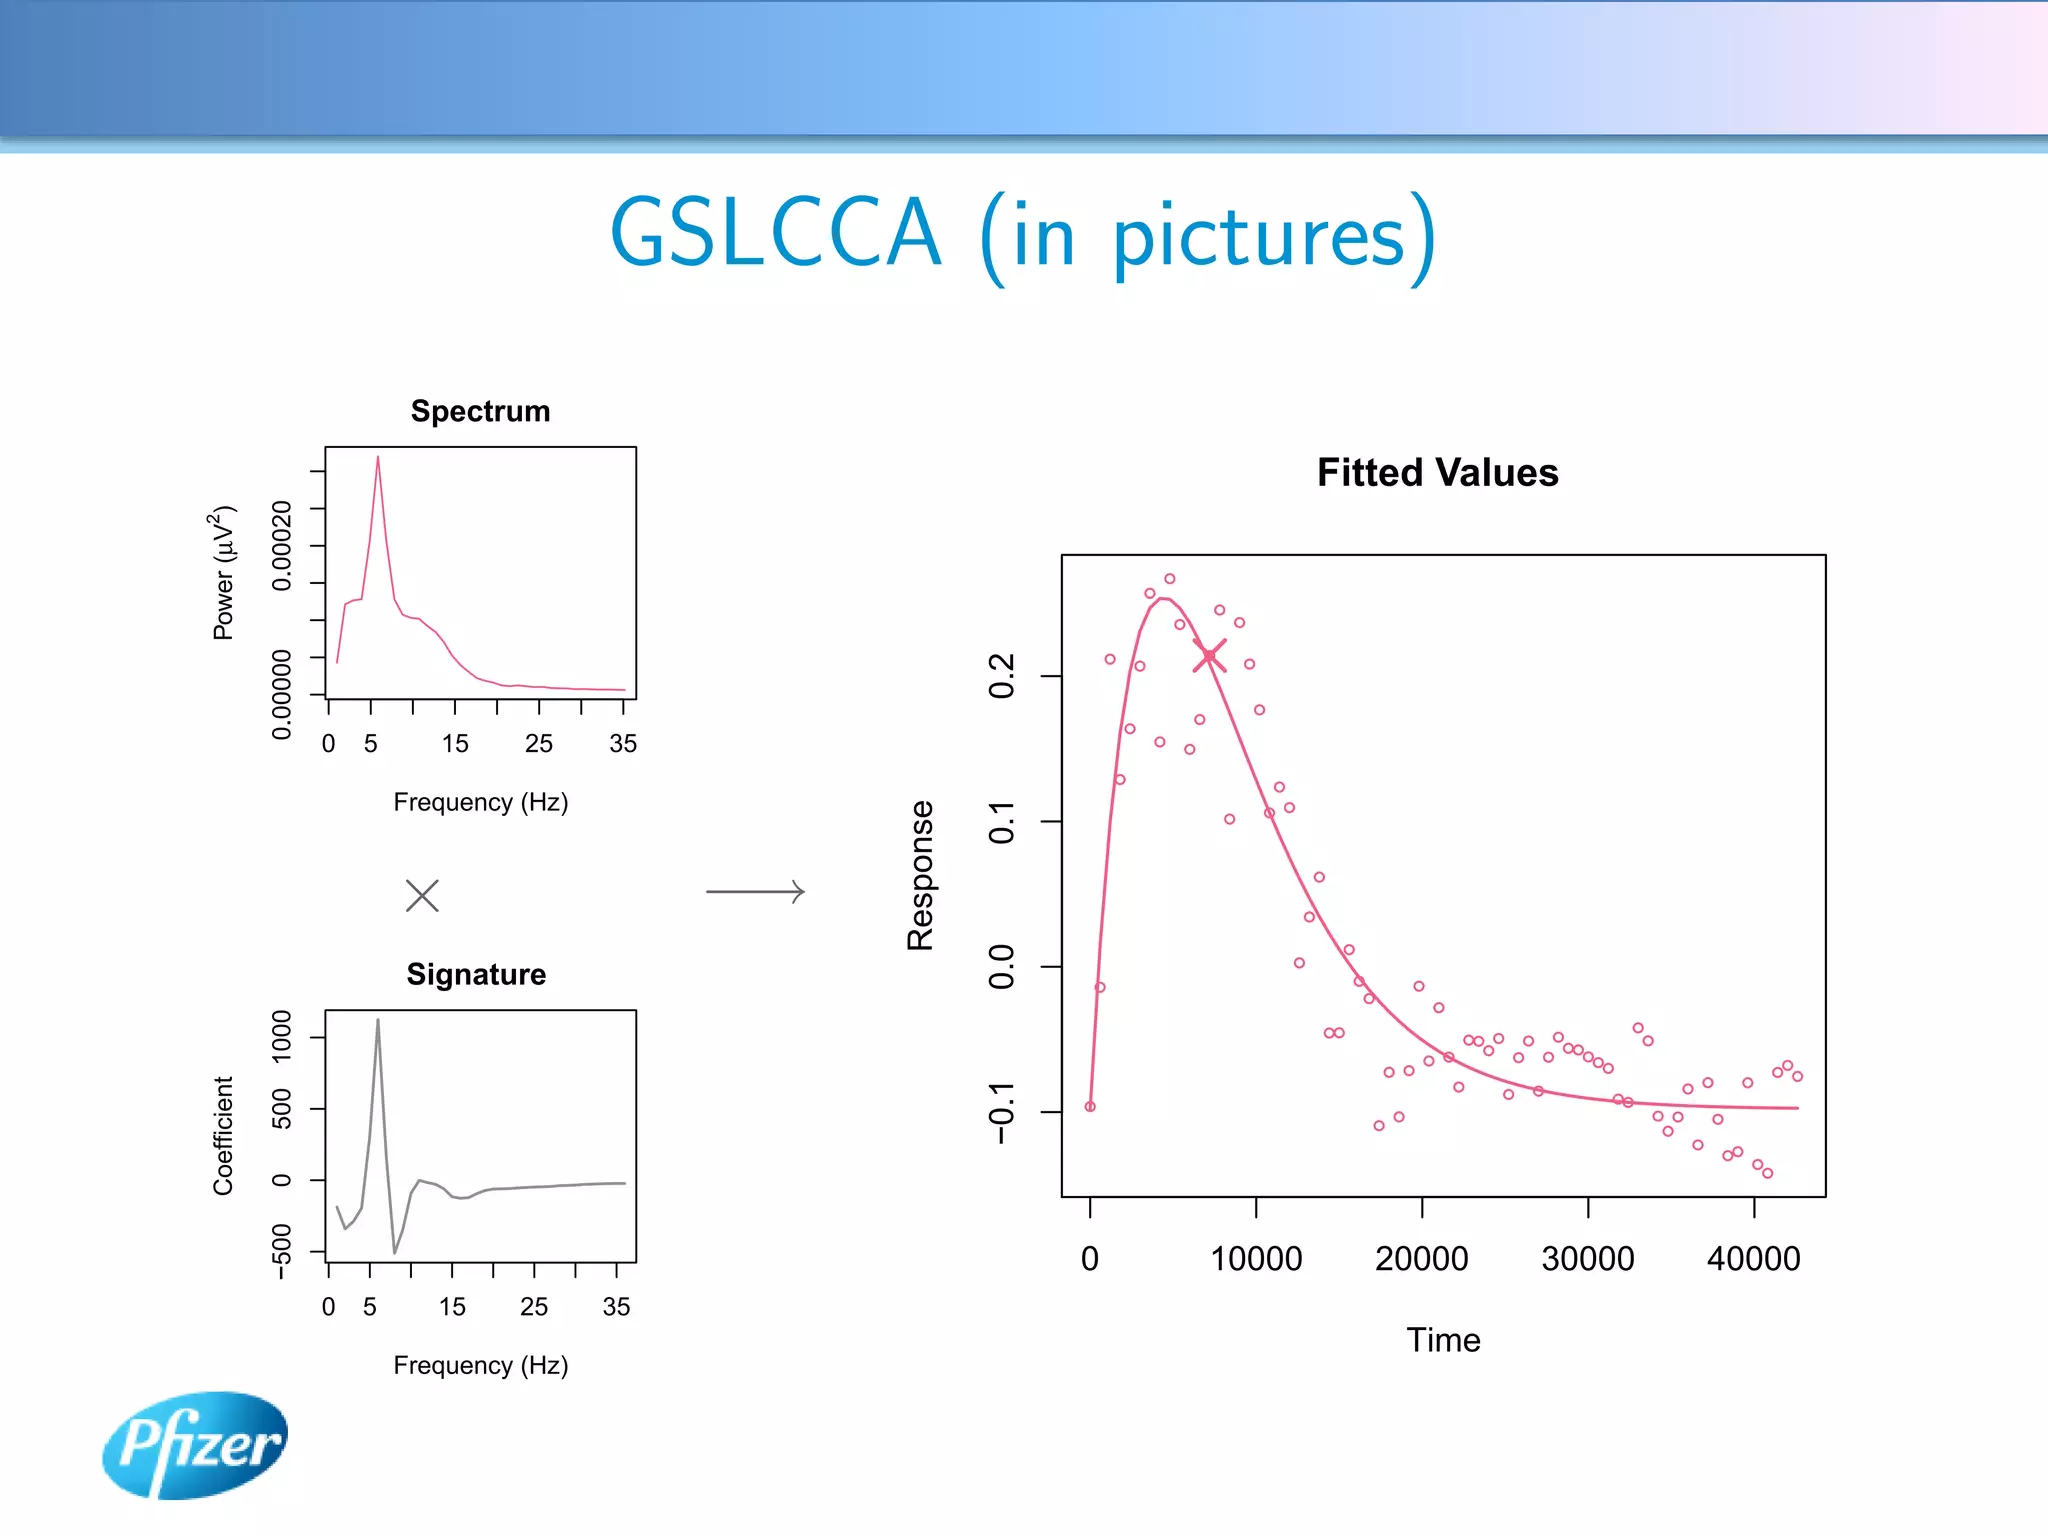
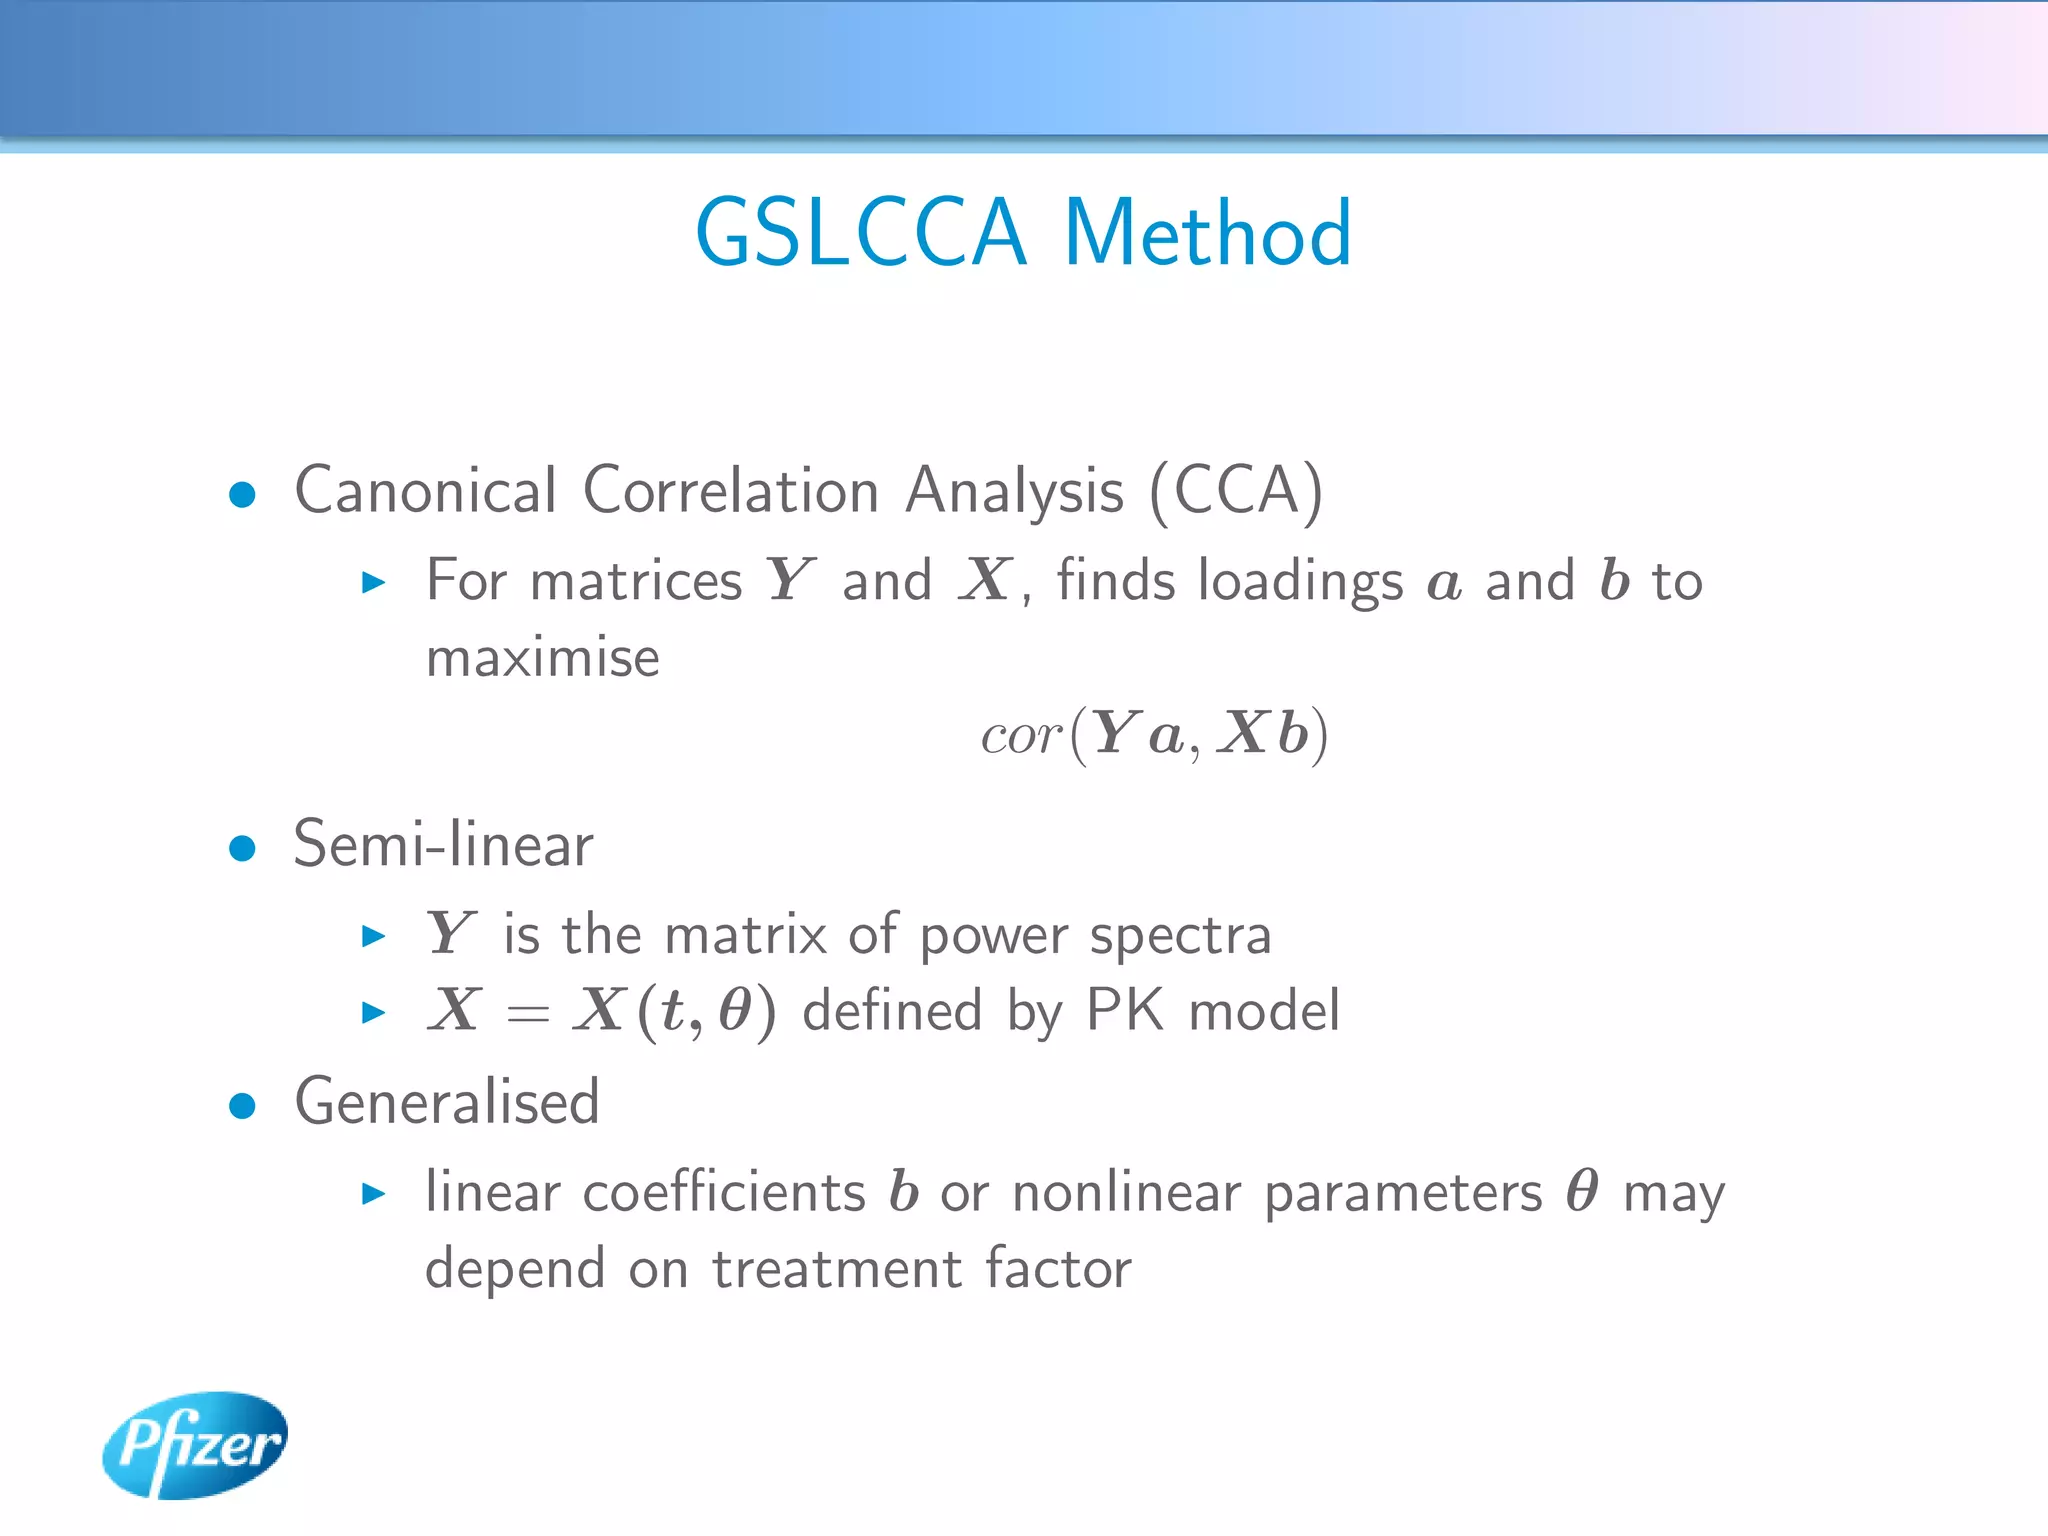
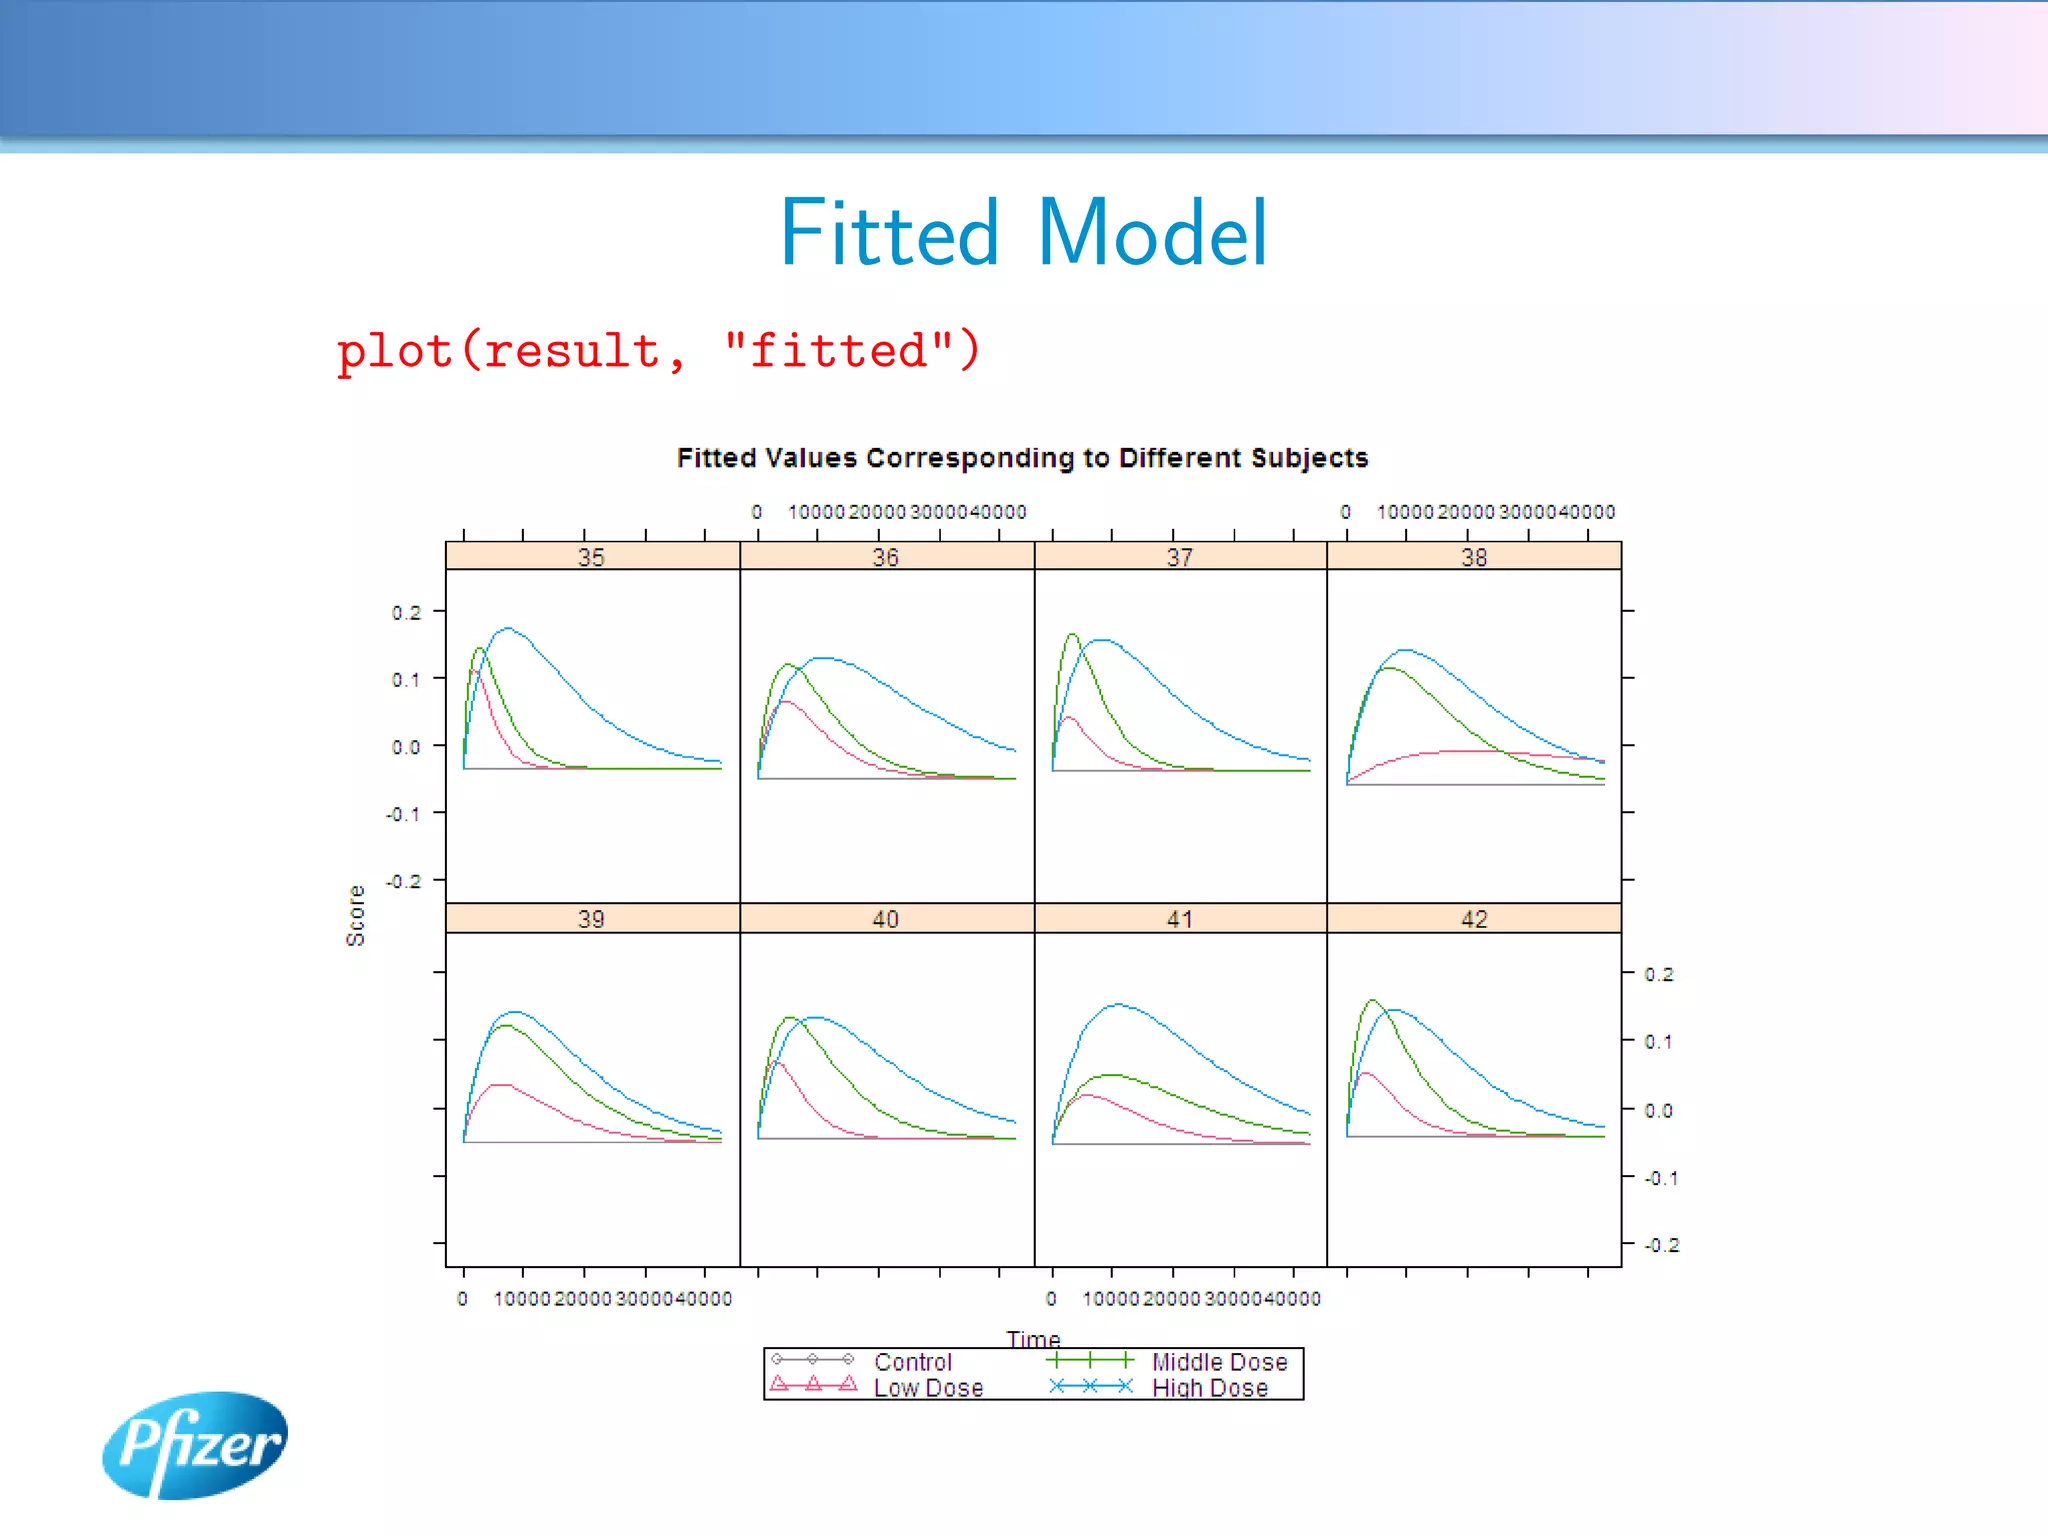
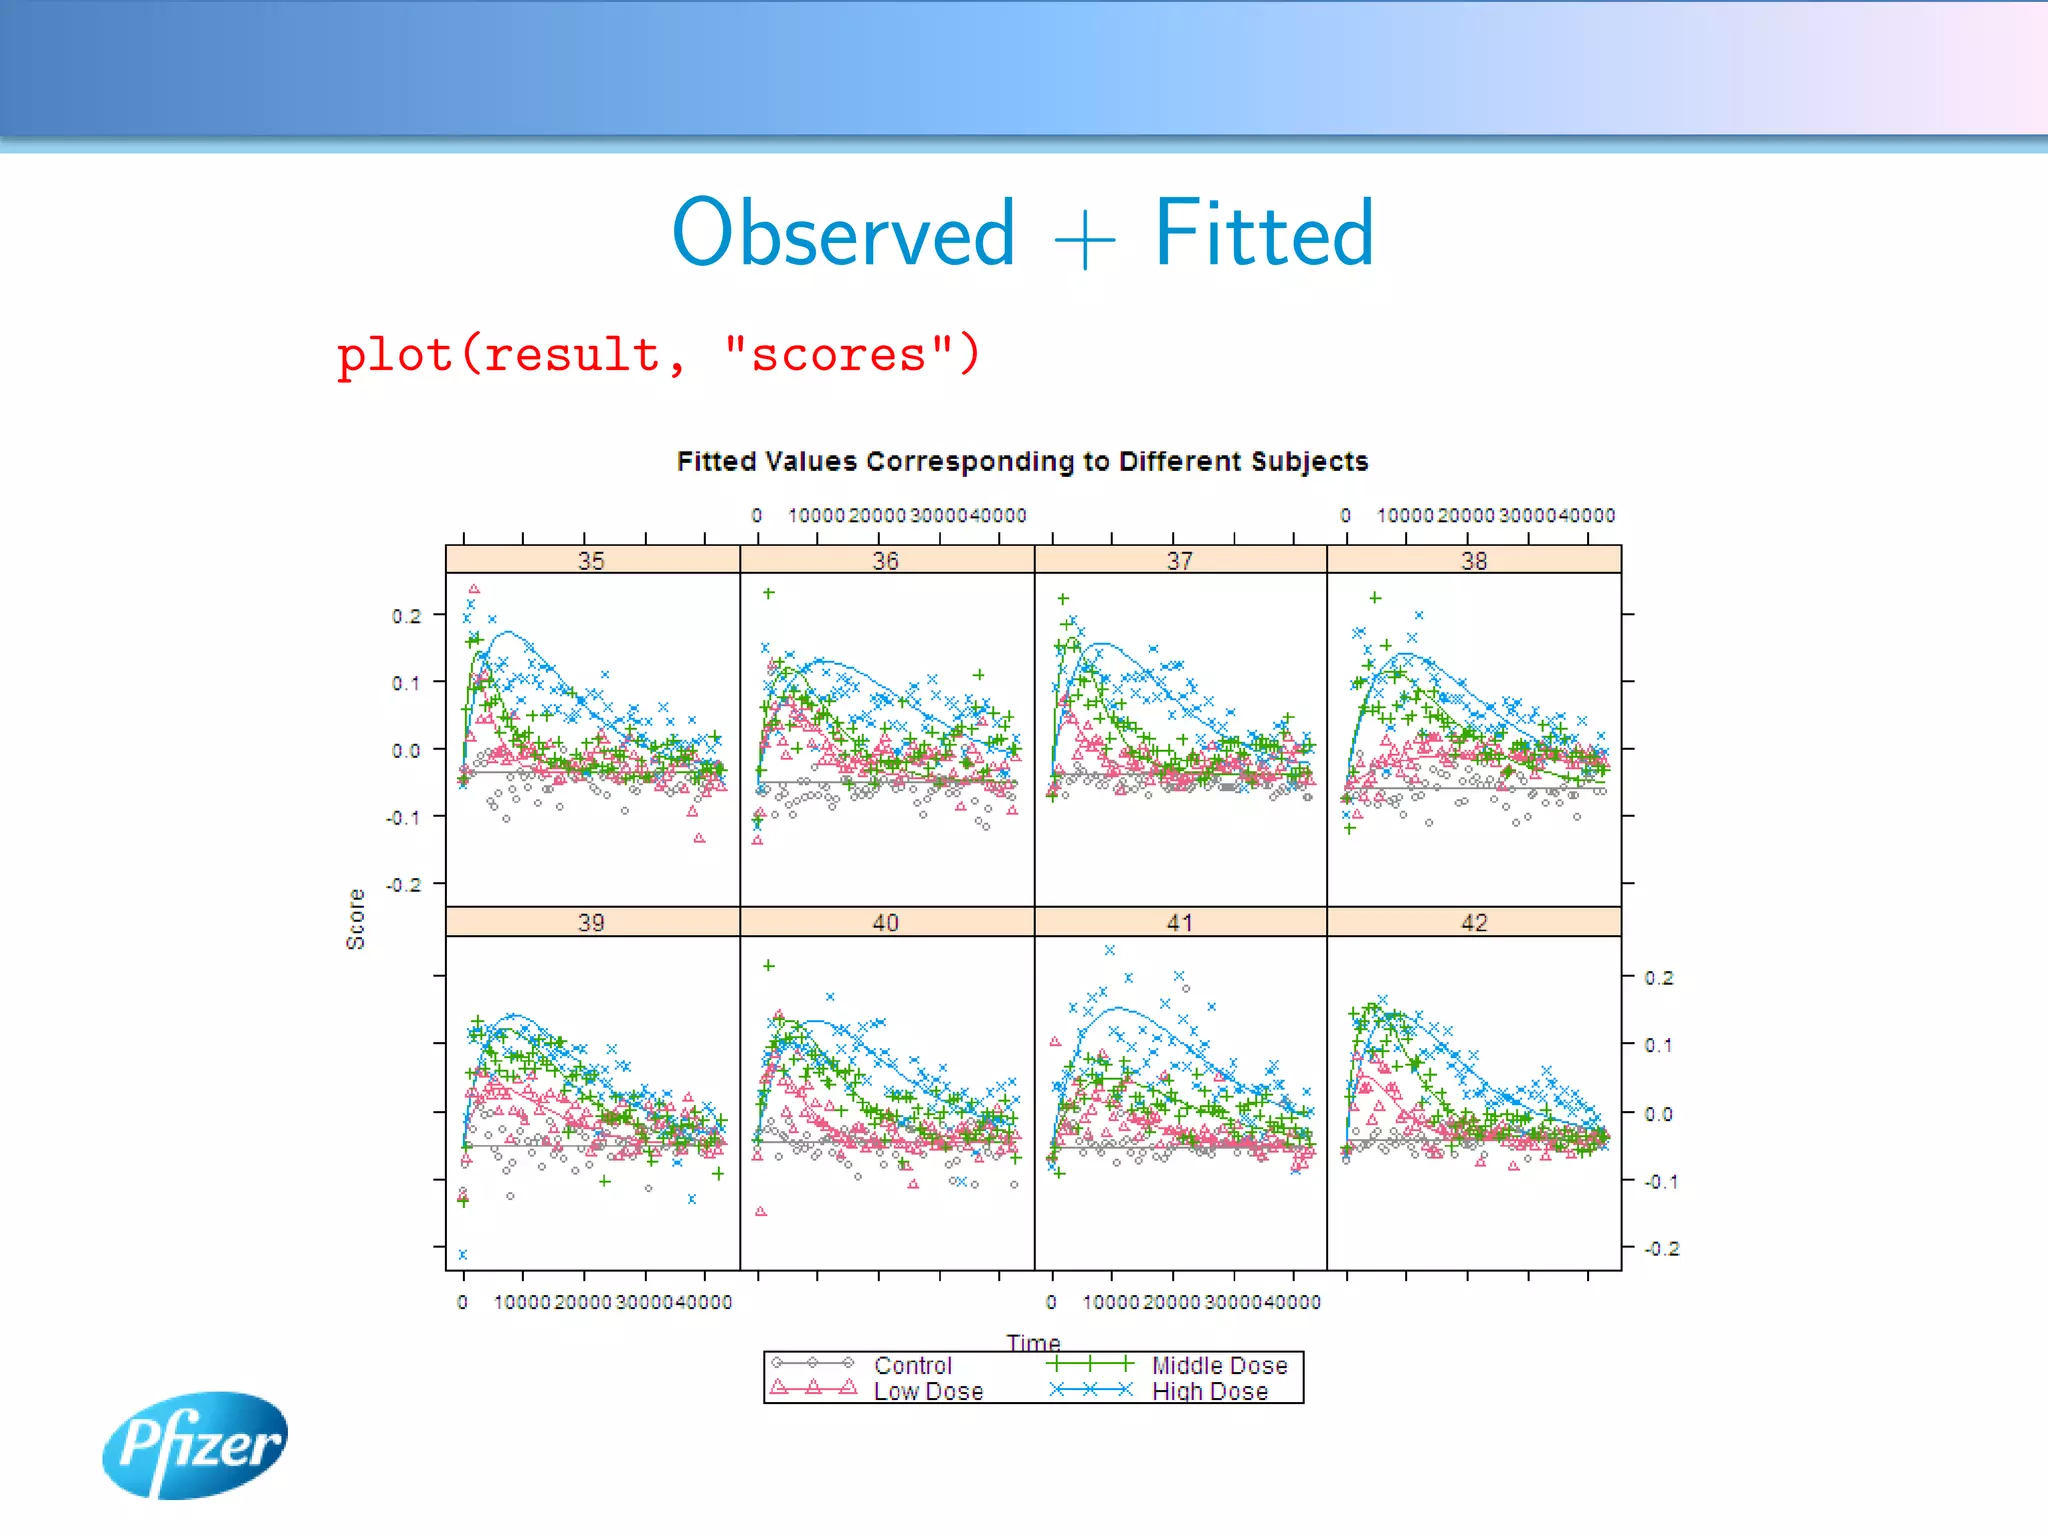
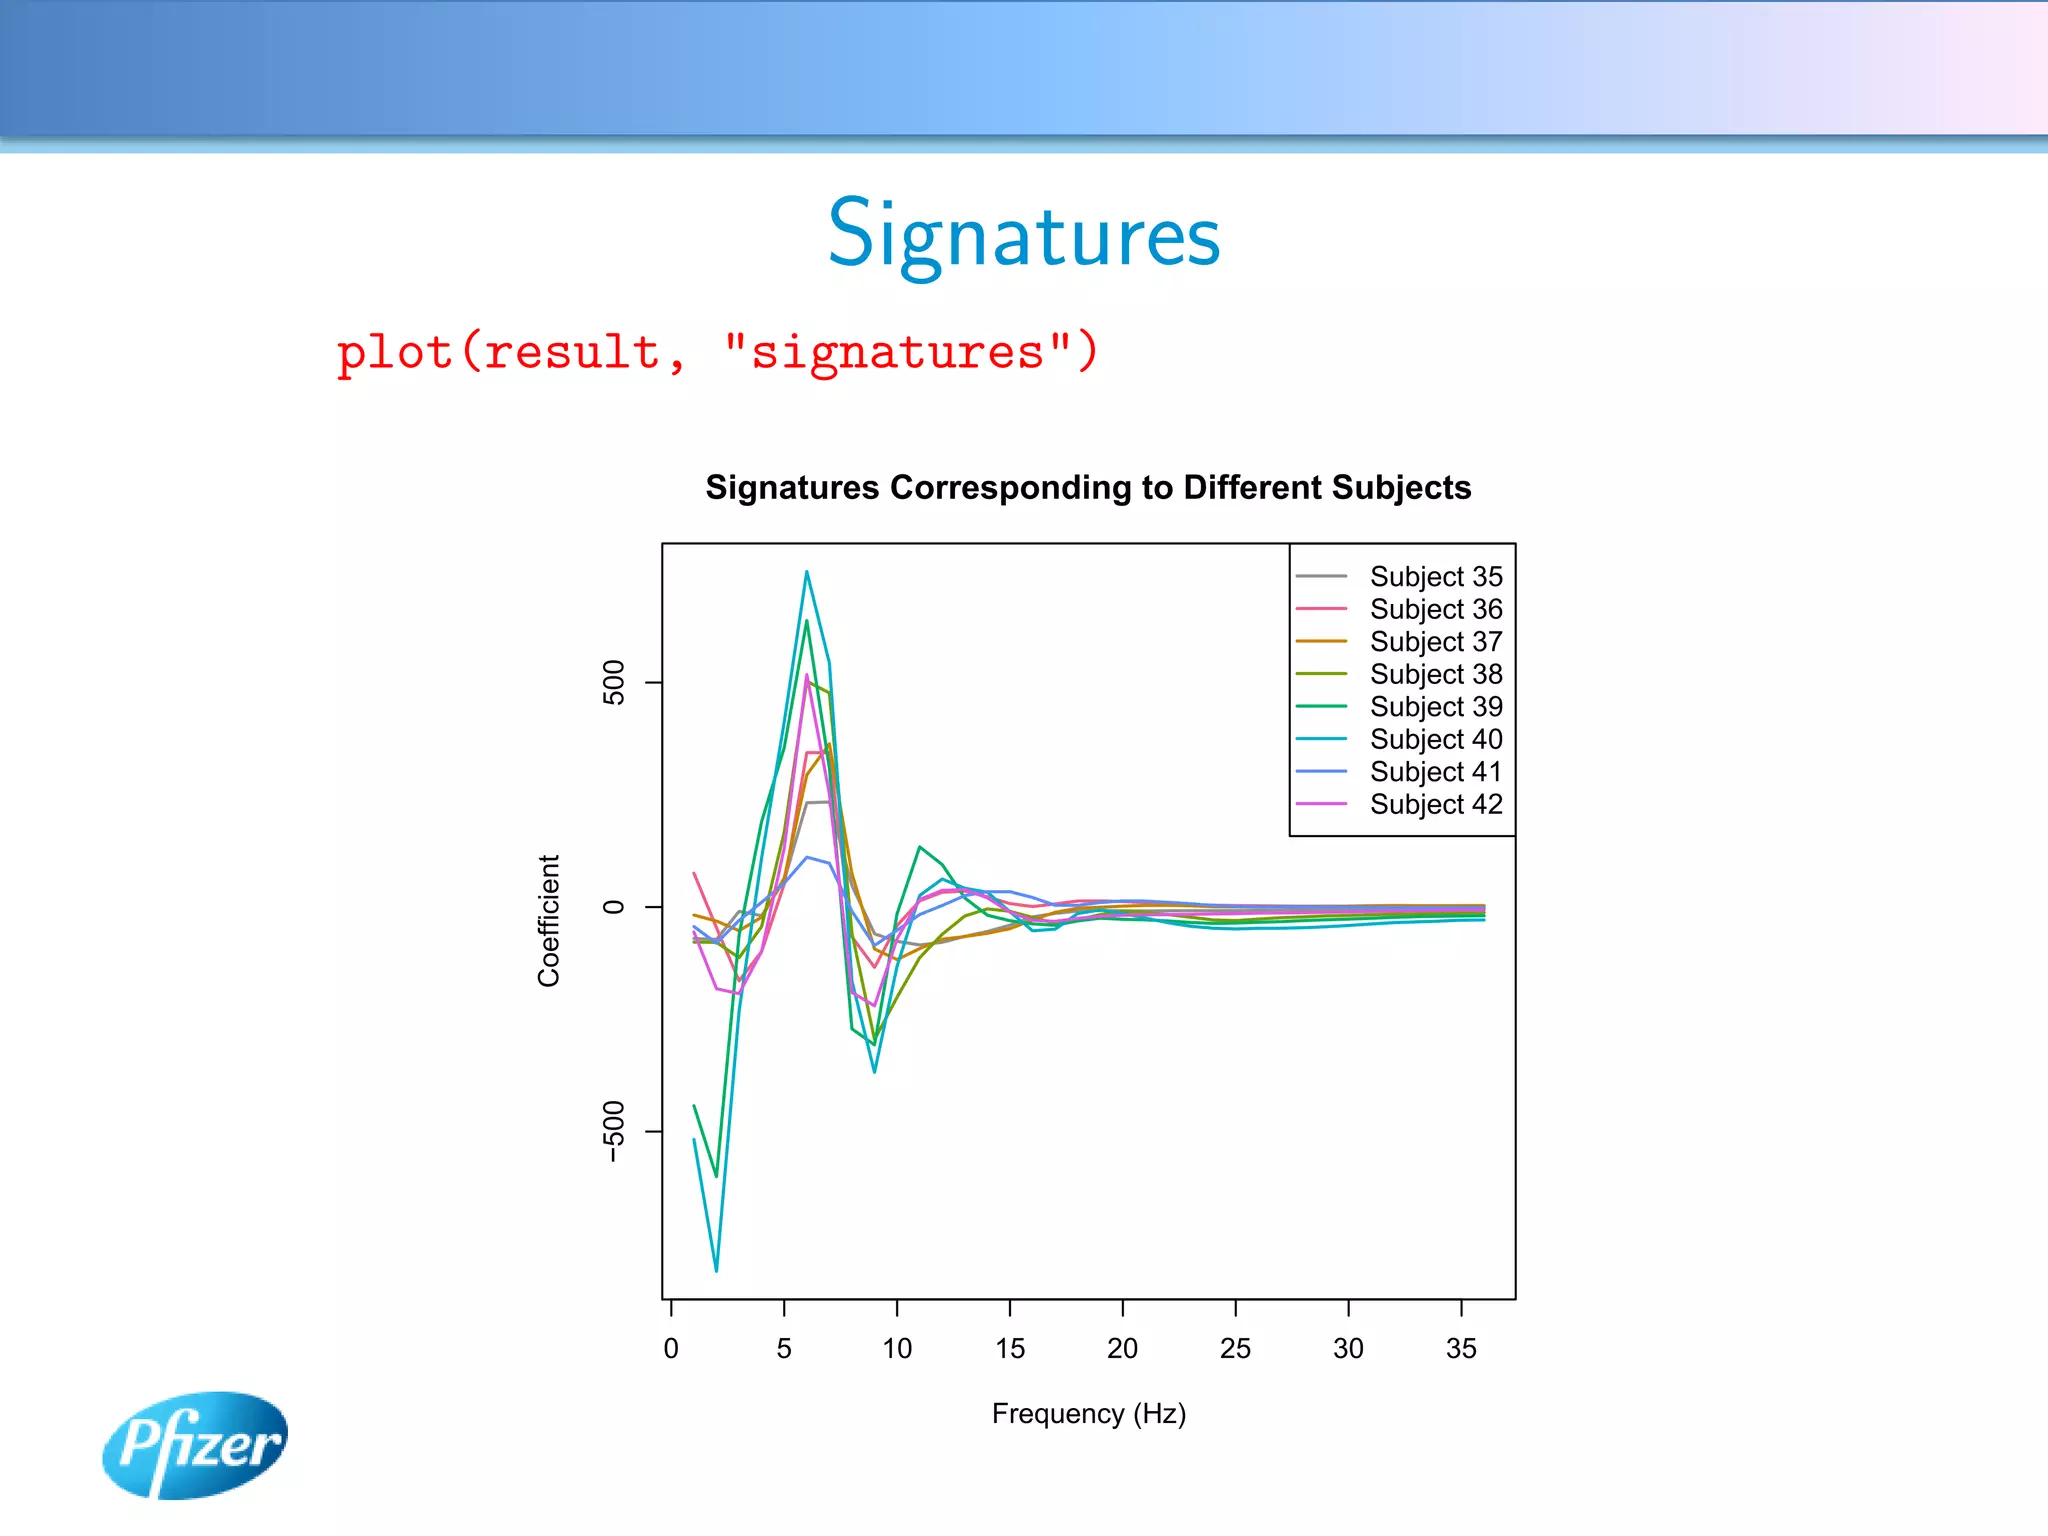
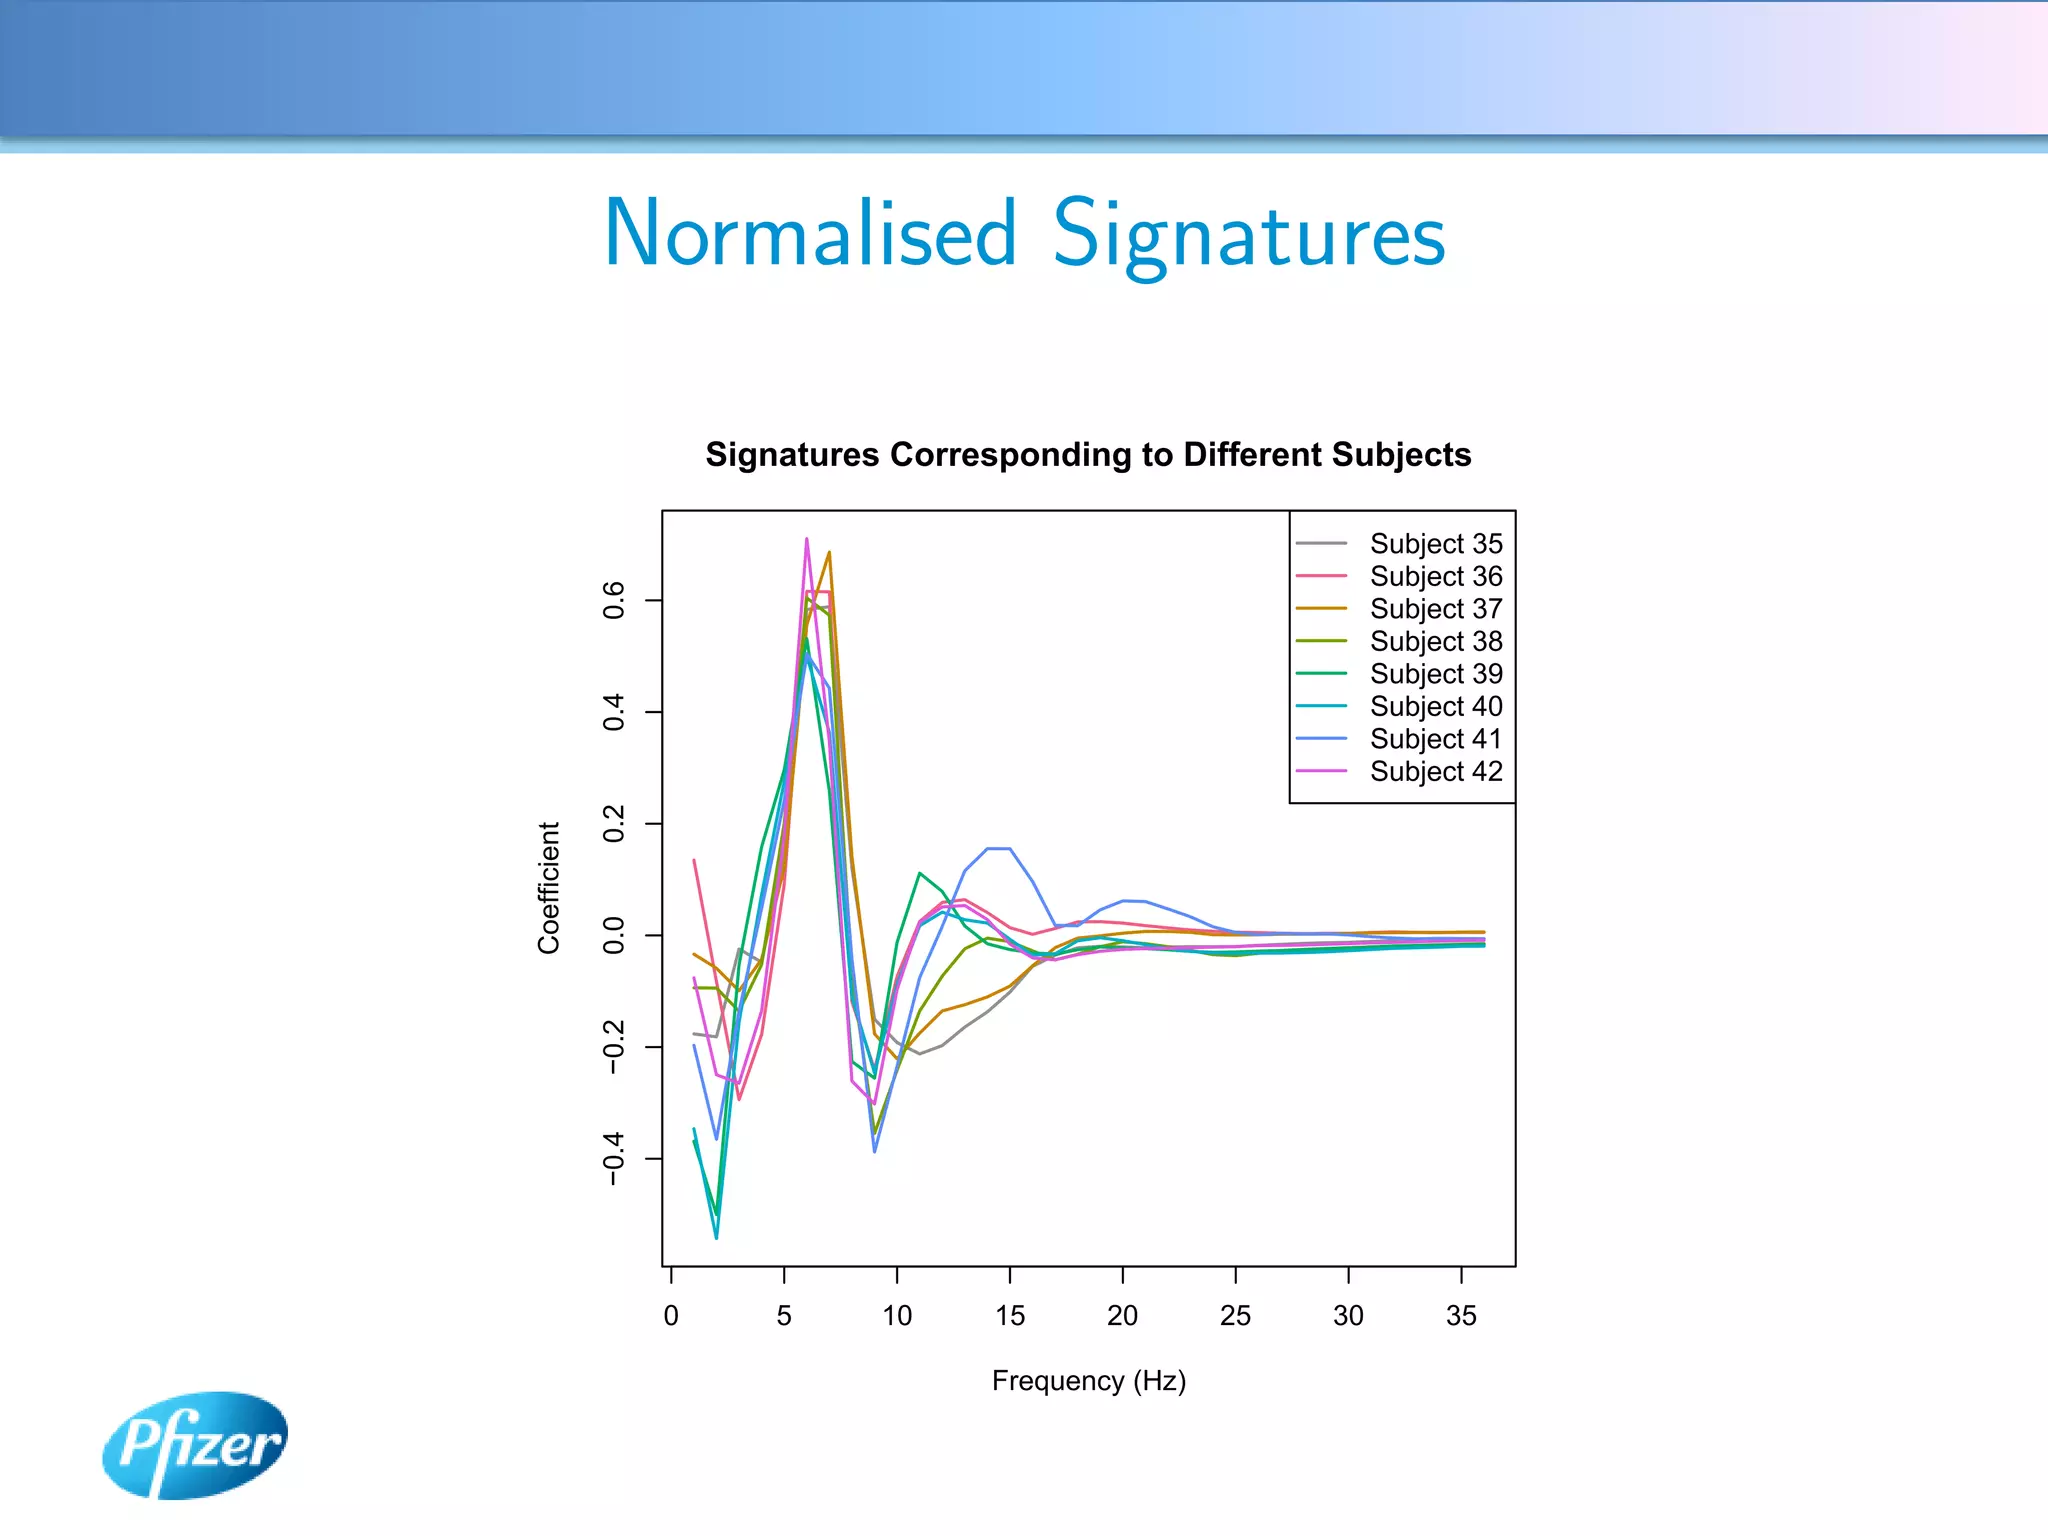
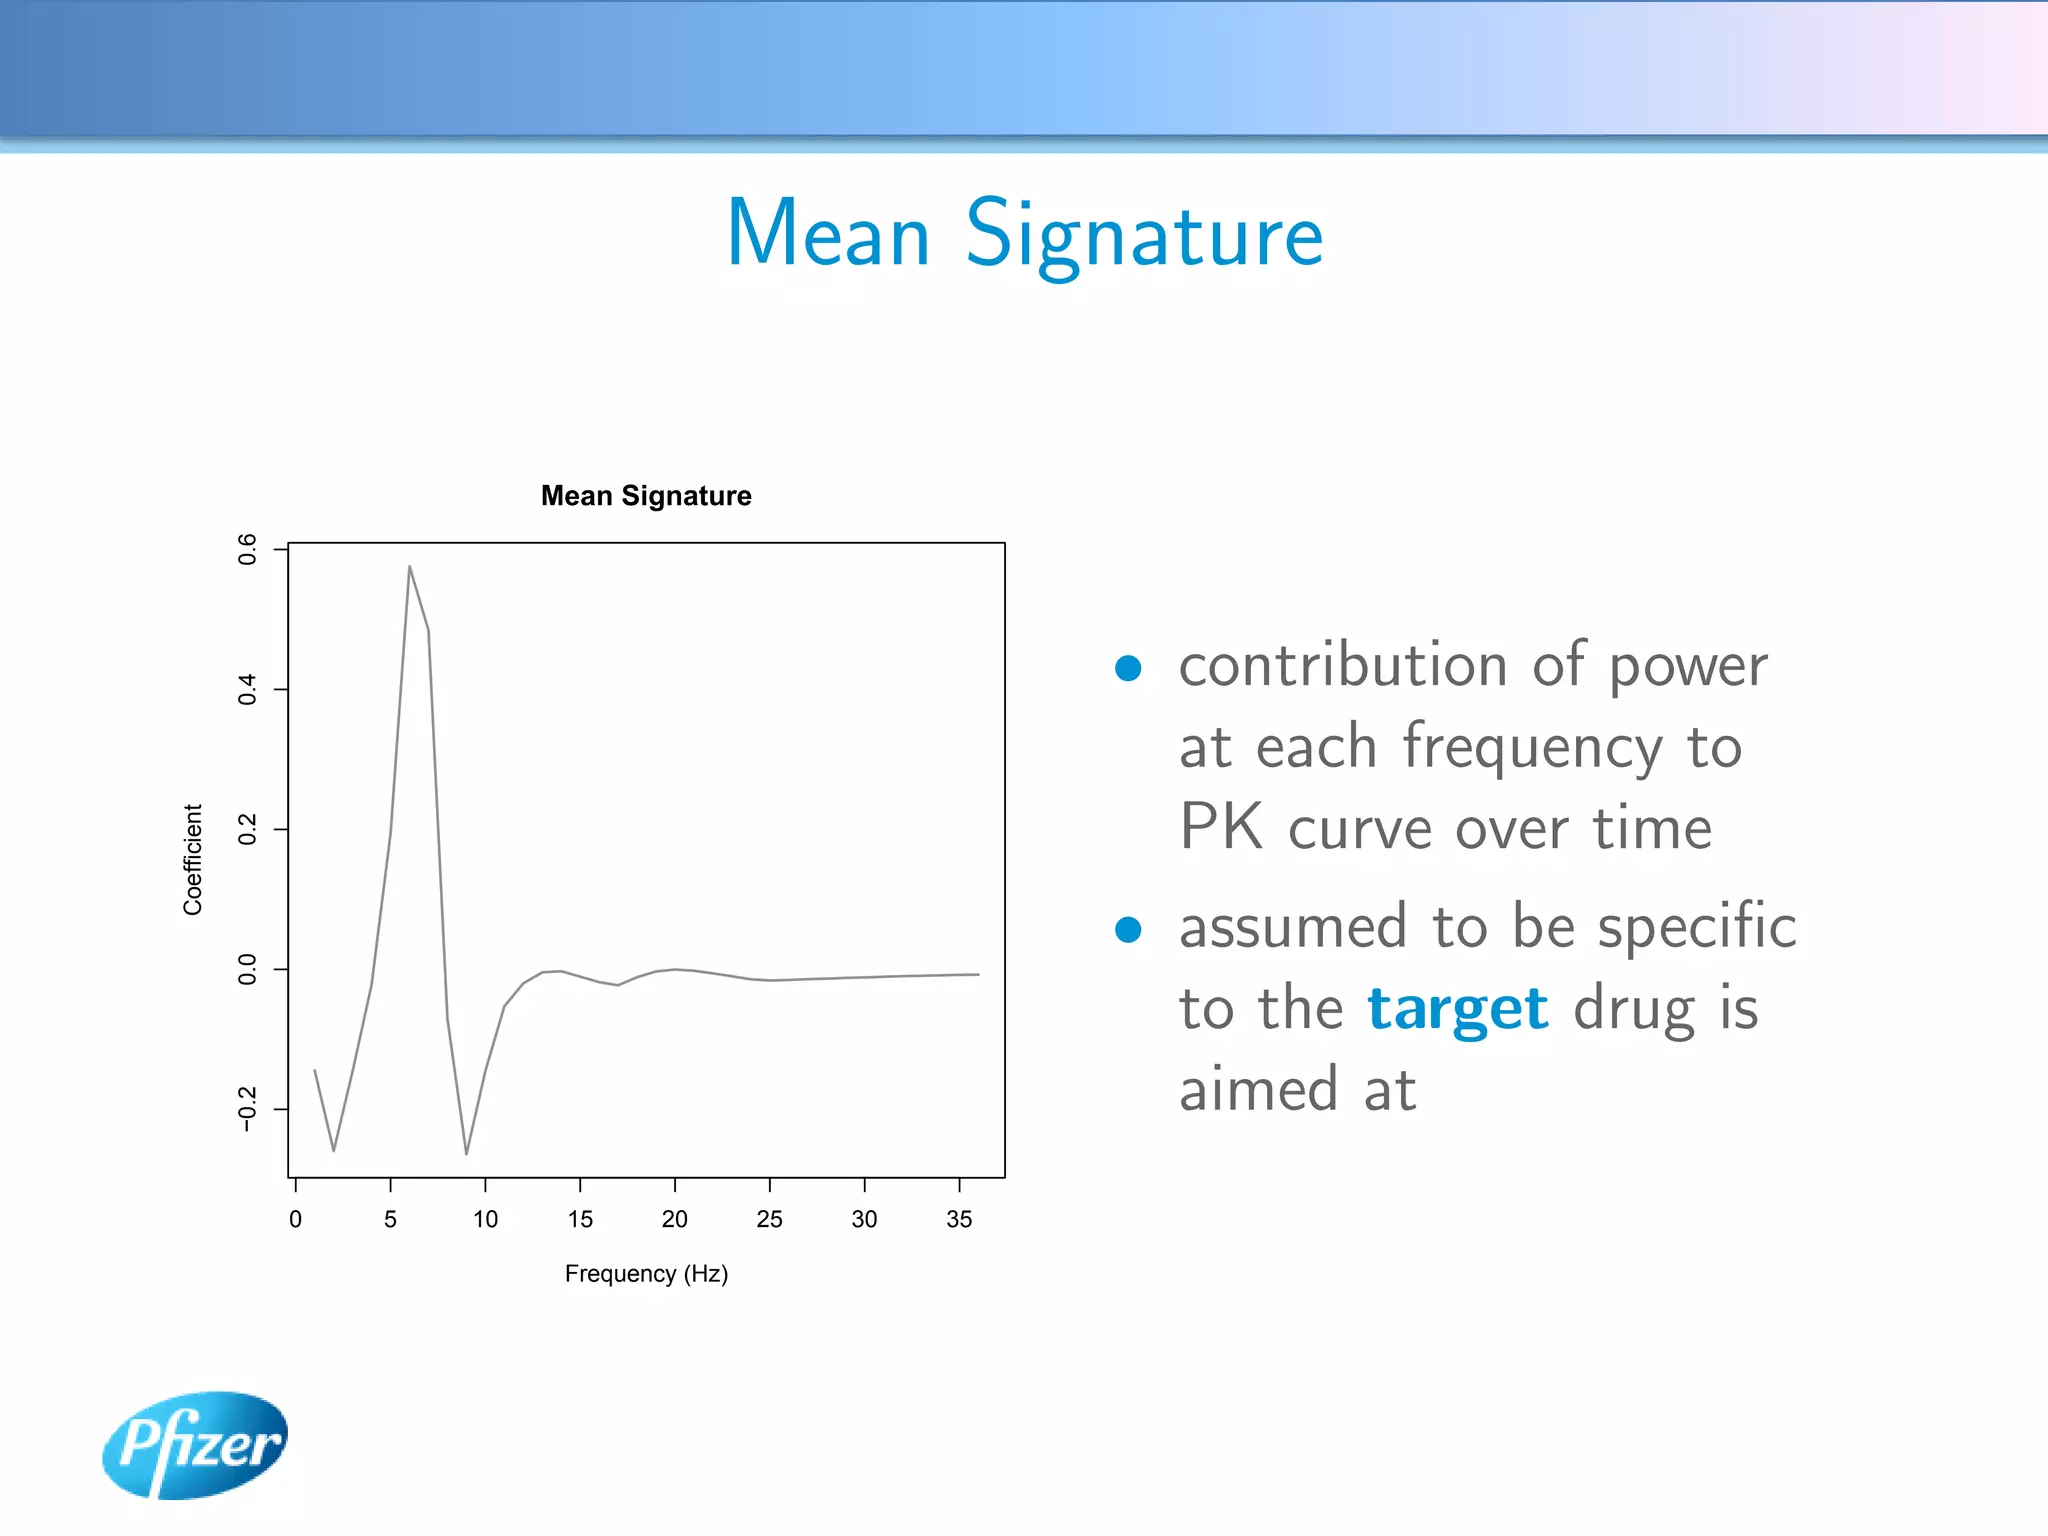
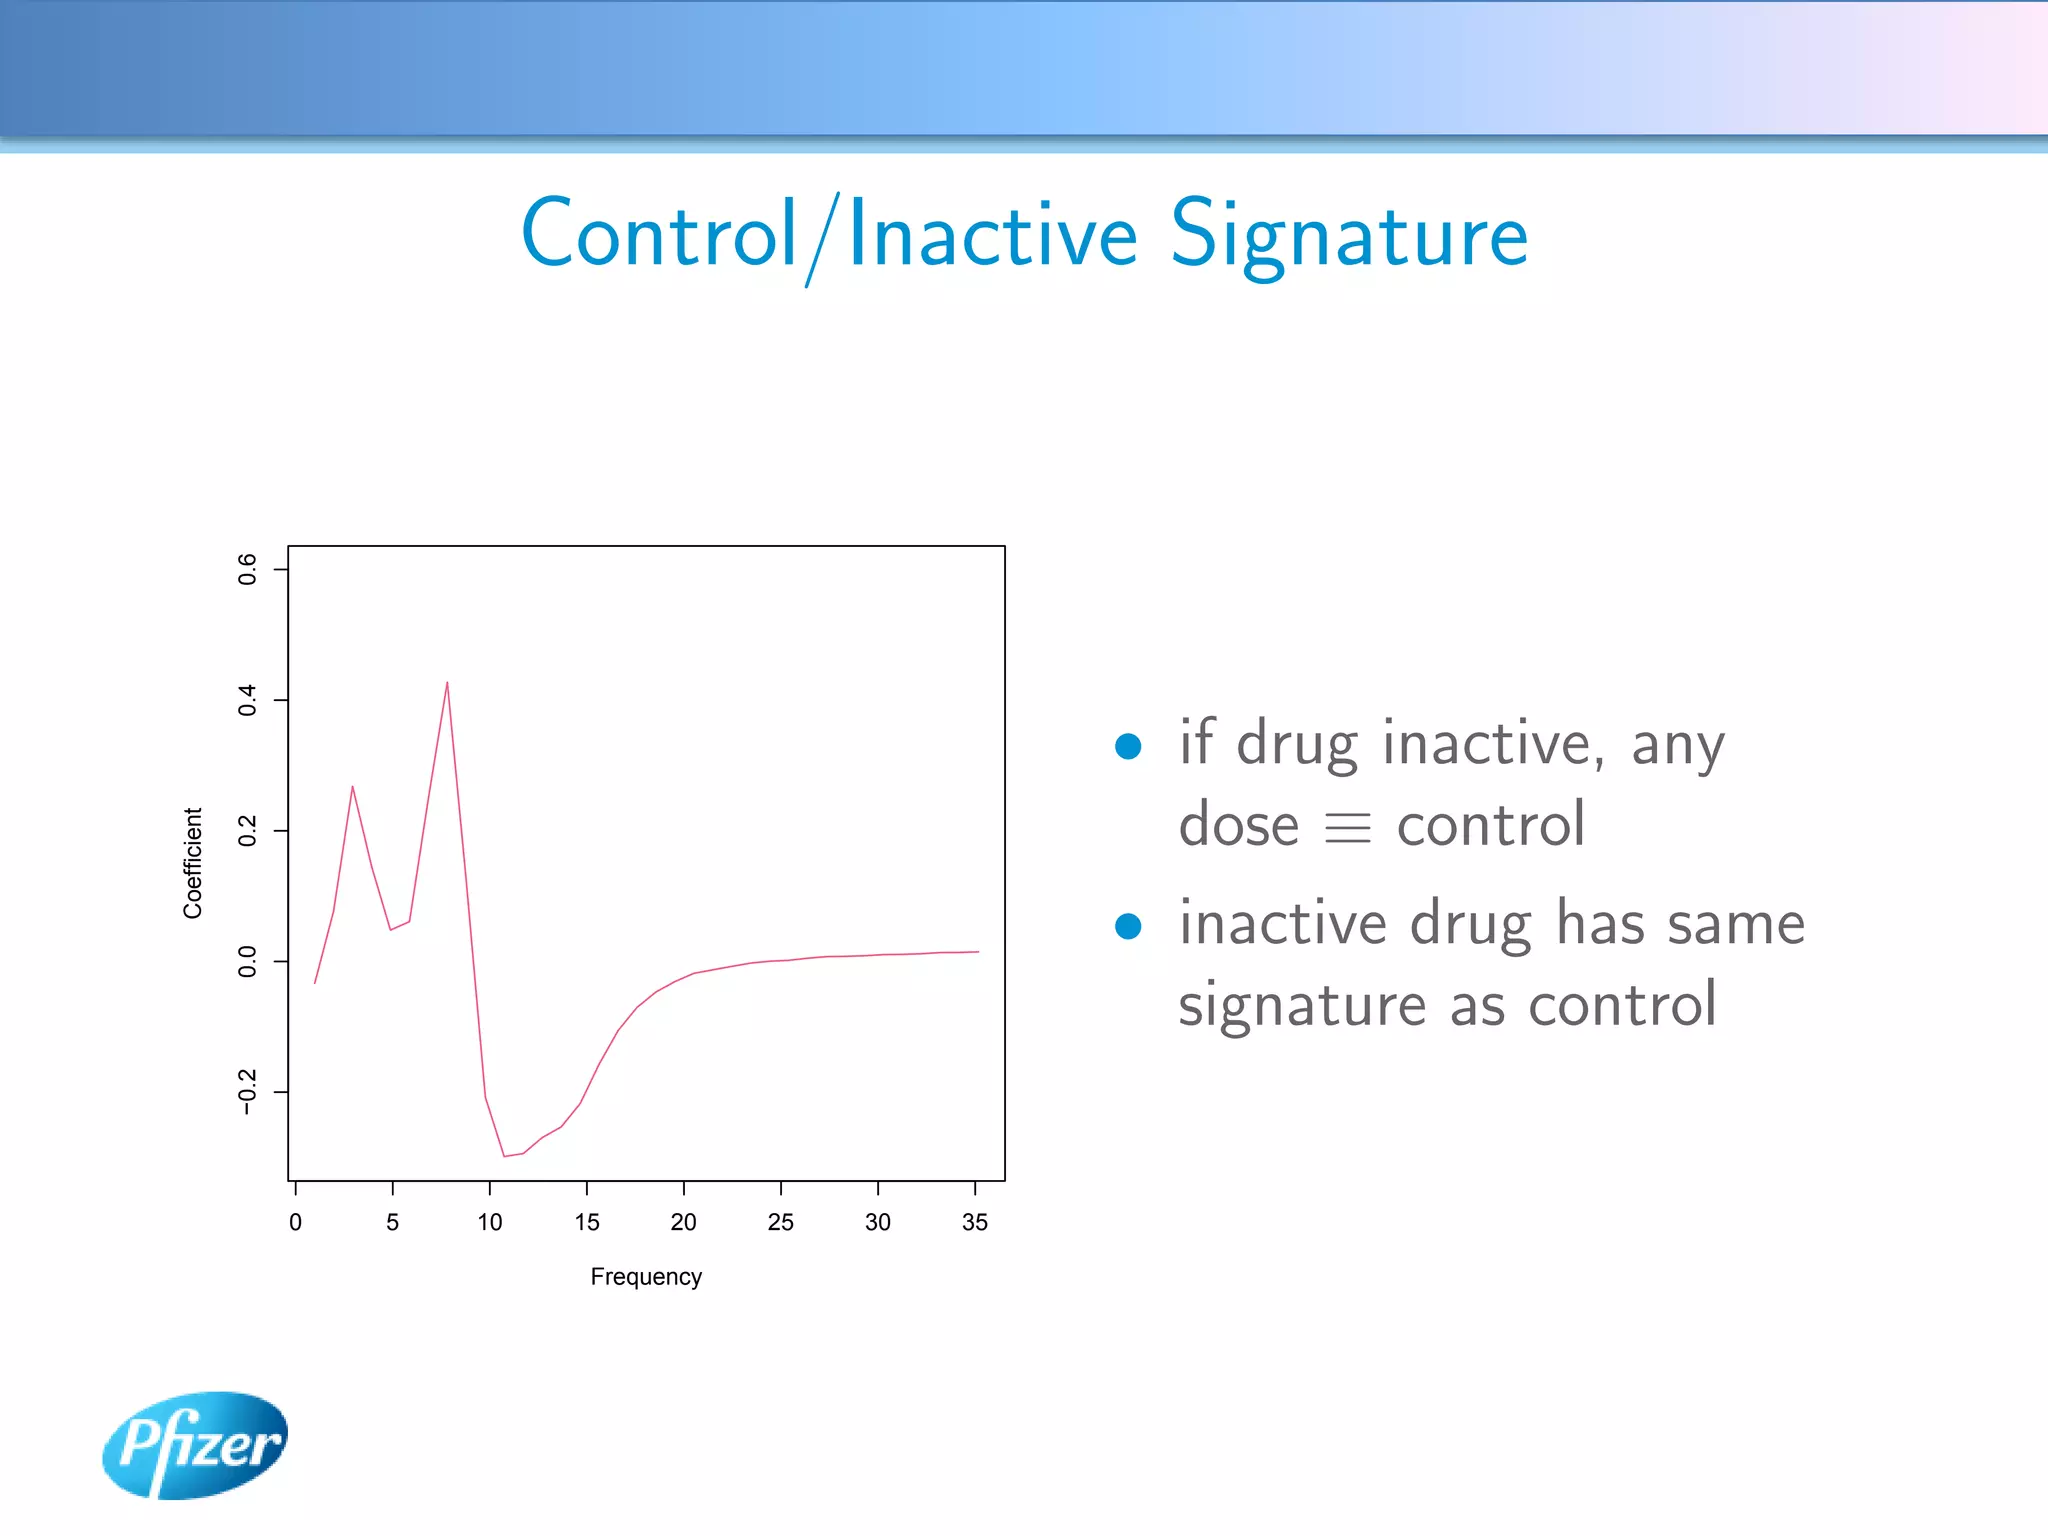
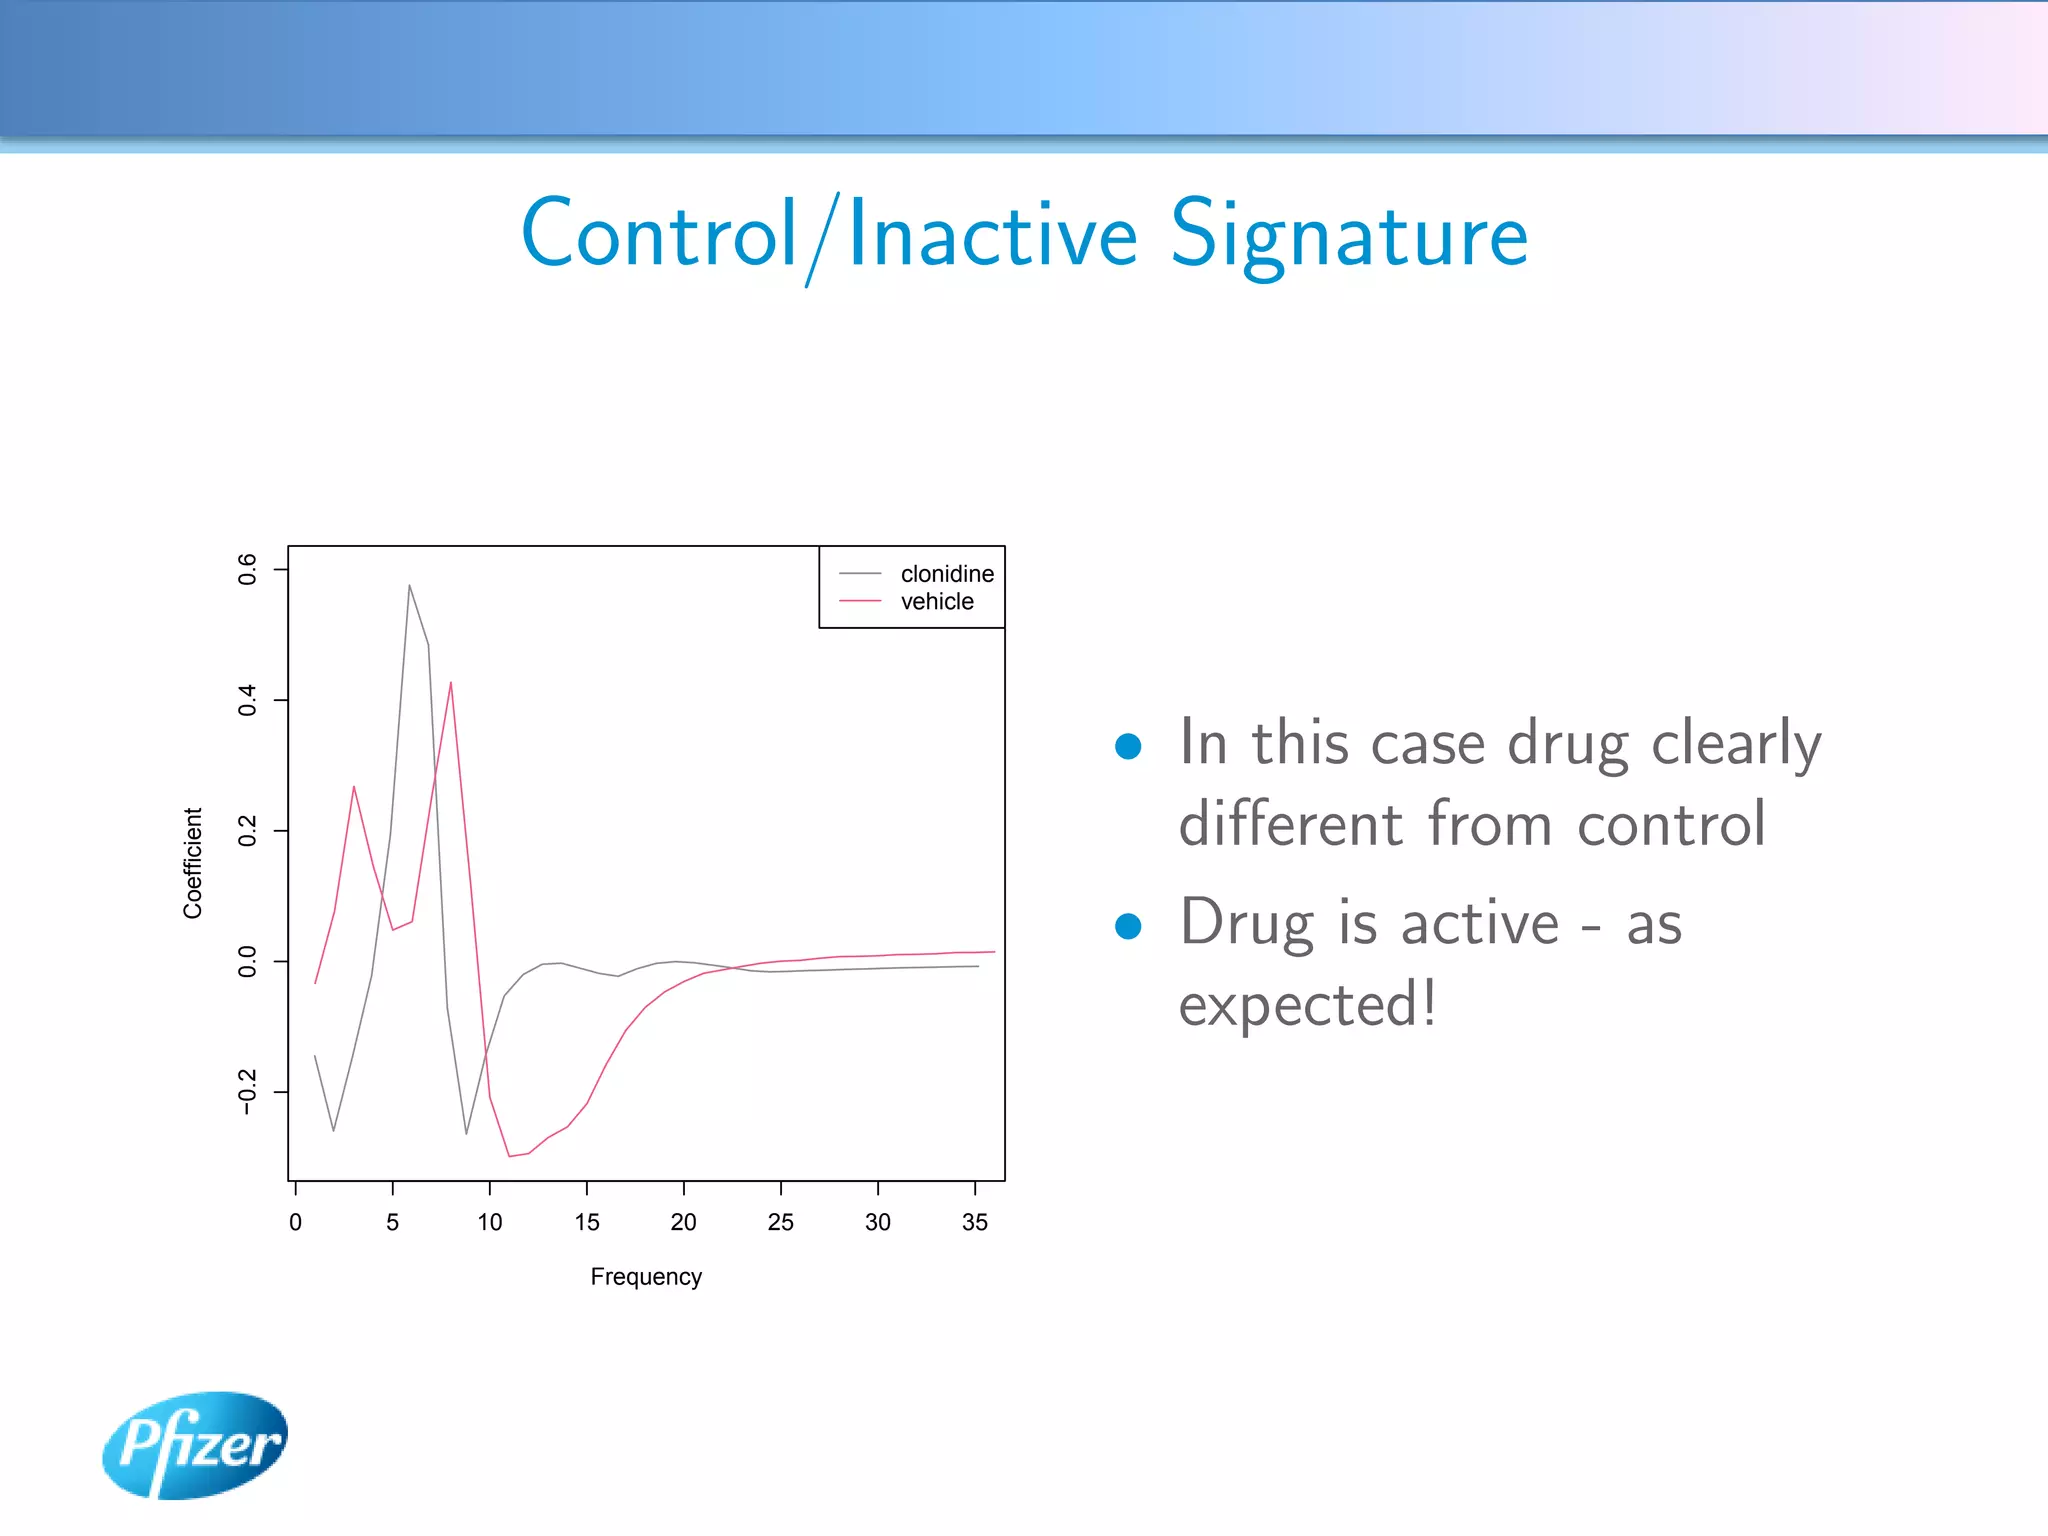
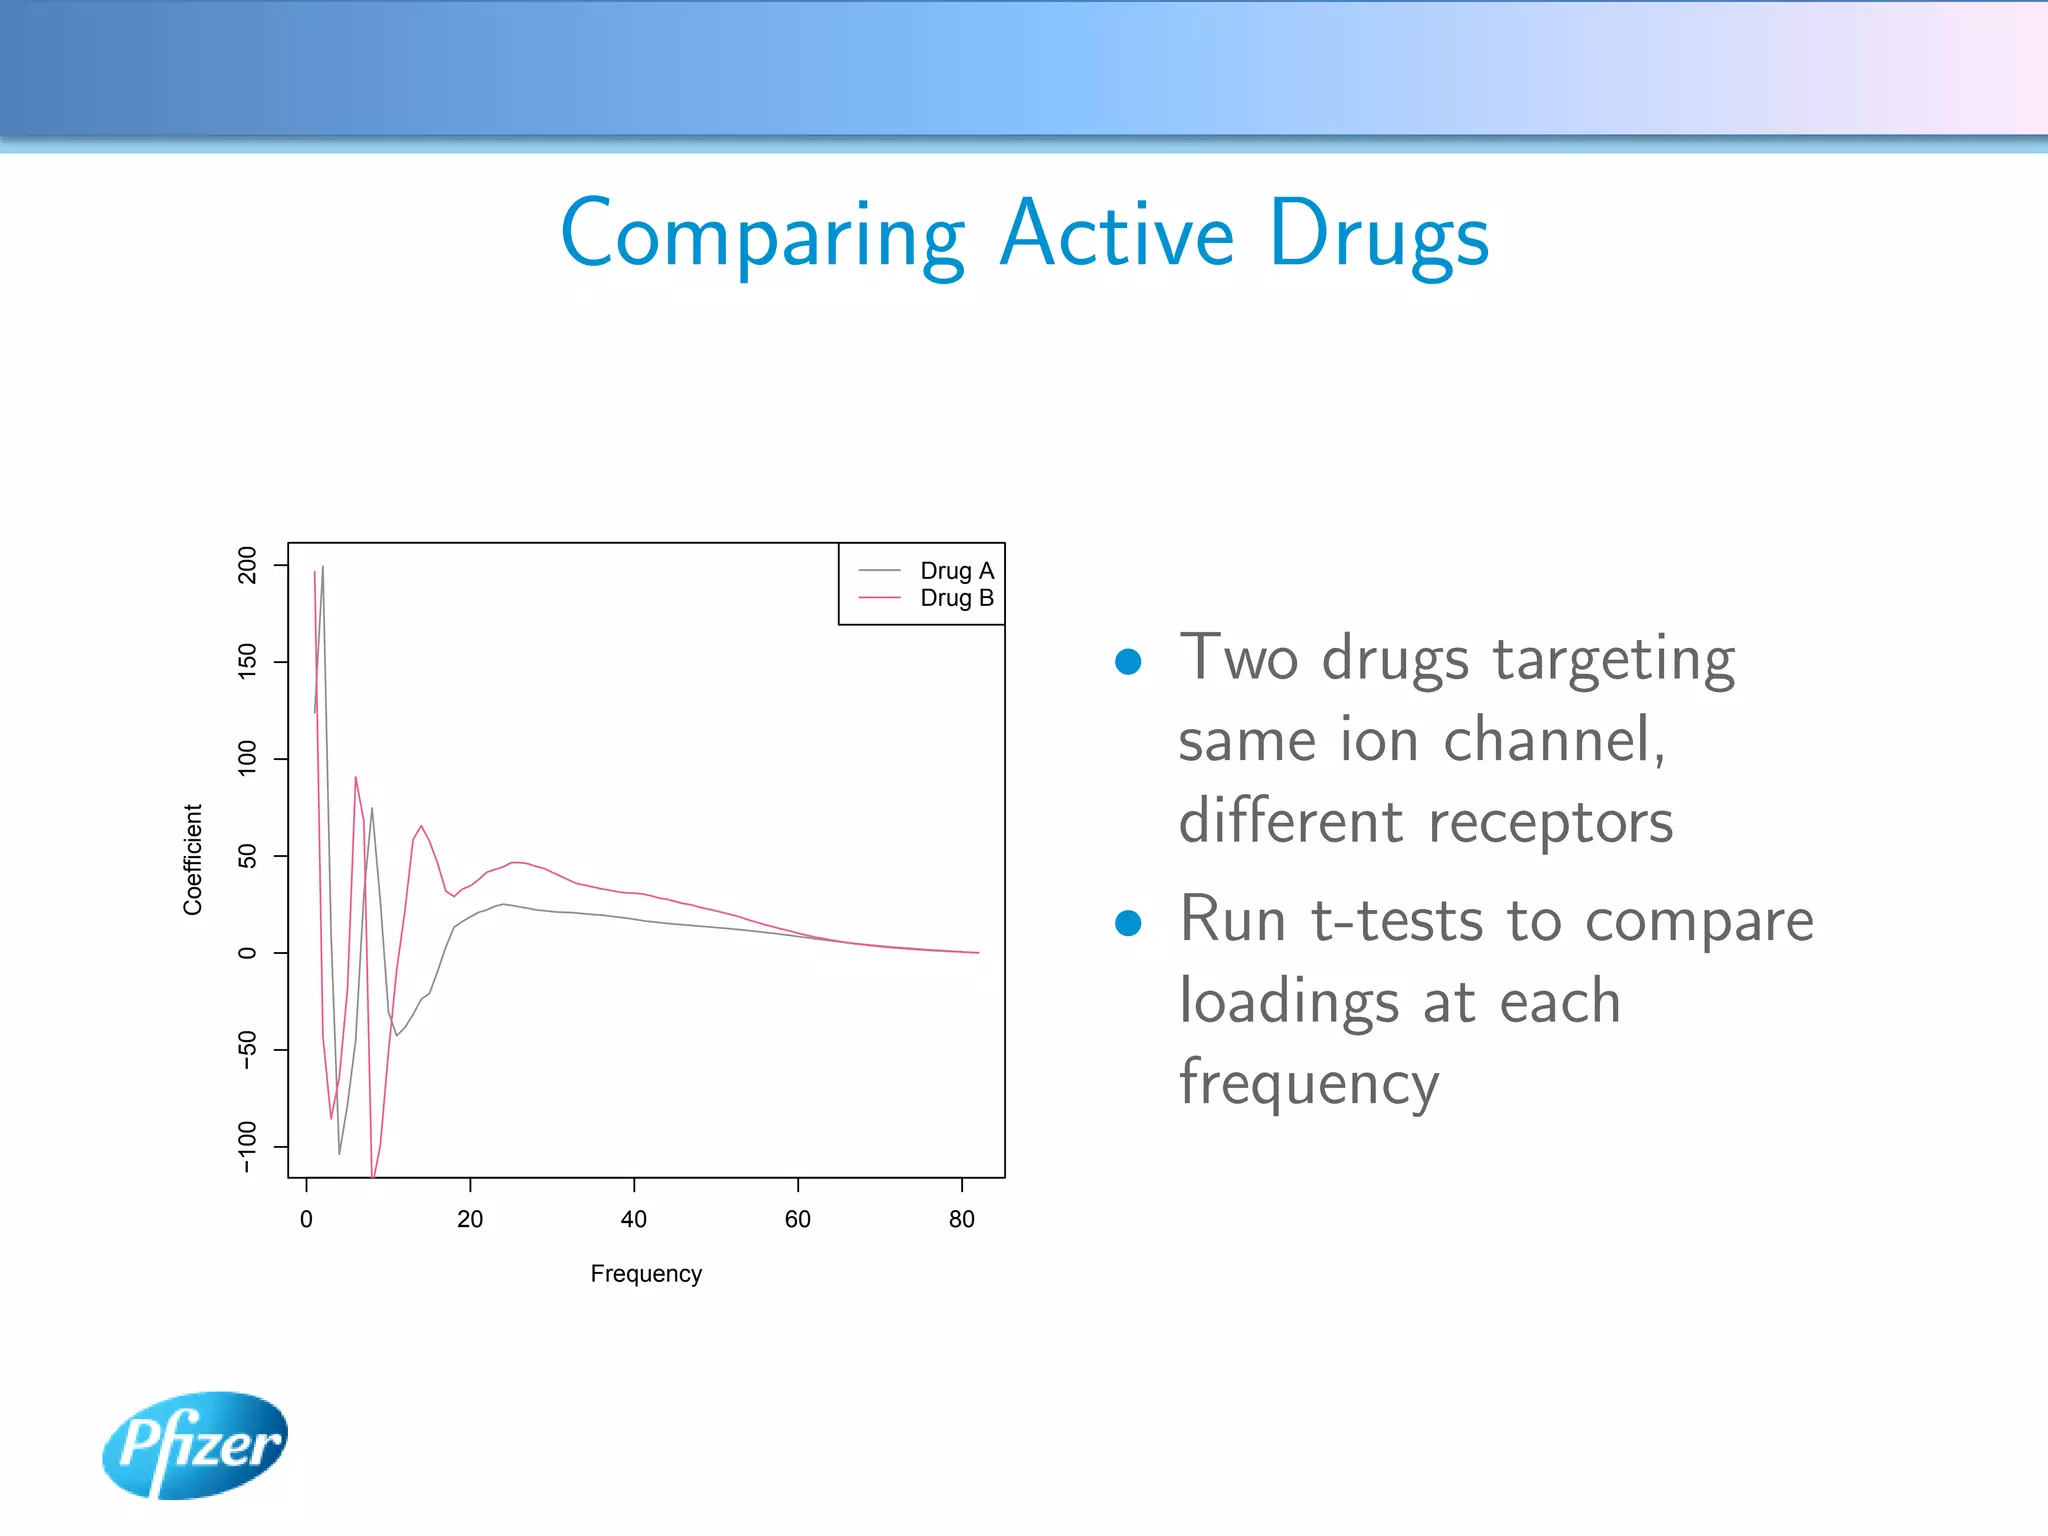
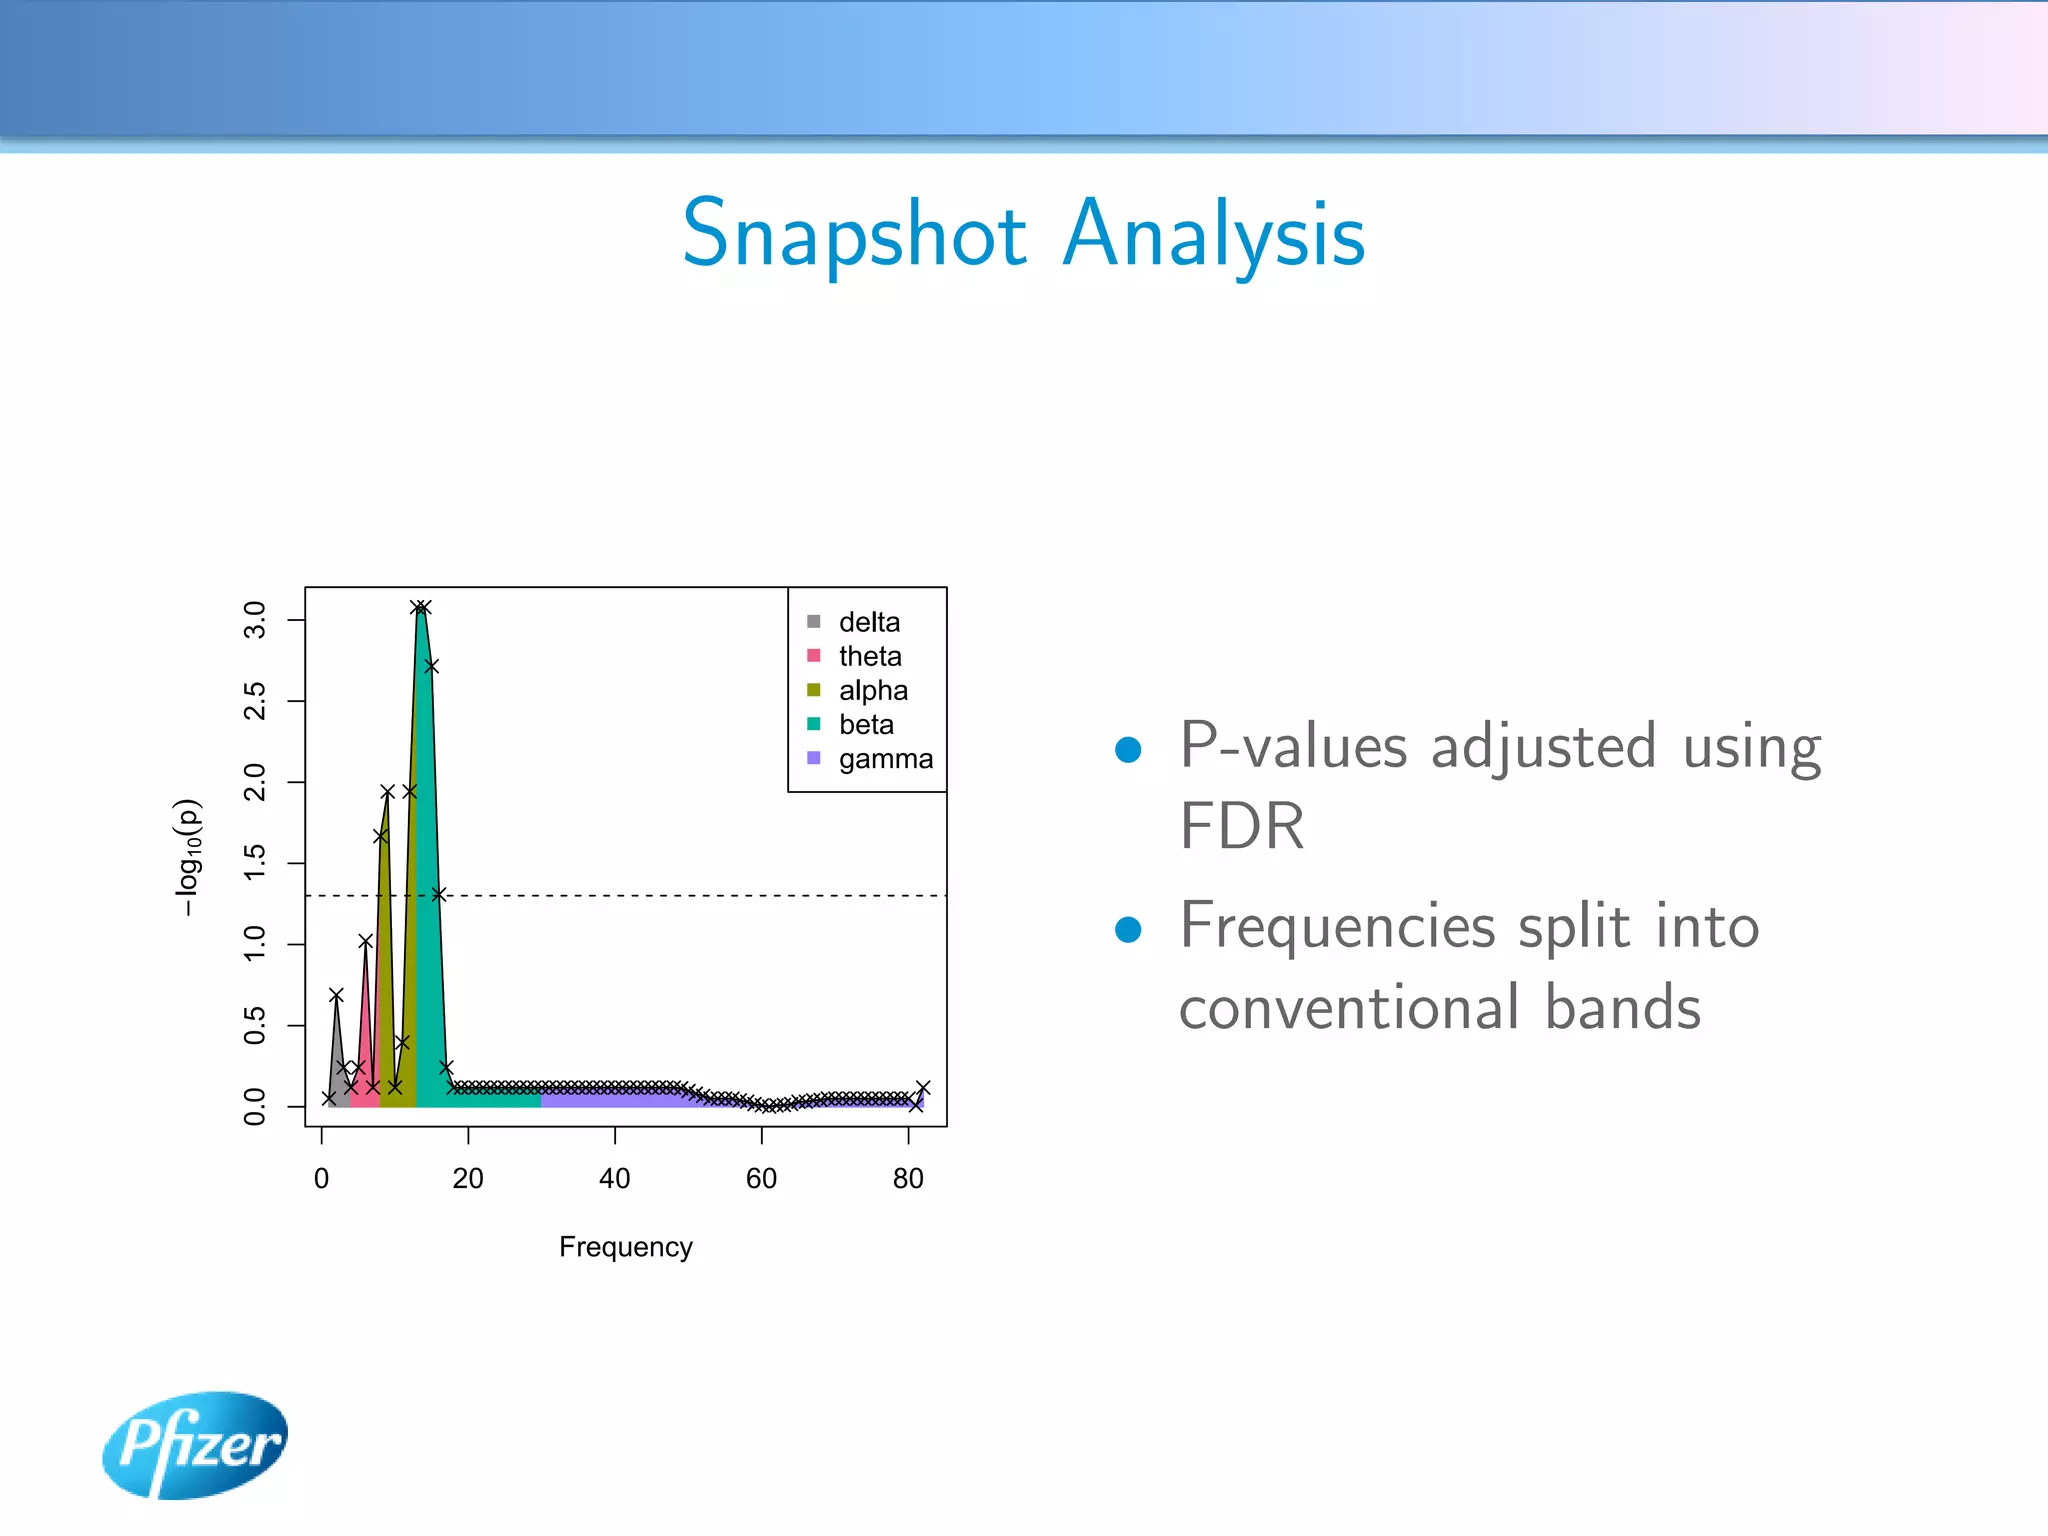
Detecting Drug Effects in the Brain


Heather Turner, Phil Brain and Foteini Strimenopoulou


                 Nonclinical Statistics
                     Pfizer, UK


                  18 August 2011
Background


Aim: identify and characterise effect of drug on the brain

  • Drug effect over time
         PK/PD model
  • EEG experiments
         electrical activity in the brain
  • Generalised Semi-linear Canonical Correlation Analysis
    (GSLCCA)
EEG
• Electrodes placed on scalp
• Monitor difference in voltage between baseline electrode
  and others
• Produces virtually continuous signal
EEG Data
• EEG signal converted via FFT to power spectra
      ”amount” of each frequency for each time slice
      multivariate response over time


                                                          Examples of frequency periodograms


                                            0.00030
                                                                           q
                                                                                                                     0−5 minutes
                                                                                                                     120−125 minutes


                                            0.00020
                                                                       q       q


                       FFT    Power (µV2)
                      −→
                       −                                      q
                                                                   q               q

                                            0.00010
                                                              qq
                                                               q                    q
                                                                                   qqqq
                                                                   qq                          q
                                                                               q       q           q
                                                                           q                           q
                                                          q                                                q
                                                          q                                q                q
                                                                                               qqq            q
                                            0.00000


                                                                                                           qqqqqq
                                                                                                                qqqqqqqqqq
                                                                                                                           qqqqqqqqq
                                                                                                                                qqqq


                                                      0                5               10                  15   20    25    30    35

                                                                                                   Frequency (Hz)
PK/PD

• Assumptions
      drug level in brain follows pharmacokinetics model (PK)
      brain response proportional to dose level (PD)
• Expected response over time follows PK model, e.g.
  Double Exponential

                         β(exp(−k1 t) − exp(−k2 t))

  Critical Exponential
                               βtexp(−k1 t)
PK Models


           0.4
                                      Double Exponential
           0.3
           0.2                        Critical Exponential
Response

           0.1
           0.0
           −0.2


                  0   10000   20000    30000      40000

                               Time
GSLCCA (in pictures)
                                    Spectrum

                                                                                       "Observed" Value
                0.00020
Power (µV2)

                0.00000


                                                                         0.2
                           0   5      15     25     35

                                   Frequency (Hz)


                                                                         0.1
                                                              Response
                                   ×                     −→
                                                                         0.0
                                    Signature
                500 1000
  Coefficient


                                                                         −0.1
                0
                −500


                                                                                0   10000   20000   30000   40000
                           0   5      15     25     35
                                                                                             Time
                                   Frequency (Hz)
GSLCCA (in pictures)
                                    Spectrum

                                                                                                                              Fitted Values
                0.00020
Power (µV2)


                                                                                                q
                                                                                            q
                                                                                                        q
                                                                                                q           q
                0.00000


                                                                                                        q


                                                                         0.2
                                                                                    q                           q
                                                                                        q


                                                                                                                q
                                                                                                    q
                                                                                        q
                           0   5      15     25     35                                      q
                                                                                                    q

                                                                                    q
                                                                                                                    q
                                   Frequency (Hz)


                                                                         0.1
                                                              Response
                                                                                                            q       q q


                                   ×                     −→                                                               q
                                                                                                                            q


                                                                         0.0
                                                                                                                                q
                                                                                                                        q
                                    Signature                                   q                                                  q        q
                                                                                                                                    q
                                                                                                                                                q
                500 1000


                                                                                                                              qq                                        q
                                                                                                                                                    qq q    q  q         q
                                                                                                                                                      q         qq
                                                                                                                                              q q          q  q   qq
                                                                                                                                                                    q                       q
                                                                                                                                        q q                                                q q
  Coefficient


                                                                                                                                                                             q q       q
                                                                         −0.1

                                                                                                                                                    q       q
                                                                                                                                                        q           qq
                                                                                q
                                                                                                                                        q                                q q       q
                                                                                                                                    q                                     q
                                                                                                                                                                               q
                                                                                                                                                                                   qq
                                                                                                                                                                                        q
                                                                                                                                                                                         q
                0
                −500


                                                                                0                       10000                           20000                30000                 40000
                           0   5      15     25     35
                                                                                                                                            Time
                                   Frequency (Hz)
GSLCCA Method

• Canonical Correlation Analysis (CCA)
       For matrices Y and X, finds loadings a and b to
       maximise
                          cor(Y a, Xb)
• Semi-linear
       Y is the matrix of power spectra
       X = X(t, θ) defined by PK model
• Generalised
       linear coefficients b or nonlinear parameters θ may
       depend on treatment factor
gslcca Package


• gslcca function
      specify PK model by name/formula
      specify which parameters vary by treatment
      control over data smoothing
      partial CCA option
• plot, print, summary
Clonidine Experiment


• 4 treatments
      Control
      Low dose
      Medium dose
      High dose
• 8 rats in 4-period cross-over design
• EEG data recorded for 12 hours post-dose
GSLCCA Analysis
Call:

gslcca(Y = spectra, formula = "Critical Exponential", time = Time,
    subject = Rat, treatment = Treatment, separate = TRUE, ref = 1,
    data = design, subject.smooth = 4)

GSLCCA based on 8 subjects

Data smoothed at subject level using 4 roots

Nonlinear parameters:
               subject 35 subject 36 subject 37 subject 38
K1 Low Dose        7.5576     8.4252     7.8778     9.9125
K1 Middle Dose     7.8786     8.5137     8.0901     8.8885
K1 High Dose       8.9017     9.3213     9.0159     9.1980
               subject 39 subject 40 subject 41 subject 42
K1 Low Dose        8.7217     8.0102     8.7103     8.1199
K1 Middle Dose     8.8546     8.5952     9.1854     8.3800
K1 High Dose       9.0439     9.1611     9.3047     8.9933
Fitted Model
plot(result, "fitted")
Observed + Fitted
plot(result, "scores")
Signatures
plot(result, "signatures")

                               Signatures Corresponding to Different Subjects

                                                                           Subject 35
                                                                           Subject 36
                                                                           Subject 37
                    500

                                                                           Subject 38
                                                                           Subject 39
                                                                           Subject 40
                                                                           Subject 41
                                                                           Subject 42
      Coefficient

                    0
                    −500


                           0       5     10     15      20       25   30        35

                                                Frequency (Hz)
Normalised Signatures

                         Signatures Corresponding to Different Subjects

                                                                     Subject 35
                                                                     Subject 36
              0.6                                                    Subject 37
                                                                     Subject 38
                                                                     Subject 39
              0.4


                                                                     Subject 40
                                                                     Subject 41
                                                                     Subject 42
              0.2
Coefficient

              0.0
              −0.2
              −0.4


                     0       5     10     15      20       25   30        35

                                          Frequency (Hz)
Mean Signature

                                  Mean Signature
              0.6


                                                                   • contribution of power
              0.4


                                                                     at each frequency to
                                                                     PK curve over time
Coefficient

              0.2


                                                                   • assumed to be specific
              0.0


                                                                     to the target drug is
                                                                     aimed at
              −0.2


                     0   5   10    15      20       25   30   35

                                   Frequency (Hz)
0.6
              0.4                 Control/Inactive Signature


                                                               • if drug inactive, any
                                                                 dose ≡ control
Coefficient

              0.2


                                                               • inactive drug has same
              0.0


                                                                 signature as control
              −0.2


                     0   5   10    15     20    25   30   35

                                    Frequency
0.6                 Control/Inactive Signature


                                                          clonidine
                                                          vehicle
              0.4


                                                                      • In this case drug clearly
                                                                        different from control
Coefficient

              0.2


                                                                      • Drug is active - as
              0.0


                                                                        expected!
              −0.2


                     0   5   10    15     20    25   30        35

                                    Frequency
200             Comparing Active Drugs


                                               Drug A
                                               Drug B


                                                        • Two drugs targeting
              150


                                                          same ion channel,
              100


                                                          different receptors
Coefficient

              50


                                                        • Run t-tests to compare
              0


                                                          loadings at each
              −50


                                                          frequency
              −100


                     0   20     40        60     80

                              Frequency
3.0                    Snapshot Analysis


                                             delta
                                             theta
                                             alpha
             2.5


                                             beta
                                             gamma   • P-values adjusted using
             2.0
− log10(p)


                                                       FDR
             1.5


                                                     • Frequencies split into
             1.0


                                                       conventional bands
             0.5
             0.0


                   0   20     40        60     80

                            Frequency
Summary


gslcca package is in development on R-Forge
https://r-forge.r-project.org/projects/gslcca/

Further work needed before release to CRAN, e.g.

  • fitting PK/PD model to all rats simultaneously
  • adjusting for control response

Detecting Drug Effects in the Brain

  • 1.
    Detecting Drug Effectsin the Brain Heather Turner, Phil Brain and Foteini Strimenopoulou Nonclinical Statistics Pfizer, UK 18 August 2011
  • 2.
    Background Aim: identify andcharacterise effect of drug on the brain • Drug effect over time PK/PD model • EEG experiments electrical activity in the brain • Generalised Semi-linear Canonical Correlation Analysis (GSLCCA)
  • 3.
    EEG • Electrodes placedon scalp • Monitor difference in voltage between baseline electrode and others • Produces virtually continuous signal
  • 4.
    EEG Data • EEGsignal converted via FFT to power spectra ”amount” of each frequency for each time slice multivariate response over time Examples of frequency periodograms 0.00030 q 0−5 minutes 120−125 minutes 0.00020 q q FFT Power (µV2) −→ − q q q 0.00010 qq q q qqqq qq q q q q q q q q q q q qqq q 0.00000 qqqqqq qqqqqqqqqq qqqqqqqqq qqqq 0 5 10 15 20 25 30 35 Frequency (Hz)
  • 5.
    PK/PD • Assumptions drug level in brain follows pharmacokinetics model (PK) brain response proportional to dose level (PD) • Expected response over time follows PK model, e.g. Double Exponential β(exp(−k1 t) − exp(−k2 t)) Critical Exponential βtexp(−k1 t)
  • 6.
    PK Models 0.4 Double Exponential 0.3 0.2 Critical Exponential Response 0.1 0.0 −0.2 0 10000 20000 30000 40000 Time
  • 7.
    GSLCCA (in pictures) Spectrum "Observed" Value 0.00020 Power (µV2) 0.00000 0.2 0 5 15 25 35 Frequency (Hz) 0.1 Response × −→ 0.0 Signature 500 1000 Coefficient −0.1 0 −500 0 10000 20000 30000 40000 0 5 15 25 35 Time Frequency (Hz)
  • 8.
    GSLCCA (in pictures) Spectrum Fitted Values 0.00020 Power (µV2) q q q q q 0.00000 q 0.2 q q q q q q 0 5 15 25 35 q q q q Frequency (Hz) 0.1 Response q q q × −→ q q 0.0 q q Signature q q q q q 500 1000 qq q qq q q q q q qq q q q q qq q q q q q q Coefficient q q q −0.1 q q q qq q q q q q q q q qq q q 0 −500 0 10000 20000 30000 40000 0 5 15 25 35 Time Frequency (Hz)
  • 9.
    GSLCCA Method • CanonicalCorrelation Analysis (CCA) For matrices Y and X, finds loadings a and b to maximise cor(Y a, Xb) • Semi-linear Y is the matrix of power spectra X = X(t, θ) defined by PK model • Generalised linear coefficients b or nonlinear parameters θ may depend on treatment factor
  • 10.
    gslcca Package • gslccafunction specify PK model by name/formula specify which parameters vary by treatment control over data smoothing partial CCA option • plot, print, summary
  • 11.
    Clonidine Experiment • 4treatments Control Low dose Medium dose High dose • 8 rats in 4-period cross-over design • EEG data recorded for 12 hours post-dose
  • 12.
    GSLCCA Analysis Call: gslcca(Y =spectra, formula = "Critical Exponential", time = Time, subject = Rat, treatment = Treatment, separate = TRUE, ref = 1, data = design, subject.smooth = 4) GSLCCA based on 8 subjects Data smoothed at subject level using 4 roots Nonlinear parameters: subject 35 subject 36 subject 37 subject 38 K1 Low Dose 7.5576 8.4252 7.8778 9.9125 K1 Middle Dose 7.8786 8.5137 8.0901 8.8885 K1 High Dose 8.9017 9.3213 9.0159 9.1980 subject 39 subject 40 subject 41 subject 42 K1 Low Dose 8.7217 8.0102 8.7103 8.1199 K1 Middle Dose 8.8546 8.5952 9.1854 8.3800 K1 High Dose 9.0439 9.1611 9.3047 8.9933
  • 13.
  • 14.
  • 15.
    Signatures plot(result, "signatures") Signatures Corresponding to Different Subjects Subject 35 Subject 36 Subject 37 500 Subject 38 Subject 39 Subject 40 Subject 41 Subject 42 Coefficient 0 −500 0 5 10 15 20 25 30 35 Frequency (Hz)
  • 16.
    Normalised Signatures Signatures Corresponding to Different Subjects Subject 35 Subject 36 0.6 Subject 37 Subject 38 Subject 39 0.4 Subject 40 Subject 41 Subject 42 0.2 Coefficient 0.0 −0.2 −0.4 0 5 10 15 20 25 30 35 Frequency (Hz)
  • 17.
    Mean Signature Mean Signature 0.6 • contribution of power 0.4 at each frequency to PK curve over time Coefficient 0.2 • assumed to be specific 0.0 to the target drug is aimed at −0.2 0 5 10 15 20 25 30 35 Frequency (Hz)
  • 18.
    0.6 0.4 Control/Inactive Signature • if drug inactive, any dose ≡ control Coefficient 0.2 • inactive drug has same 0.0 signature as control −0.2 0 5 10 15 20 25 30 35 Frequency
  • 19.
    0.6 Control/Inactive Signature clonidine vehicle 0.4 • In this case drug clearly different from control Coefficient 0.2 • Drug is active - as 0.0 expected! −0.2 0 5 10 15 20 25 30 35 Frequency
  • 20.
    200 Comparing Active Drugs Drug A Drug B • Two drugs targeting 150 same ion channel, 100 different receptors Coefficient 50 • Run t-tests to compare 0 loadings at each −50 frequency −100 0 20 40 60 80 Frequency
  • 21.
    3.0 Snapshot Analysis delta theta alpha 2.5 beta gamma • P-values adjusted using 2.0 − log10(p) FDR 1.5 • Frequencies split into 1.0 conventional bands 0.5 0.0 0 20 40 60 80 Frequency
  • 22.
    Summary gslcca package isin development on R-Forge https://r-forge.r-project.org/projects/gslcca/ Further work needed before release to CRAN, e.g. • fitting PK/PD model to all rats simultaneously • adjusting for control response