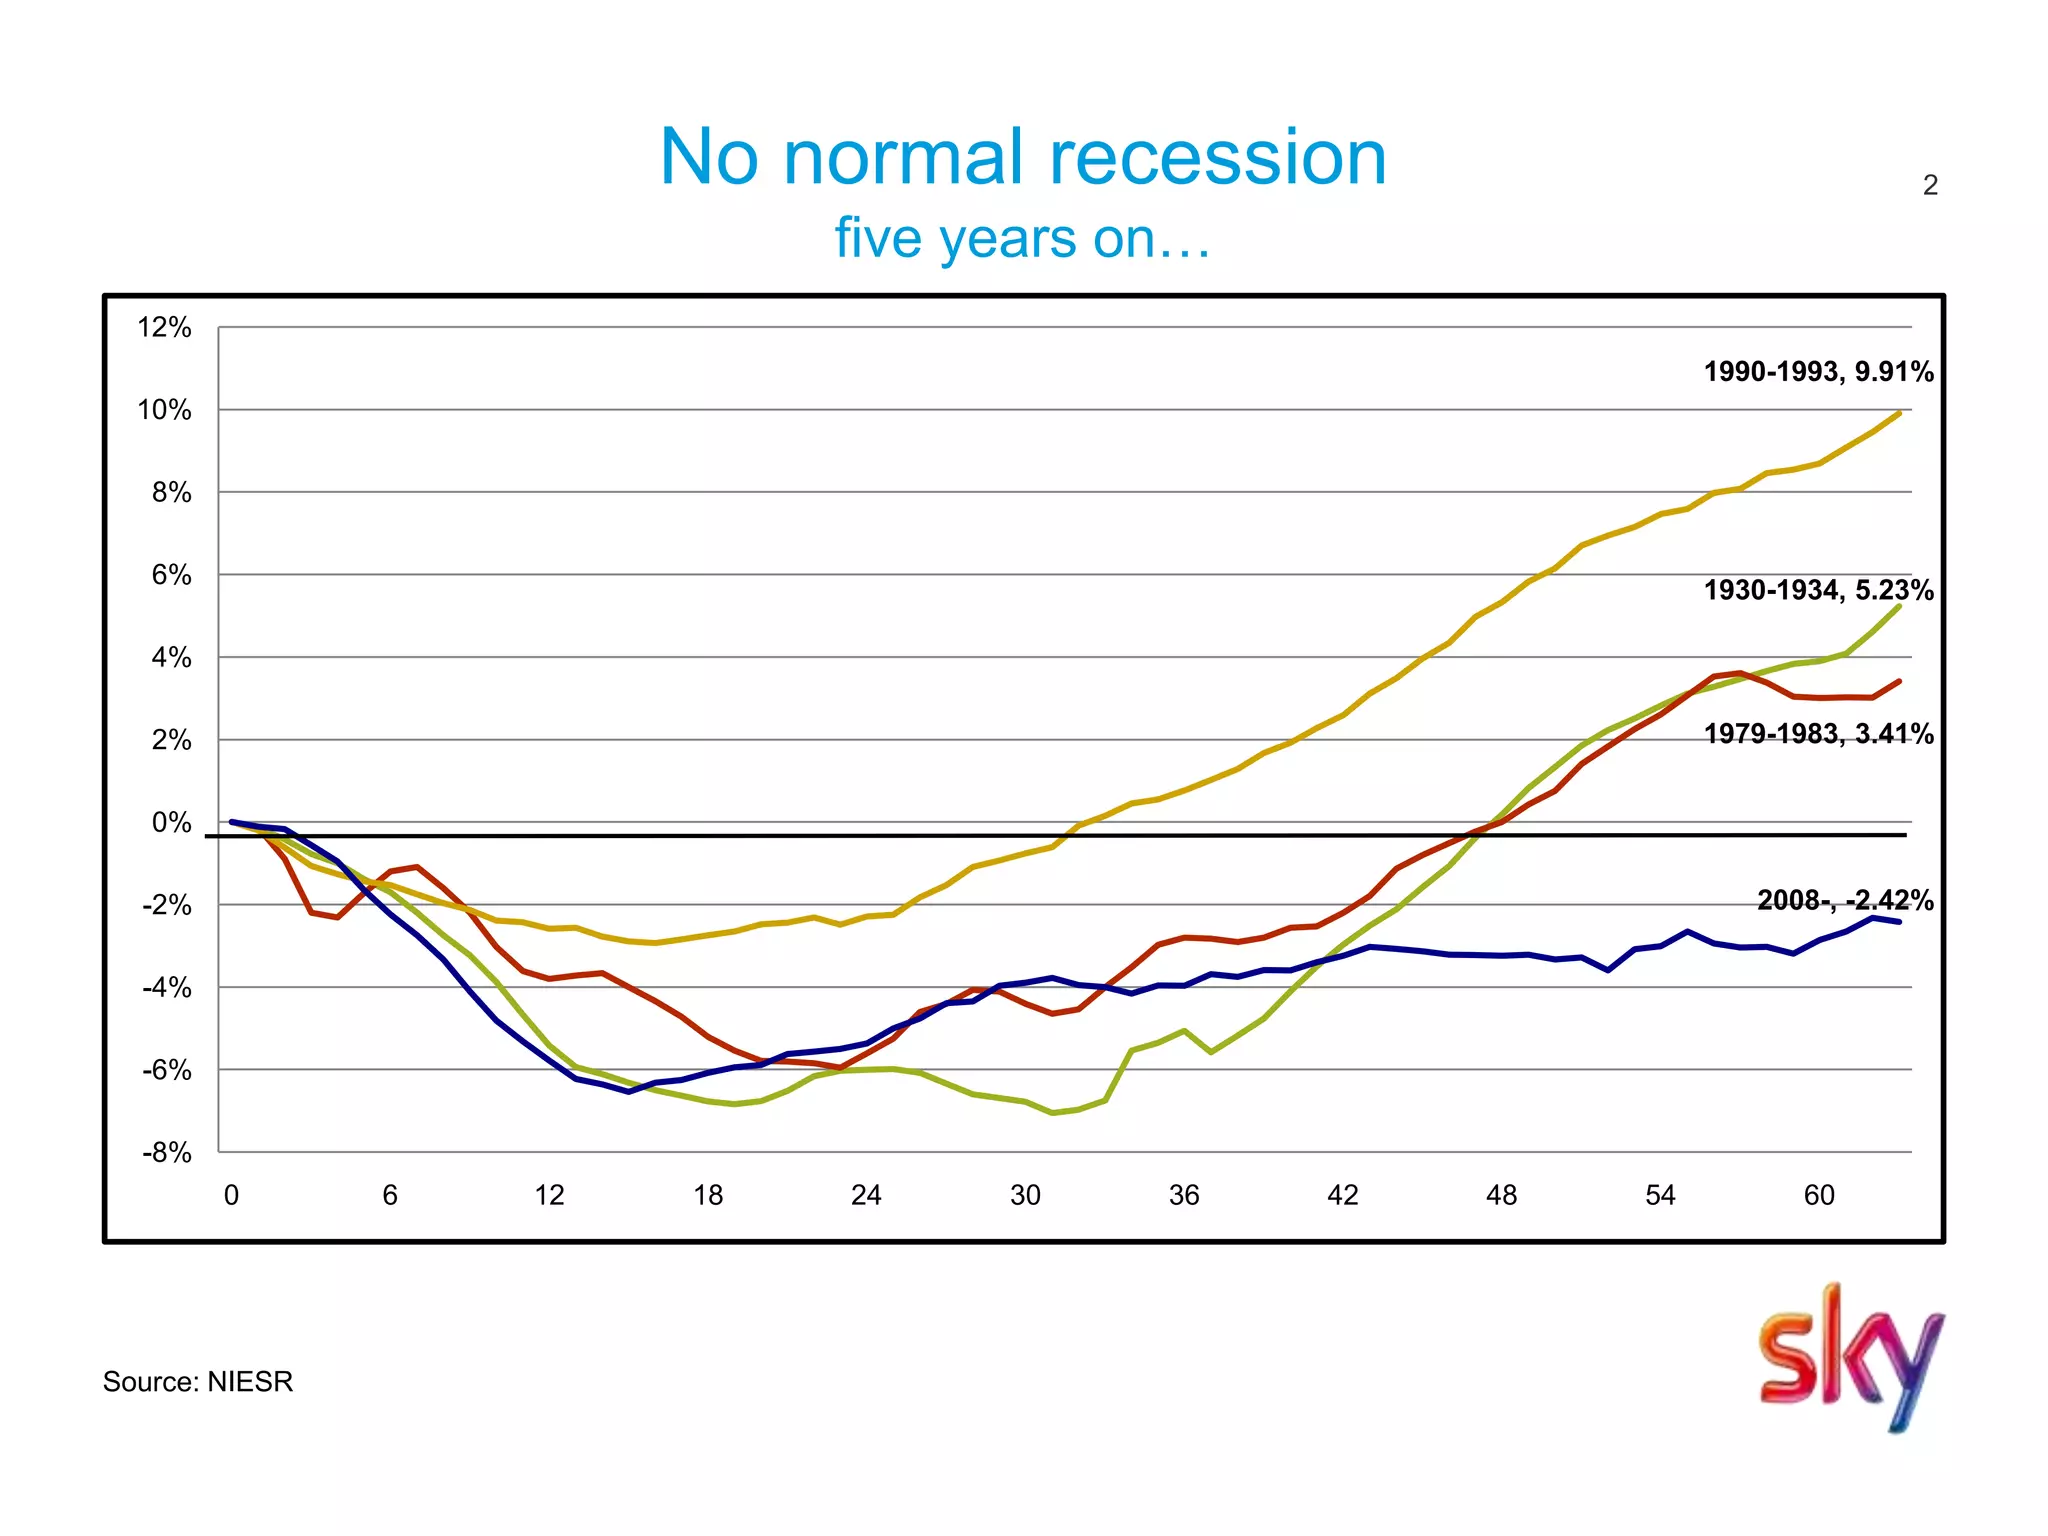
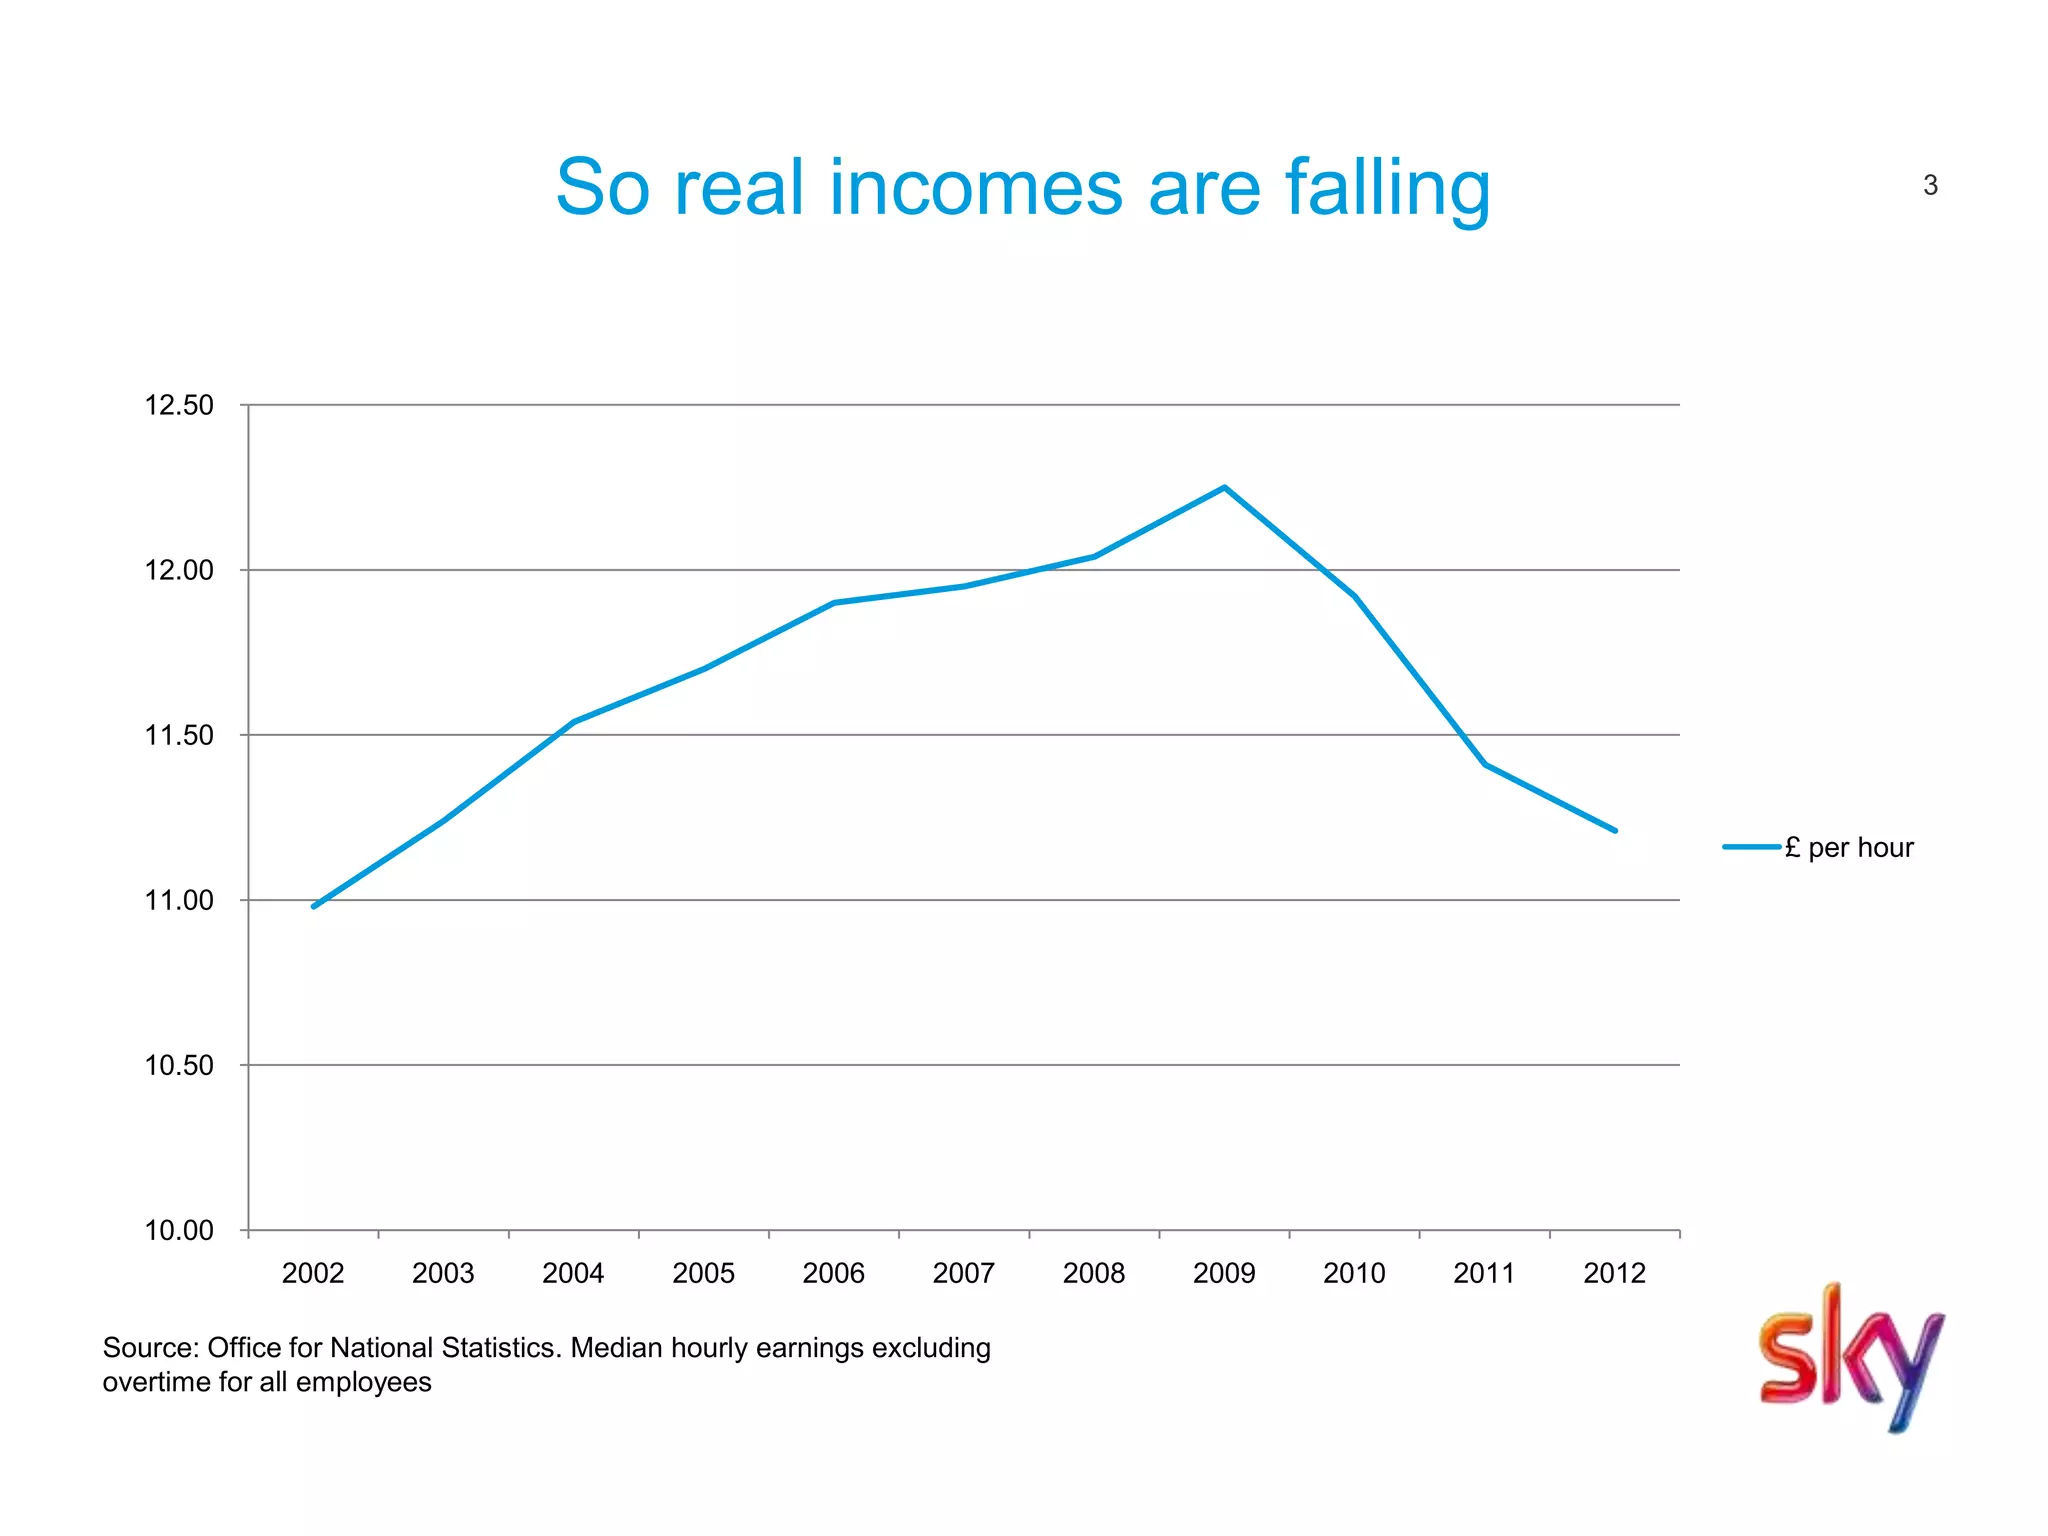
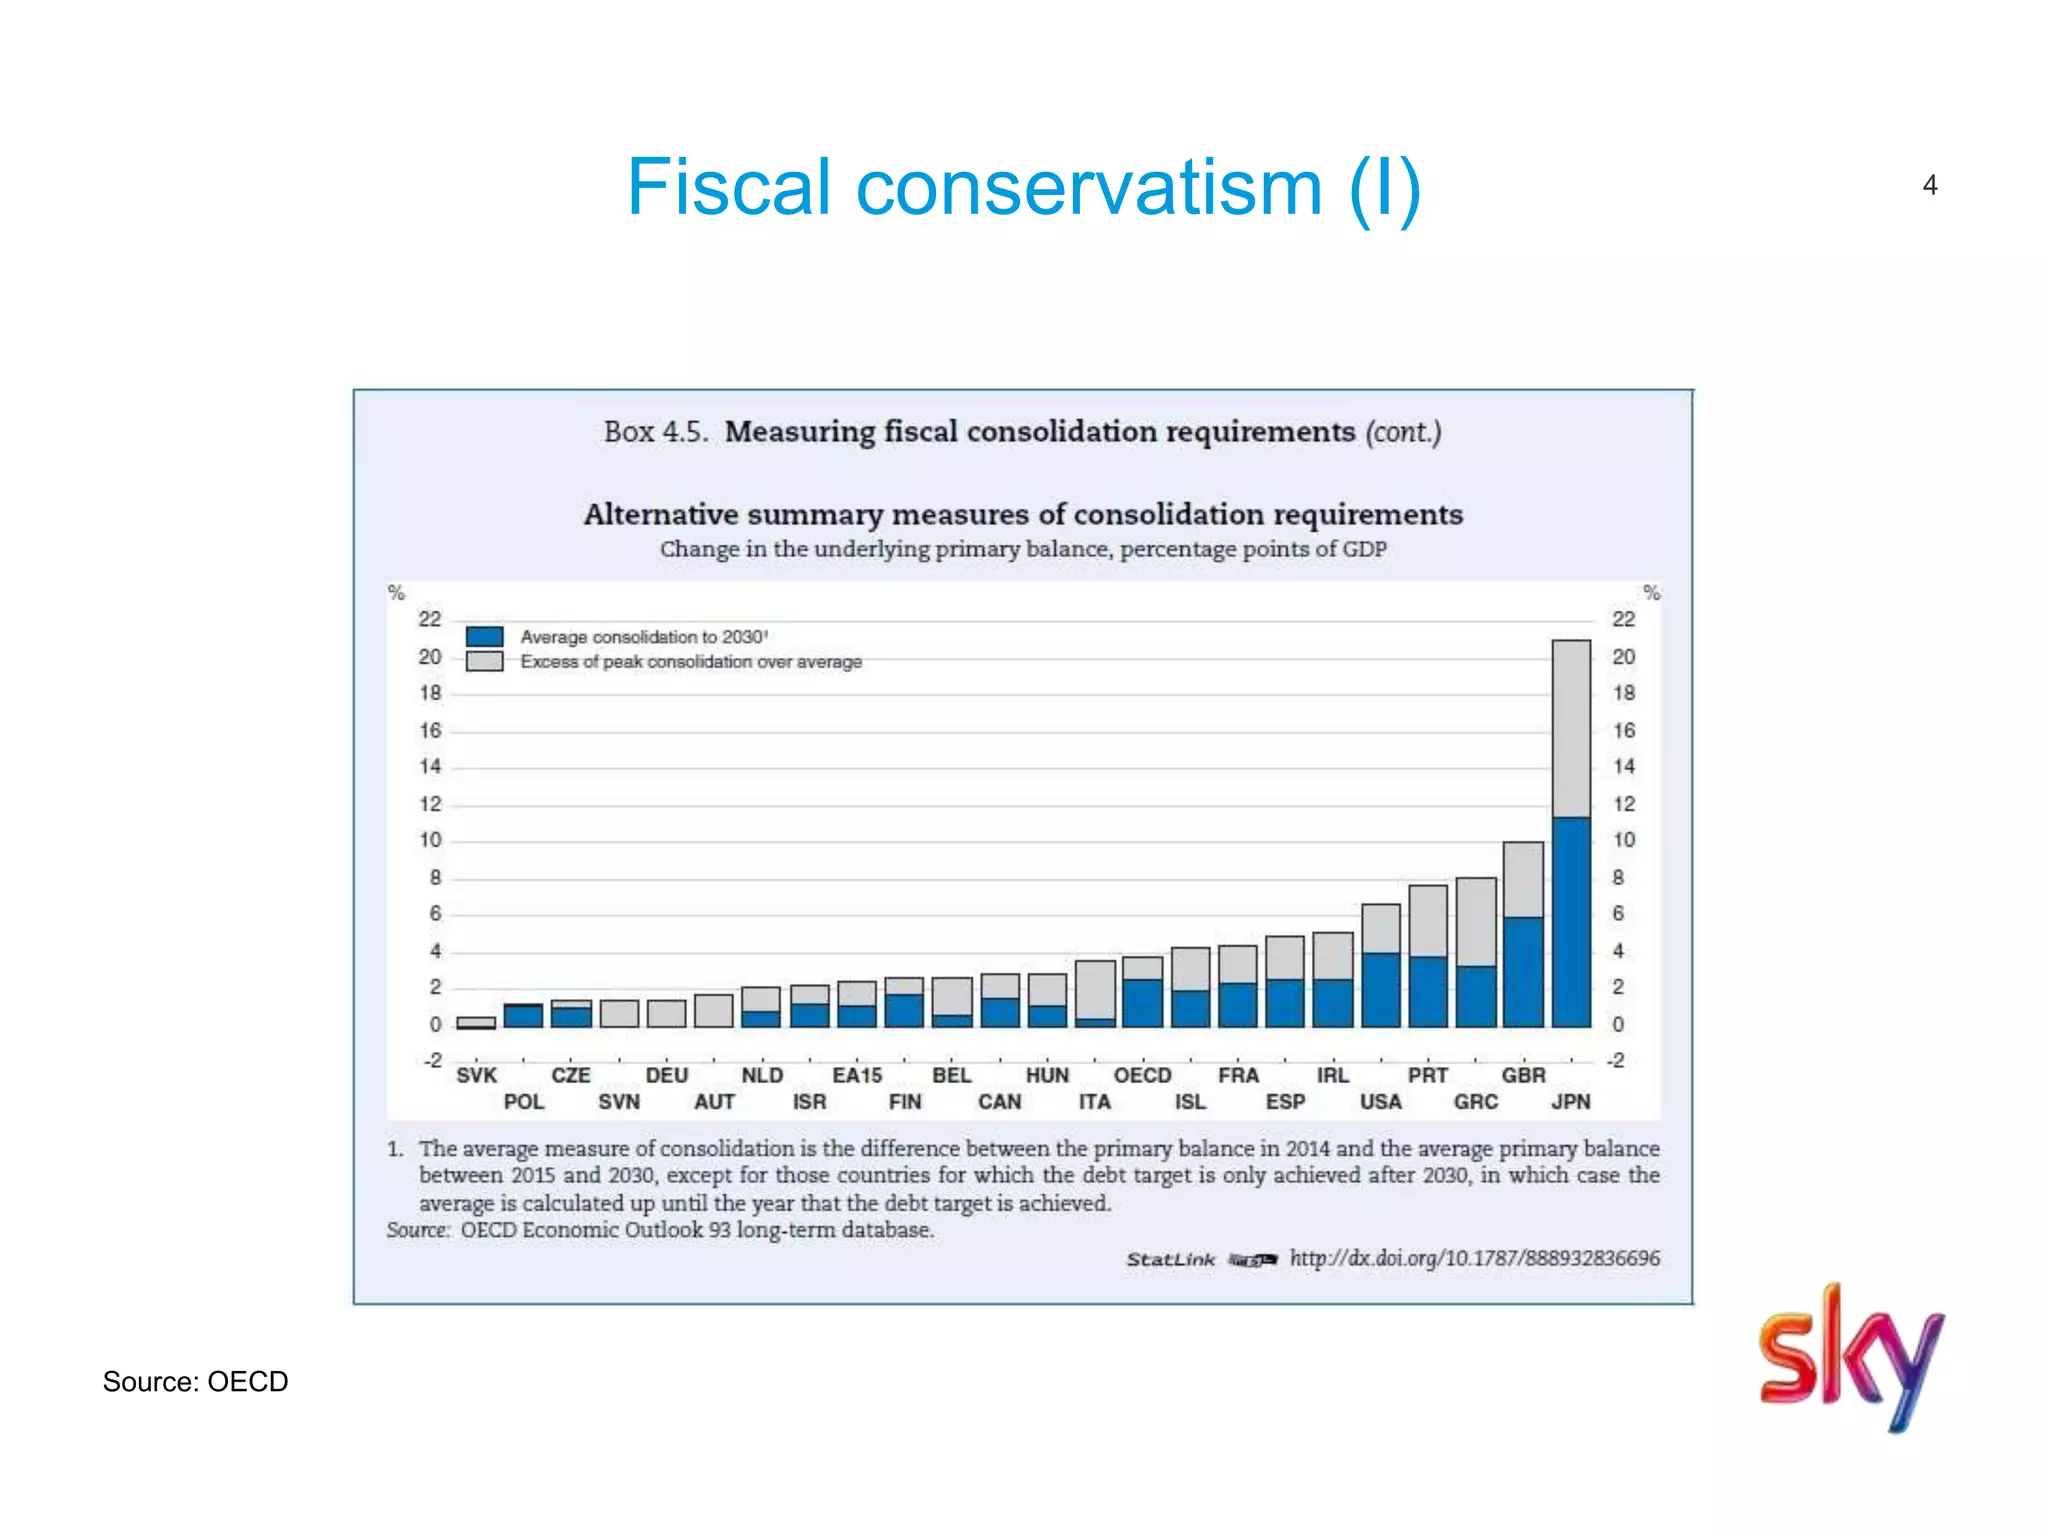
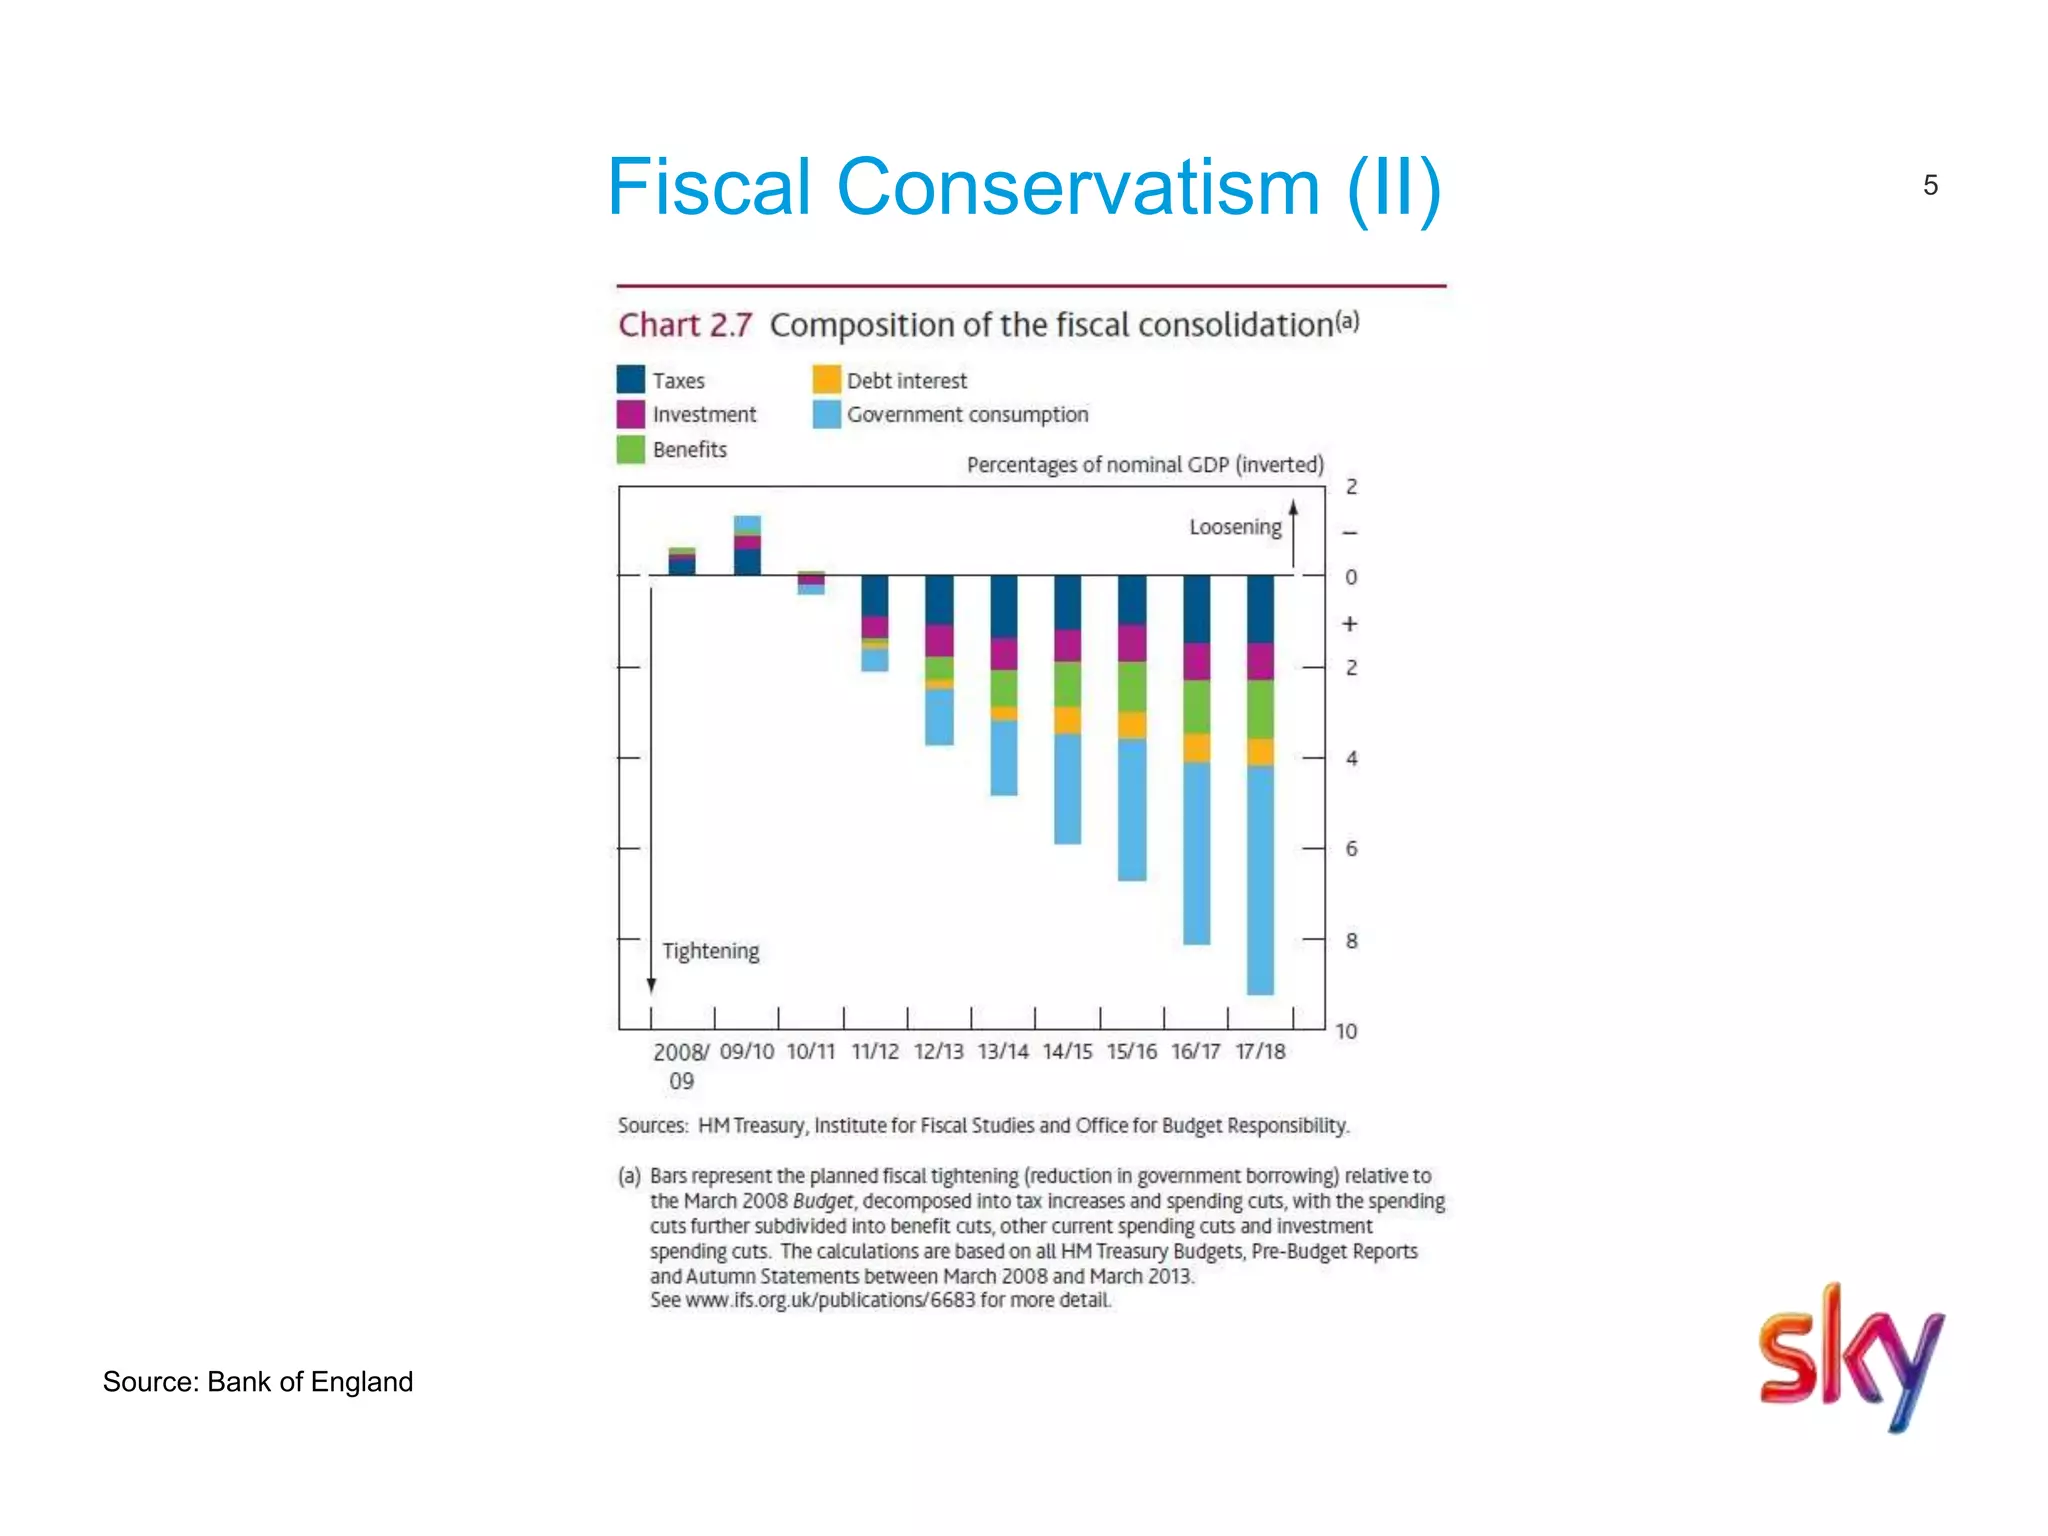
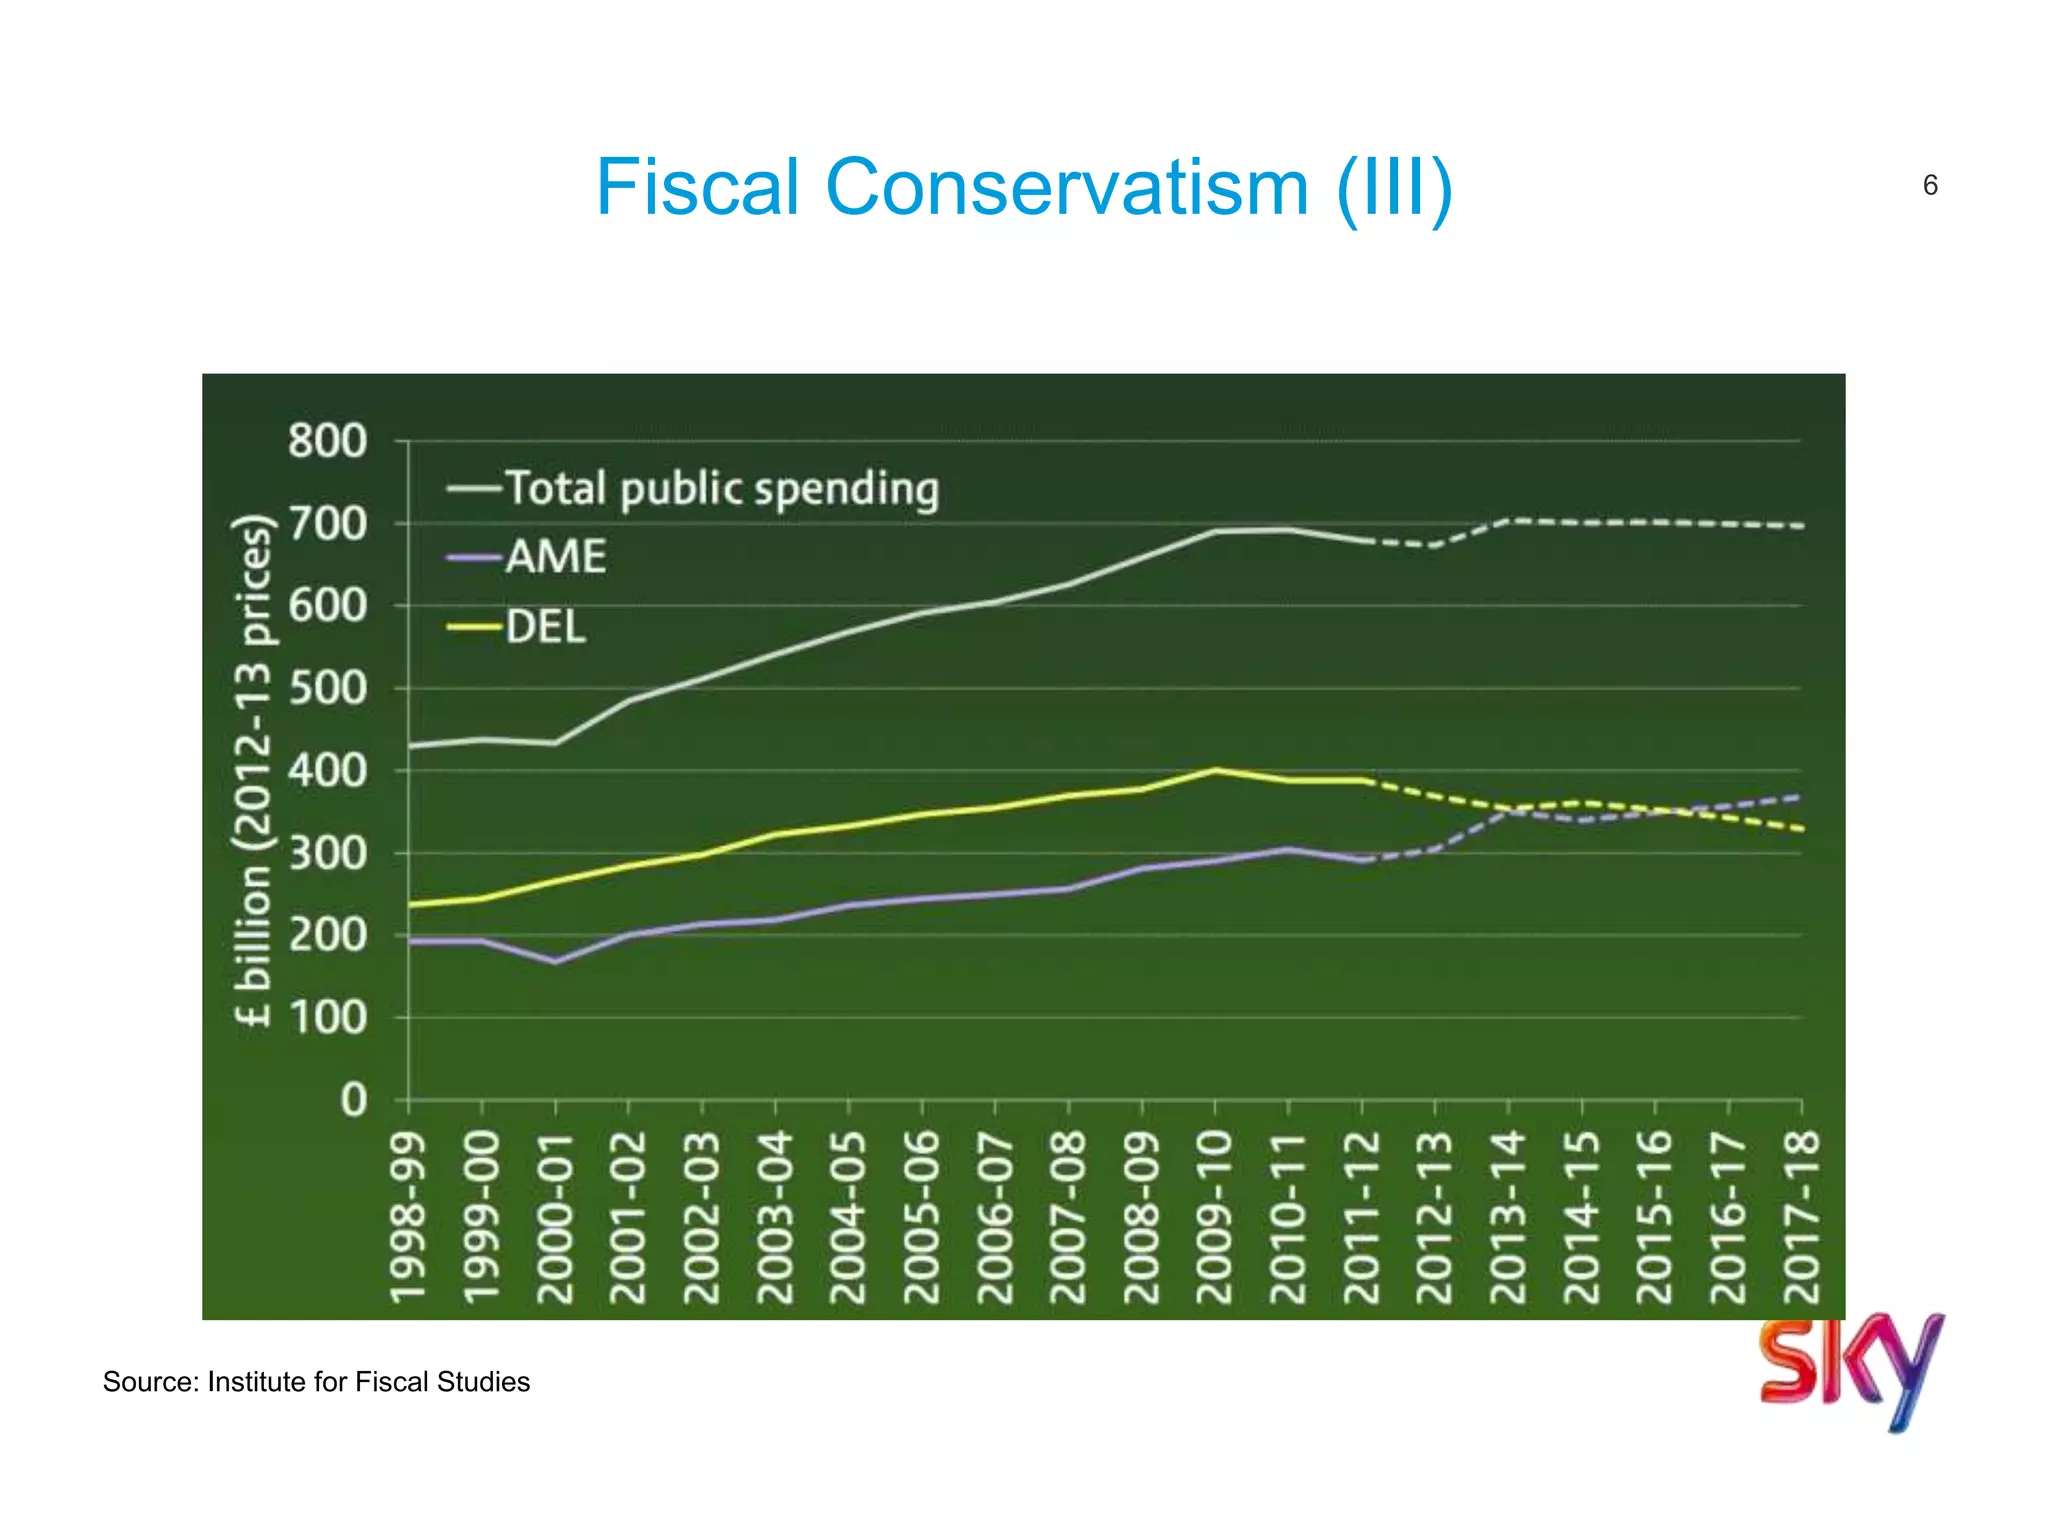
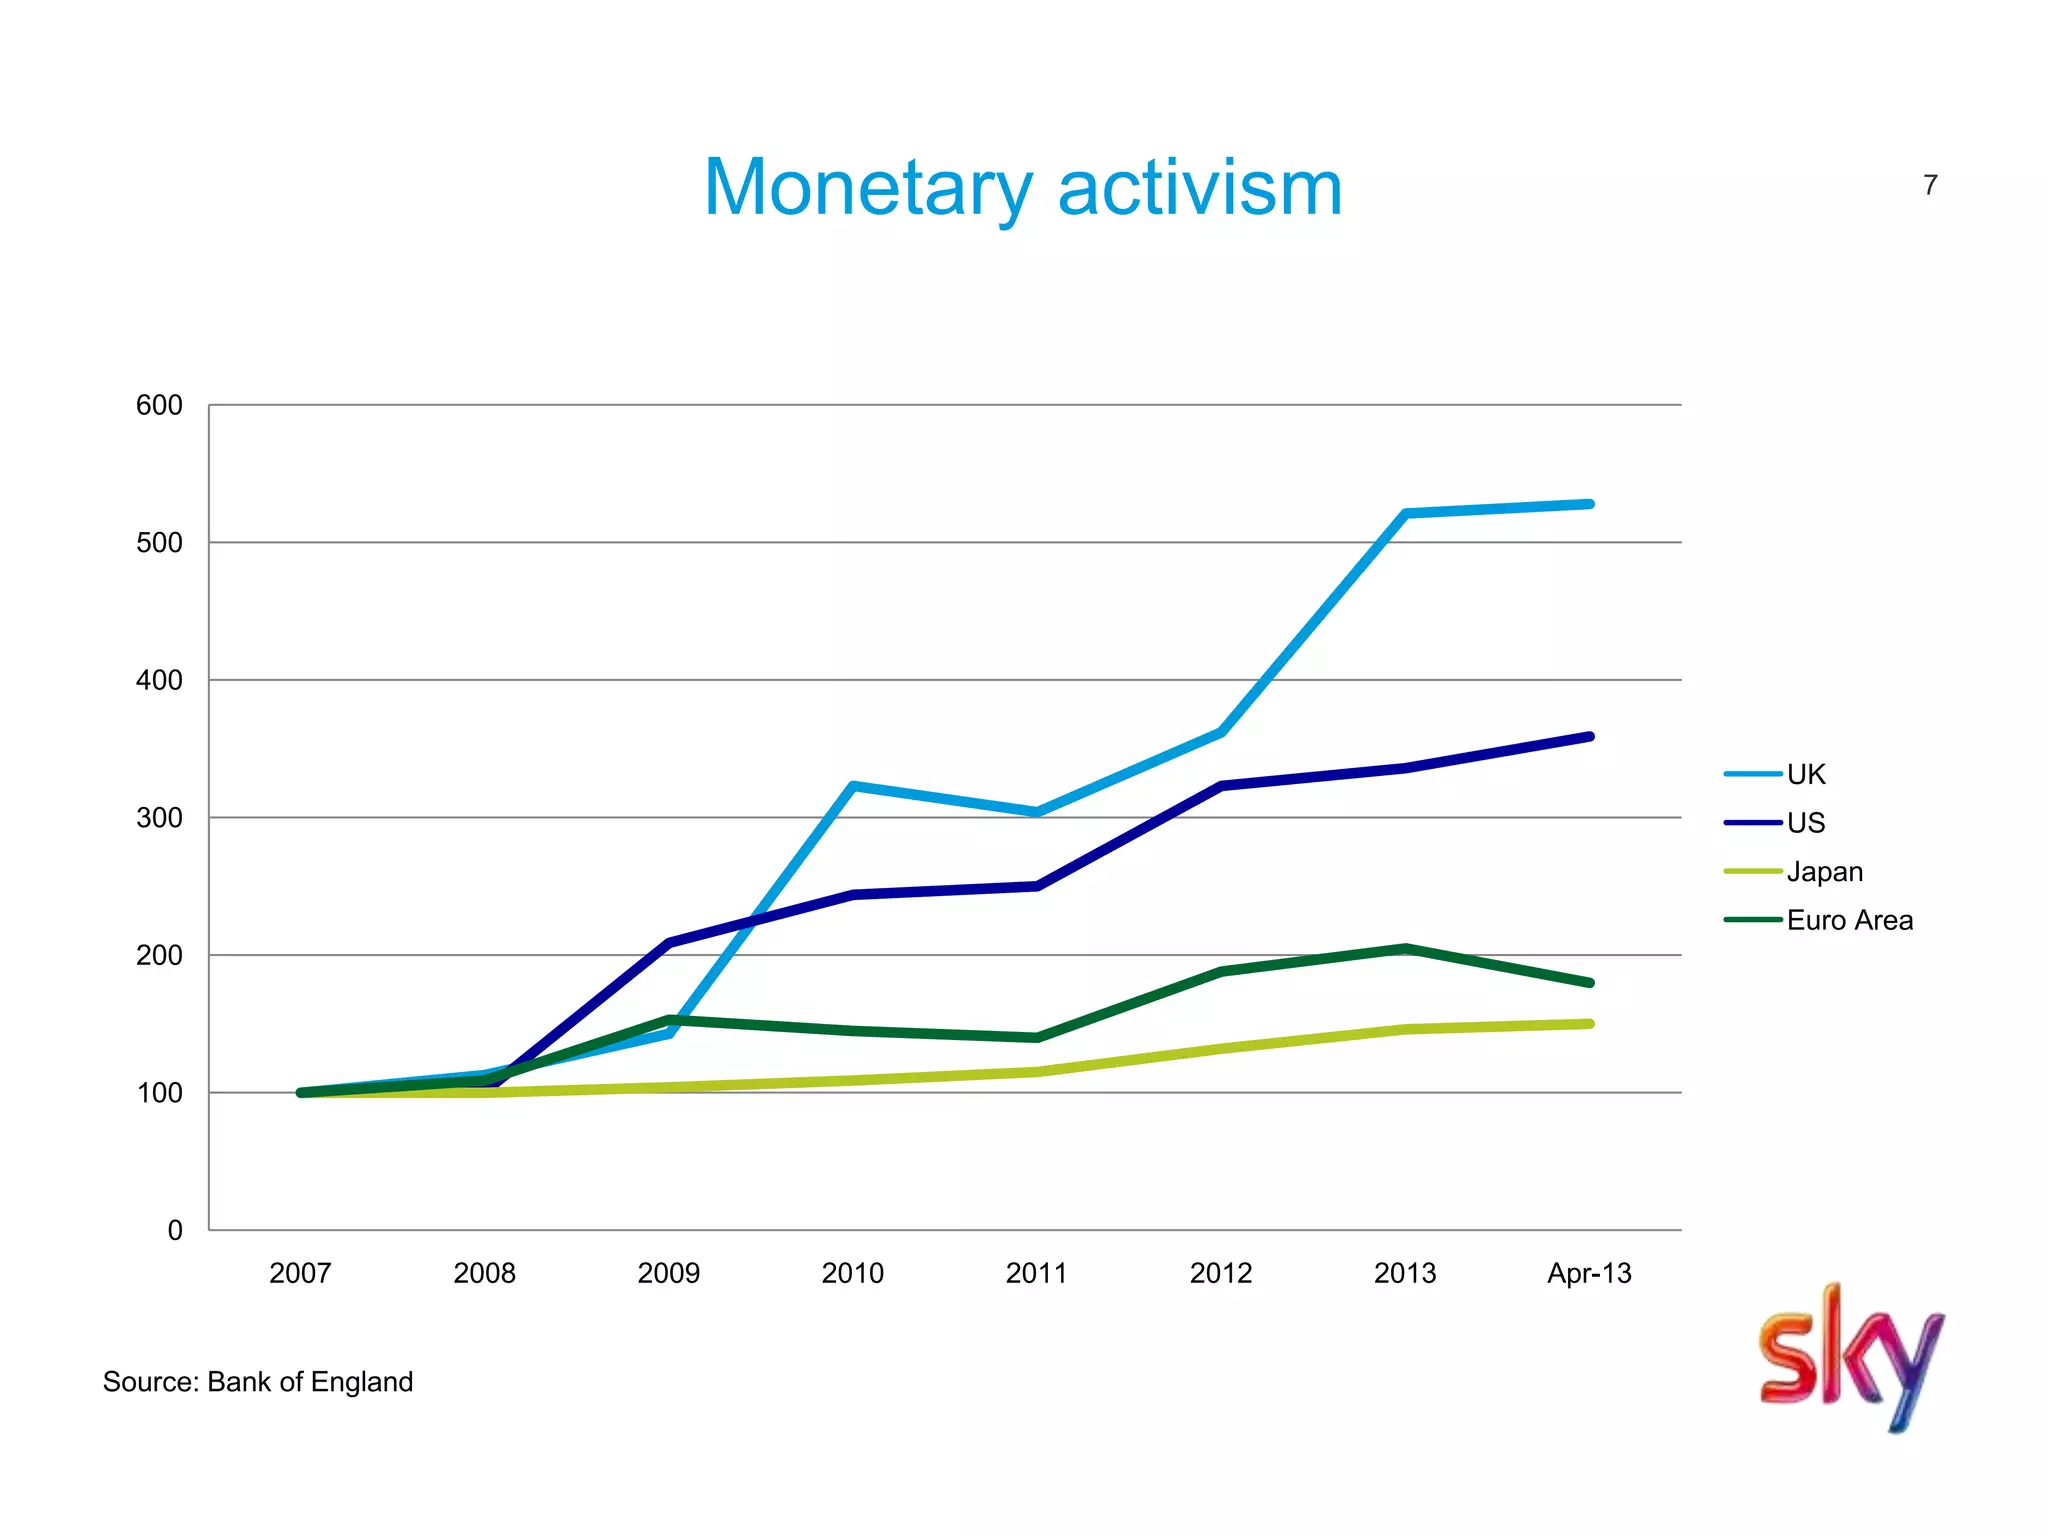
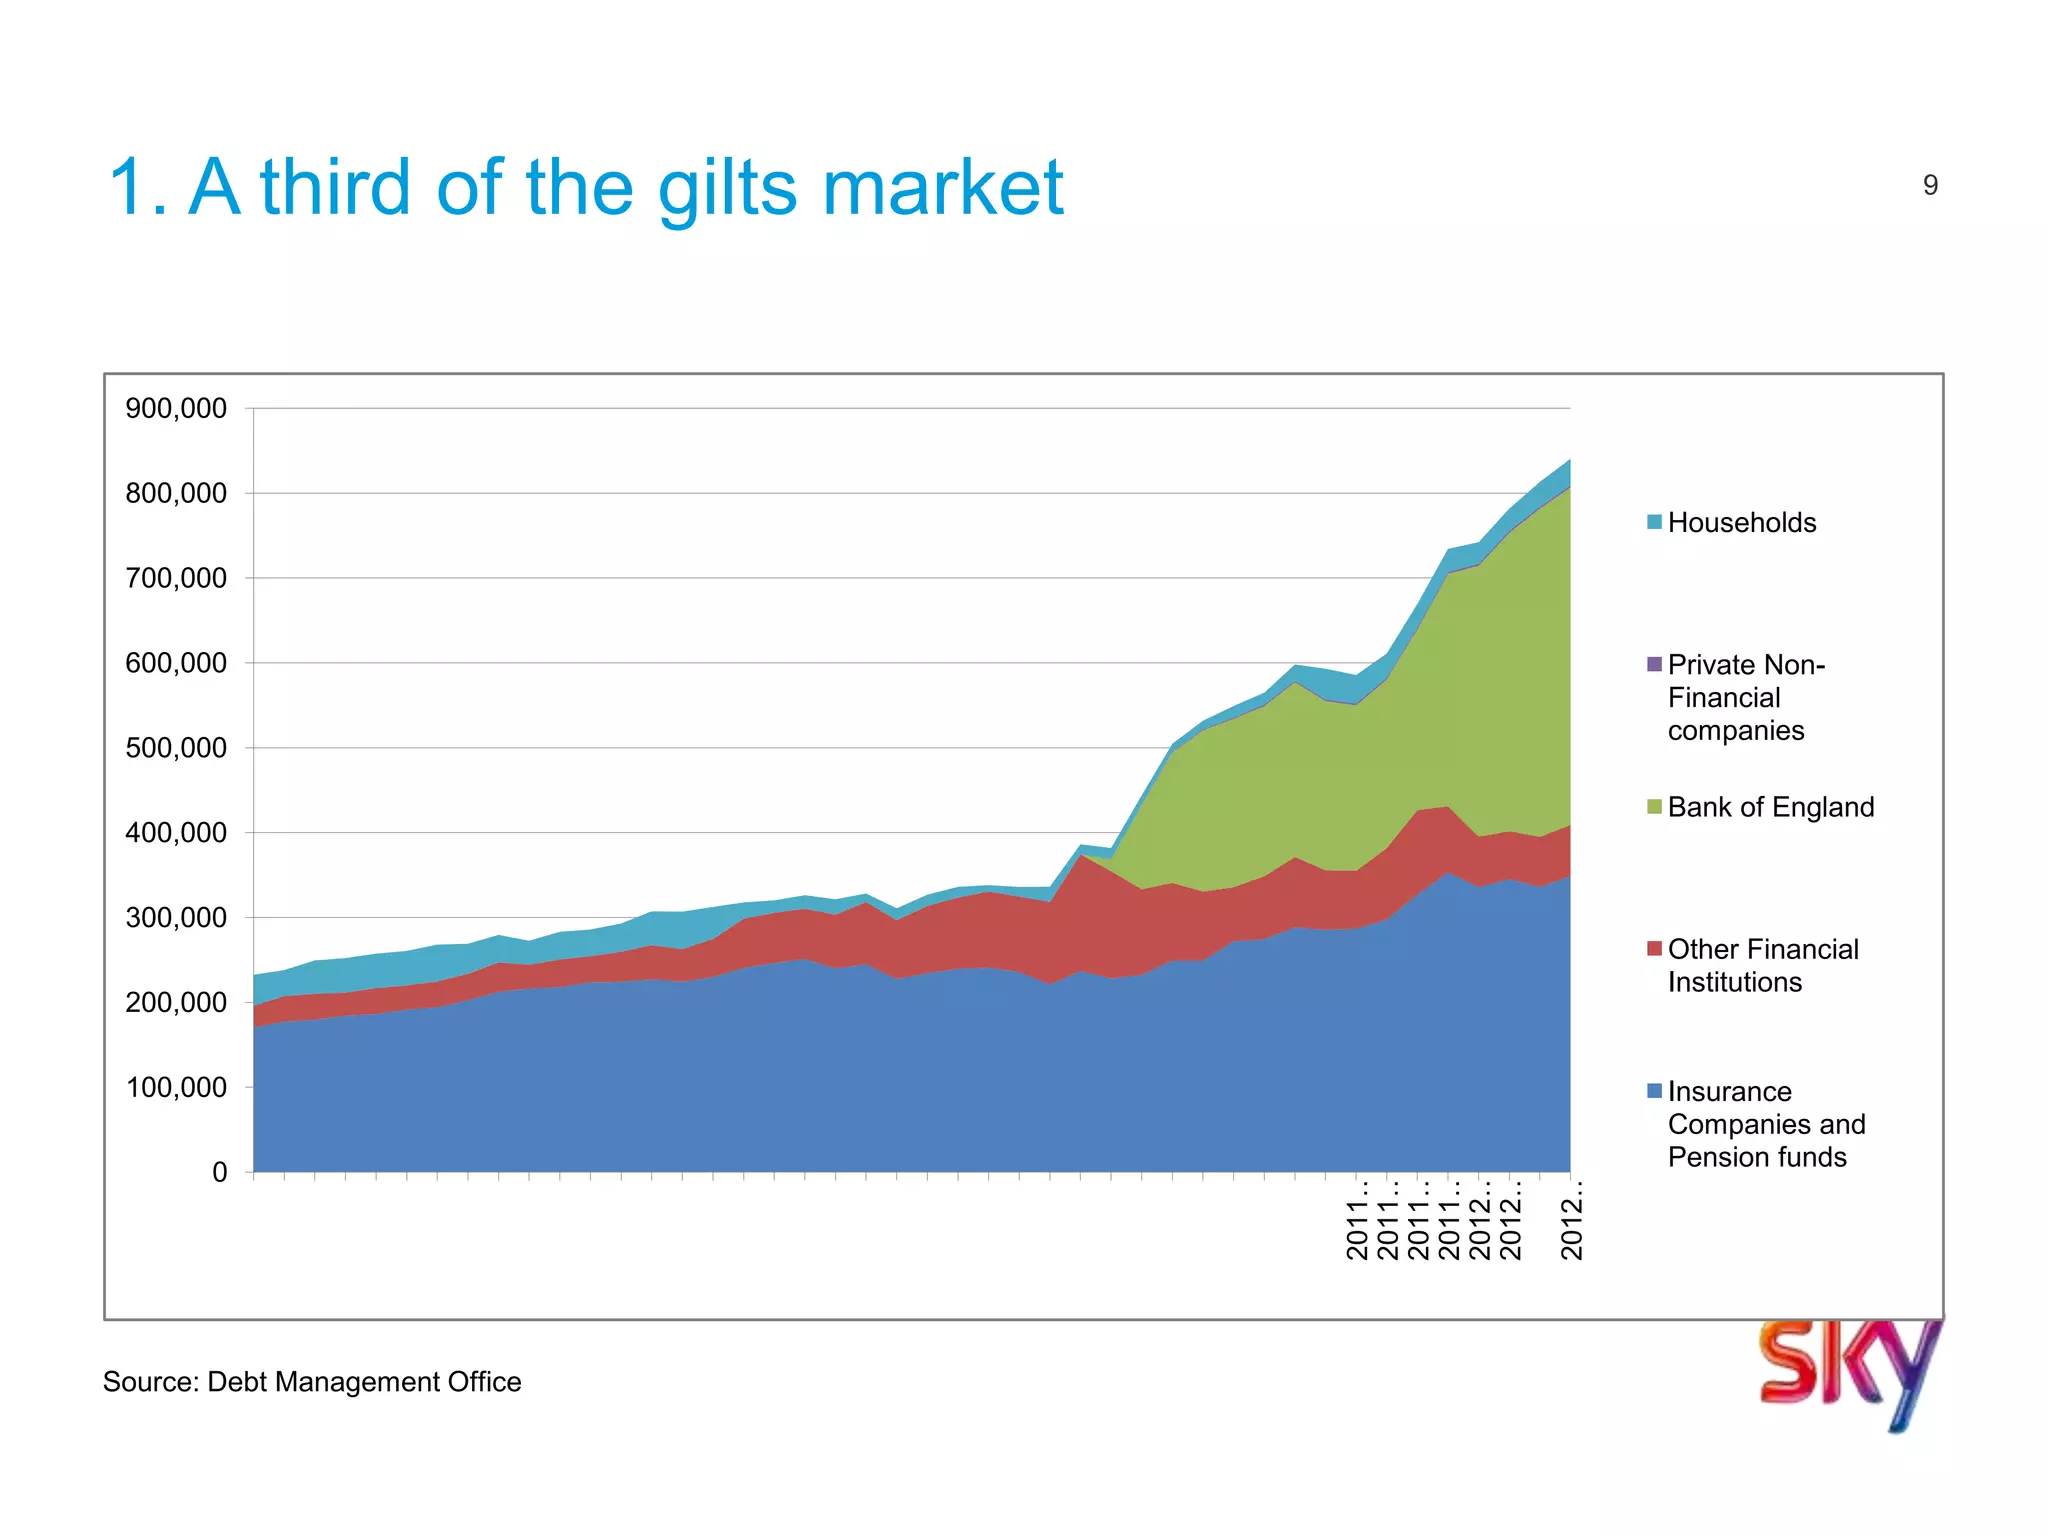
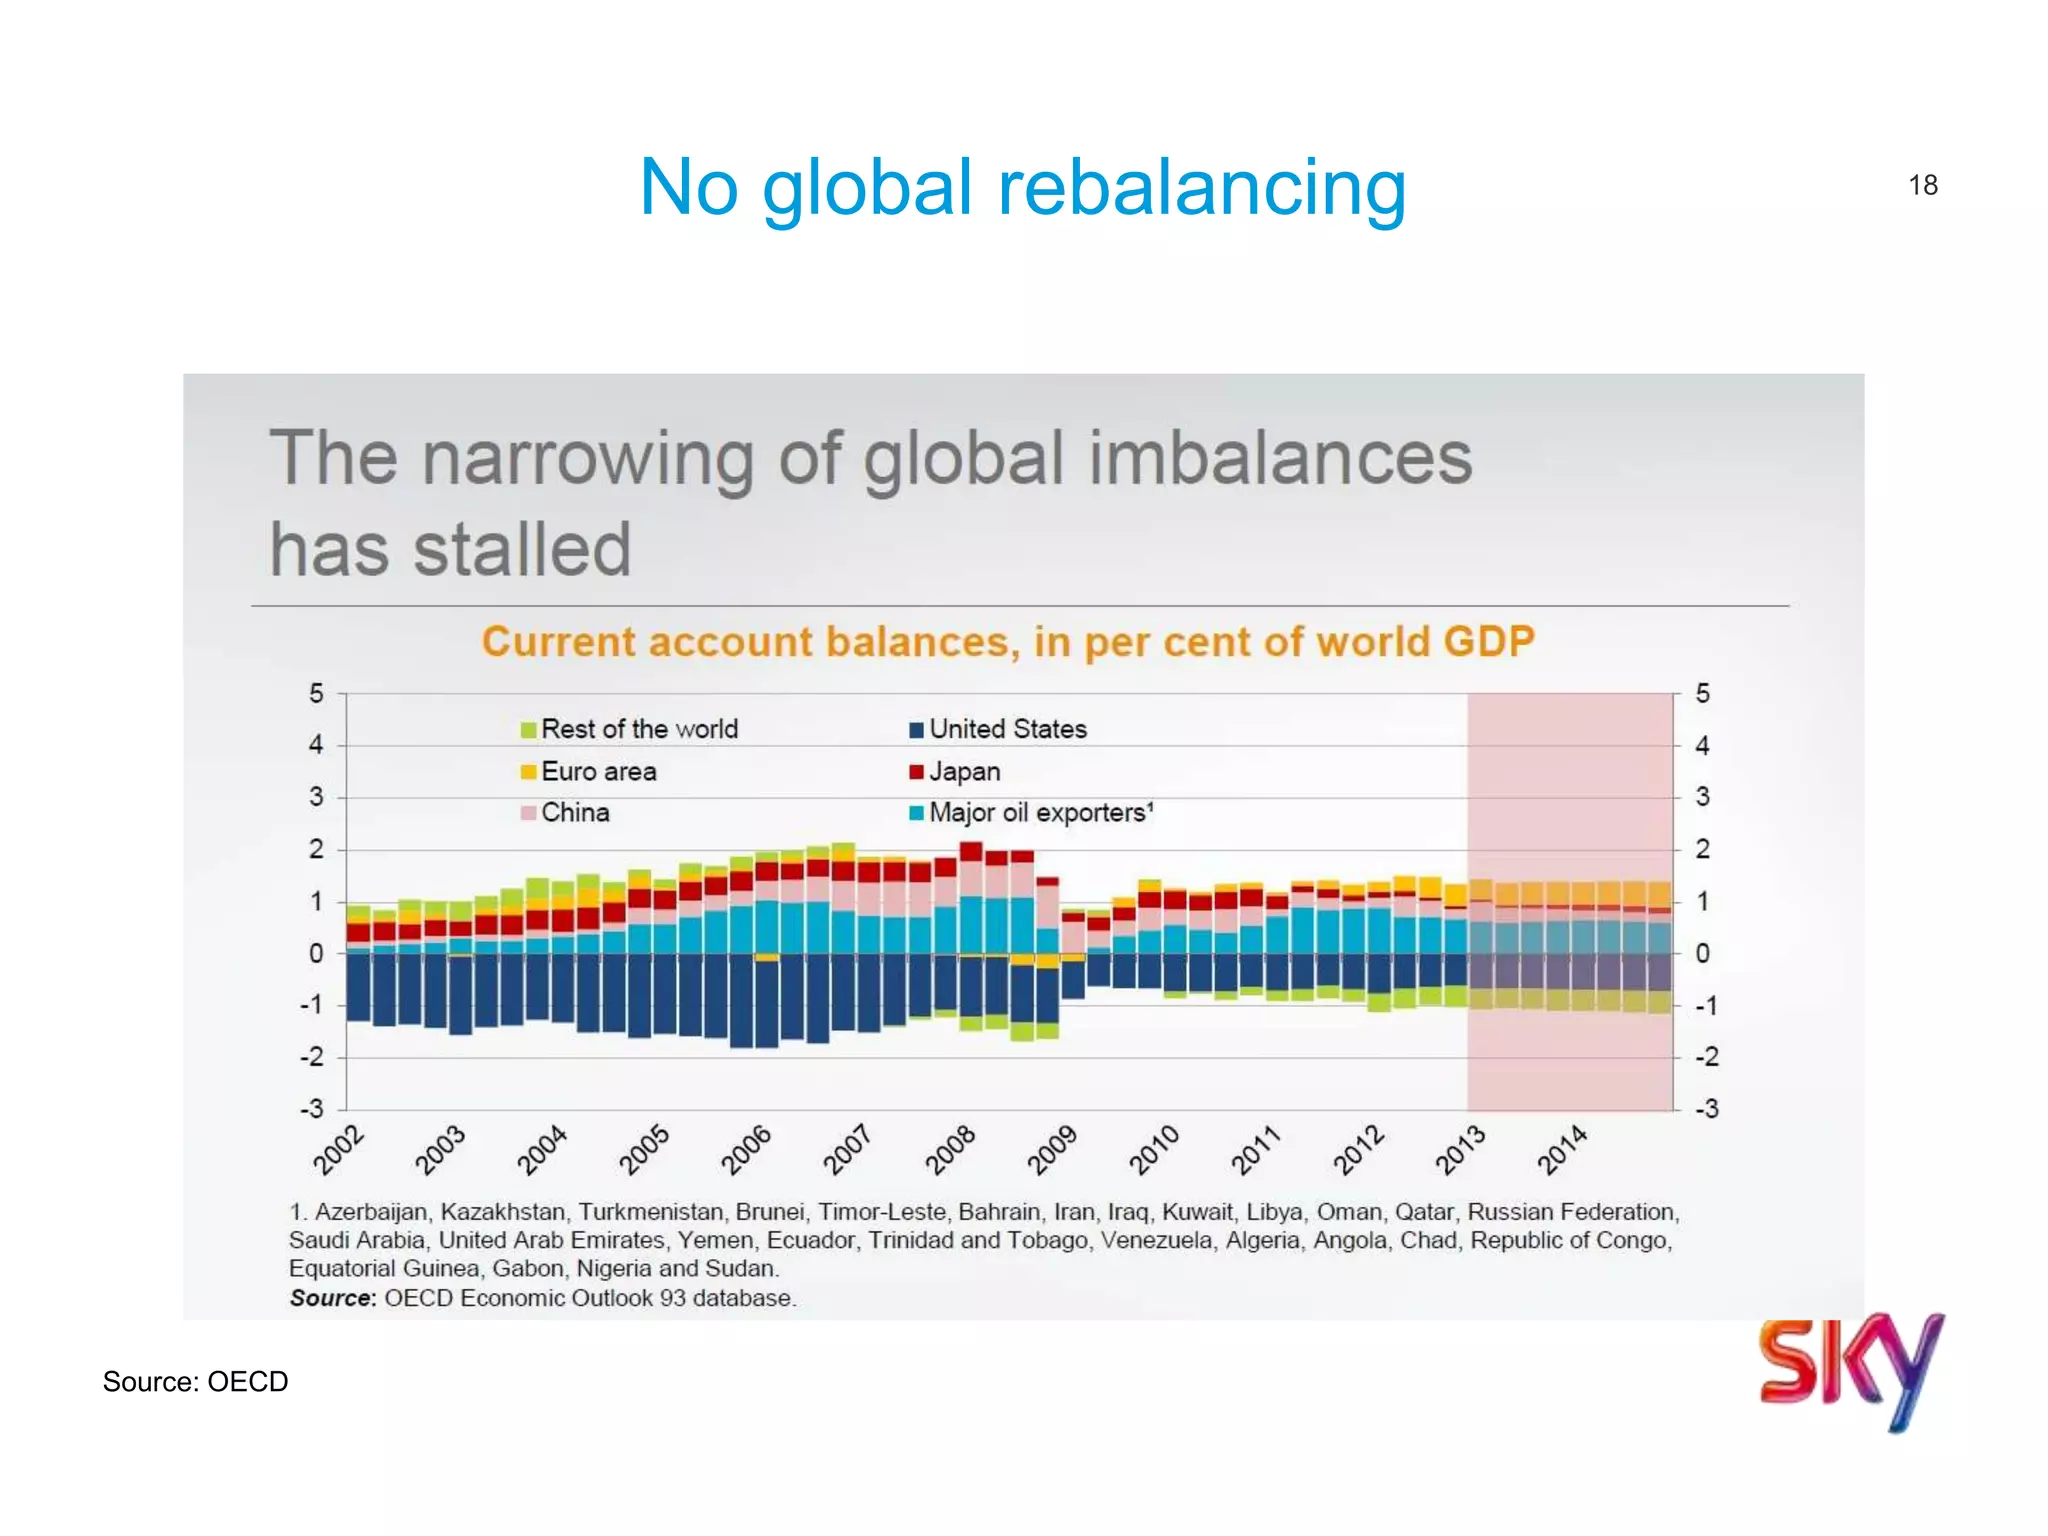
Economics Teacher Conference
Ed Conway
July 2011
2No normal recession
five years on…
1930-1934, 5.23%
1979-1983, 3.41%
1990-1993, 9.91%
2008-, -2.42%
-8%
-6%
-4%
-2%
0%
2%
4%
6%
8%
10%
12%
0 6 12 18 24 30 36 42 48 54 60
Source: NIESR
3
So real incomes are falling
Source: Office for National Statistics. Median hourly earnings excluding
overtime for all employees
10.00
10.50
11.00
11.50
12.00
12.50
2002 2003 2004 2005 2006 2007 2008 2009 2010 2011 2012
£ per hour
4
Fiscal conservatism (I)
Source: OECD
5
Fiscal Conservatism (II)
Source: Bank of England
6
Fiscal Conservatism (III)
Source: Institute for Fiscal Studies
7
Monetary activism
0
100
200
300
400
500
600
2007 2008 2009 2010 2011 2012 2013 Apr-13
UK
US
Japan
Euro Area
Source: Bank of England
8
What does £375bn buy you
these days?
9
1. A third of the gilts market
0
100,000
200,000
300,000
400,000
500,000
600,000
700,000
800,000
900,000
2011…
2011…
2011…
2011…
2012…
2012…
2012…
Households
Private Non-
Financial
companies
Bank of England
Other Financial
Institutions
Insurance
Companies and
Pension funds
Source: Debt Management Office
10
2. Every single automobile in Britain (cost: £185bn)
11
3. Scotland
12
4. Some pennies
13
5. A present
£14,423
for every single household
in the UK
14
Net results: 1. distributive impact
gains for UK households from QE by income decile
X axis measures change in household income (£) Source: Bank of
England/Sky News
15
2: UK housing market
-40
-20
0
20
40
60
80
Price-to-rent ratioOver-valuation
Under-valuation
16
3. Higher prices for other exclusive assets/services
17
4. Divided UK
18
No global rebalancing
Source: OECD
19
No euro rebalancing (I)
Unit labour costs
Source: OECD
90.00
95.00
100.00
105.00
110.00
115.00
120.00
125.00
130.00
135.00
140.00
2000-01-01
2000-05-01
2000-09-01
2001-01-01
2001-05-01
2001-09-01
2002-01-01
2002-05-01
2002-09-01
2003-01-01
2003-05-01
2003-09-01
2004-01-01
2004-05-01
2004-09-01
2005-01-01
2005-05-01
2005-09-01
2006-01-01
2006-05-01
2006-09-01
2007-01-01
2007-05-01
2007-09-01
2008-01-01
2008-05-01
2008-09-01
2009-01-01
2009-05-01
2009-09-01
2010-01-01
2010-05-01
2010-09-01
2011-01-01
Germany
Ireland
Spain
France
Greece
20
No euro rebalancing (II)
Beer prices
Source: Eurostat
90.0
100.0
110.0
120.0
130.0
140.0
150.0
160.0
2000-01-01
2000-06-01
2000-11-01
2001-04-01
2001-09-01
2002-02-01
2002-07-01
2002-12-01
2003-05-01
2003-10-01
2004-03-01
2004-08-01
2005-01-01
2005-06-01
2005-11-01
2006-04-01
2006-09-01
2007-02-01
2007-07-01
2007-12-01
2008-05-01
2008-10-01
2009-03-01
2009-08-01
2010-01-01
2010-06-01
2010-11-01
2011-04-01
2011-09-01
2012-02-01
2012-07-01
2012-12-01
Germany
Ireland
Spain
France
Greece
21
Current account balances
Bretton Woods compared (I)
World GDP
(annual average
%)
World inflation
Gold Standard
(1870-1913)
1.3 0.6
Interwar period
(1925-39)
1.2 0
Bretton Woods
(1948-72)
2.8 3.3
Current (1973-
2008)
1.8 4.8
Bretton Woods compared (II)
National
downturns (share
of period)
Banking crises
(per year)
Gold Standard
(1870-1913)
19 1.3
Interwar period
(1925-39)
27 2.1
Bretton Woods
(1948-72)
4 0.1
Current (1973-
2008)
13 2.6
Bretton Woods compared (III)
External defaults
(no per year)
Current account
imbalances
(surplus + deficit)
Gold Standard
(1870-1913)
0.9 2.4
Interwar period
(1925-39)
1.5 1.2
Bretton Woods
(1948-72)
0.7 0.8
Current (1973-
2008)
1.3 2.2
25
But the future is brighter
Potential growth rates
2012-17 2018-30 2031-50
United States 2.0 2.1 1.7
Japan 0.8 1.1 1.1
Germany 1.2 0.9 0.7
United
Kingdom
1.7 2.6 2.0
France 1.5 2.3 1.4
Italy 0.1 2.0 1.4
Canada 2.0 2.2 1.9
Source: OECD

Ed Conway Presentation to Tutor2u ETNC 2013

  • 1.
  • 2.
    2No normal recession fiveyears on… 1930-1934, 5.23% 1979-1983, 3.41% 1990-1993, 9.91% 2008-, -2.42% -8% -6% -4% -2% 0% 2% 4% 6% 8% 10% 12% 0 6 12 18 24 30 36 42 48 54 60 Source: NIESR
  • 3.
    3 So real incomesare falling Source: Office for National Statistics. Median hourly earnings excluding overtime for all employees 10.00 10.50 11.00 11.50 12.00 12.50 2002 2003 2004 2005 2006 2007 2008 2009 2010 2011 2012 £ per hour
  • 4.
  • 5.
  • 6.
    6 Fiscal Conservatism (III) Source:Institute for Fiscal Studies
  • 7.
    7 Monetary activism 0 100 200 300 400 500 600 2007 20082009 2010 2011 2012 2013 Apr-13 UK US Japan Euro Area Source: Bank of England
  • 8.
    8 What does £375bnbuy you these days?
  • 9.
    9 1. A thirdof the gilts market 0 100,000 200,000 300,000 400,000 500,000 600,000 700,000 800,000 900,000 2011… 2011… 2011… 2011… 2012… 2012… 2012… Households Private Non- Financial companies Bank of England Other Financial Institutions Insurance Companies and Pension funds Source: Debt Management Office
  • 10.
    10 2. Every singleautomobile in Britain (cost: £185bn)
  • 11.
  • 12.
  • 13.
    13 5. A present £14,423 forevery single household in the UK
  • 14.
    14 Net results: 1.distributive impact gains for UK households from QE by income decile X axis measures change in household income (£) Source: Bank of England/Sky News
  • 15.
    15 2: UK housingmarket -40 -20 0 20 40 60 80 Price-to-rent ratioOver-valuation Under-valuation
  • 16.
    16 3. Higher pricesfor other exclusive assets/services
  • 17.
  • 18.
  • 19.
    19 No euro rebalancing(I) Unit labour costs Source: OECD 90.00 95.00 100.00 105.00 110.00 115.00 120.00 125.00 130.00 135.00 140.00 2000-01-01 2000-05-01 2000-09-01 2001-01-01 2001-05-01 2001-09-01 2002-01-01 2002-05-01 2002-09-01 2003-01-01 2003-05-01 2003-09-01 2004-01-01 2004-05-01 2004-09-01 2005-01-01 2005-05-01 2005-09-01 2006-01-01 2006-05-01 2006-09-01 2007-01-01 2007-05-01 2007-09-01 2008-01-01 2008-05-01 2008-09-01 2009-01-01 2009-05-01 2009-09-01 2010-01-01 2010-05-01 2010-09-01 2011-01-01 Germany Ireland Spain France Greece
  • 20.
    20 No euro rebalancing(II) Beer prices Source: Eurostat 90.0 100.0 110.0 120.0 130.0 140.0 150.0 160.0 2000-01-01 2000-06-01 2000-11-01 2001-04-01 2001-09-01 2002-02-01 2002-07-01 2002-12-01 2003-05-01 2003-10-01 2004-03-01 2004-08-01 2005-01-01 2005-06-01 2005-11-01 2006-04-01 2006-09-01 2007-02-01 2007-07-01 2007-12-01 2008-05-01 2008-10-01 2009-03-01 2009-08-01 2010-01-01 2010-06-01 2010-11-01 2011-04-01 2011-09-01 2012-02-01 2012-07-01 2012-12-01 Germany Ireland Spain France Greece
  • 21.
  • 22.
    Bretton Woods compared(I) World GDP (annual average %) World inflation Gold Standard (1870-1913) 1.3 0.6 Interwar period (1925-39) 1.2 0 Bretton Woods (1948-72) 2.8 3.3 Current (1973- 2008) 1.8 4.8
  • 23.
    Bretton Woods compared(II) National downturns (share of period) Banking crises (per year) Gold Standard (1870-1913) 19 1.3 Interwar period (1925-39) 27 2.1 Bretton Woods (1948-72) 4 0.1 Current (1973- 2008) 13 2.6
  • 24.
    Bretton Woods compared(III) External defaults (no per year) Current account imbalances (surplus + deficit) Gold Standard (1870-1913) 0.9 2.4 Interwar period (1925-39) 1.5 1.2 Bretton Woods (1948-72) 0.7 0.8 Current (1973- 2008) 1.3 2.2
  • 25.
    25 But the futureis brighter Potential growth rates 2012-17 2018-30 2031-50 United States 2.0 2.1 1.7 Japan 0.8 1.1 1.1 Germany 1.2 0.9 0.7 United Kingdom 1.7 2.6 2.0 France 1.5 2.3 1.4 Italy 0.1 2.0 1.4 Canada 2.0 2.2 1.9 Source: OECD

Editor's Notes

  • #3 FIVE YEARS ON. Deeper and longer lasting than any other recession in UK history. Depression. Recovered at 48 weeks – four years. 1990s – recovered after 32 months – about 2.5 years.
  • #5 Amount of consolidation to get net debt down to 60% of GDP by 2030
  • #6 Just over a third of the Government’s planned consolidationhas taken place so far.plans, most of the tax increases have taken place, whereasmost of the spending cuts are yet to come.
  • #7 Spending cuts are getting more difficult
  • #9 QE: The Biggest Experiment in modern economic history
  • #11 Cost: £185bn – less than half its total QE outlay. Of course, that would create a slight problem, in that, well, no-one would be able to get anywhere, so the Bank could use the remaining £190bn to buy every single household in Britain a brand spanking new Volkswagen Fox. Which, of course, would also bolster UK-German relations, so good news all round.
  • #12 According to Savills, the entire housing stock in Scotland is currently worth just over £300bn – so easily affordable. And, while we’re at it, it could use that remaining £75bn to buy up every property in Northern Ireland.If, for understandable reasons, Sir Mervyn was rather nervous about the constitutional implications of the Bank of England owning Scotland, he could, instead, buy up every property in the North West (£372bn), the North East (£124bn) or the West Midlands (£309bn), including Wolverhampton, where he grew up. London would be a bit too expensive, at £783bn, but the Bank could easily afford a few of the smartest boroughs: Kensington & Chelsea and the City of Westminster, perhaps (£128bn all-in).
  • #13 The Bank could, if it so chose, decide to get the money minted up into £375bn of pennies. I’m not entirely clear why they’d want to do this, but nonetheless it would be so many coins that, if piled on top of each other, they would tower 57m kilometres high, enough to reach to Mars, on one of its closer orbits to the earth.