Lethal Violence in Asia and Pacific Region
•
0 likes•389 views

While the Asia-Pacific region is home to over half the world's population, it accounts for less than a quarter of global lethal violence. Nine out of ten countries in the region have low violence rates, except for Southern Asia which exceeds the global average. Approximately one-third of all conflict deaths worldwide occur in the Asia-Pacific, driven largely by Afghanistan, India, Pakistan and Myanmar. Firearm violence and deaths from unplanned munitions explosions are also relatively high in parts of the region.

Recommended
Recommended
More Related Content
More from Geneva Declaration
More from Geneva Declaration (20)
Recently uploaded
Recently uploaded (20)
Lethal Violence in Asia and Pacific Region
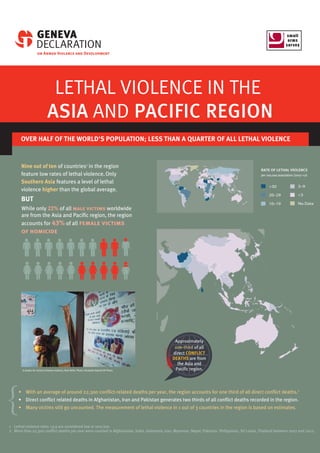
- 1. LETHAL VIOLENCE IN THE ASIA AND PACIFIC REGION OVER HALF OF THE WORLD'S POPULATION; LESS THAN A QUARTER OF ALL LETHAL VIOLENCE >30 20–29 10–19 3–9 <3 No Data RATE OF LETHAL VIOLENCE per 100,000 population (2007–12) While only 22% of all male victims worldwide are from the Asia and Pacific region, the region accounts for 43% of all female victims of homicide • With an average of around 22,300 conflict-related deaths per year, the region accounts for one third of all direct conflict deaths.2 • Direct conflict related deaths in Afghanistan, Iran and Pakistan generates two thirds of all conflict deaths recorded in the region. • Many victims still go uncounted. The measurement of lethal violence in 1 out of 3 countries in the region is based on estimates. 1 Lethal violence rates ≤9.9 are considered low or very low. 2 More than 22,300 conflict deaths per year were counted in Afghanistan, India, Indonesia, Iran, Myanmar, Nepal, Pakistan, Philippines, Sri Lanka, Thailand between 2007 and 2012. A shelter for victims of dowry violence, New Delhi. Photo: Elizabeth Dalziel/AP Photo Approximately one-third of all direct CONFLICT DEATHS are from the Asia and Pacific region. Nine out of ten of countries1 in the region feature low rates of lethal violence.Only Southern Asia features a level of lethal violence higher than the global average. BUT
- 2. FIREARM-RELATED VIOLENCE IS LOWER IN THIS REGION THAN THAN GLOBAL AVERAGE Sources: Geneva Declaration Secretariat. Forthcoming. Global Burden of Armed Violence 2014; Cambridge: Cambridge University Press; Small Arms Survey. n.d. Unplanned Explosions at Munitions Sites (UEMS) Database. ONE IN THREE UNPLANNED EXPLOSIONS AT MUNITIONS SITES OCCUR IN THE REGION 3 The analysis excludes countries with less than 5 violent deaths in either 2004 or 2012. This applies to Bhutan, Brunei Darussalam, Maldives, Samoa, Tonga, Vanuatu. 4 The Micronesia region comprises Guam, Kiribati, Marshall Islands, Federal States of Micronesia, Nauru and Palau. Lethal violence rates in 2004 and 2012 by sub-region3 Between 2004 and 2012, EASTERN ASIA, MELANESIA, AUSTRALIA, NEW ZEALAND, and SOUTH-EASTERN ASIA have experienced reductions in their rates of lethal violence. MICRONESIA and SOUTHERN ASIA saw increases in their rates of lethal violence. In Southern and South- eastern Asia more than one-third of homicides are committed with a firearm; compared to fewer than one tenth in Australia and New Zealand and Eastern Asia. Almost one out of three of all recorded unplanned explosions of munitions sites (UEMS) occurred in the Asia and Pacific region, resulting in more than one-third of the total number of casualties. On average, each incident in this region resulted in 40 casualties: a higher toll than the global average. High rates of incidence and casualty may reflect poor stockpile management practices. % firearm homicide 0.0 5.0 10.0 15.0 Southern Asia Micronesia4 Melanesia South Eastern Asia Eastern Asia Australia and New Zealand Rate per 100,00 population 2004 2012 Asia and Pacific Rest of the world Unplanned Explosions Fatalities < A police sign in Maluso, a fishing village in Basilan, Philippines, warns of a ban on firearms enforced prior to the 2007 elections. Photo: Lucian Read/Small Arms Survey Australia and New Zealand feature the lowest levels of lethal violence in the region. Their violent death rate is more than ten times lower than that of Southern Asia. WHAT HAS CHANGED? 0 10 20 30 40 50 World SouthEasternAsia SouthernAsia AustraliaandNewZealand Melanesia Micronesia EasternAsia Polynesia % 27% 33%