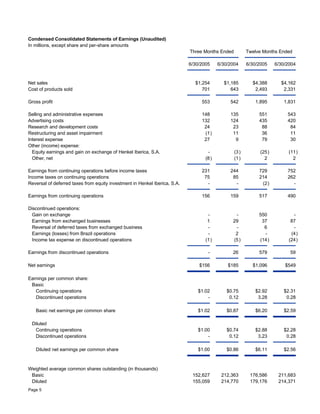
1. Condensed Consolidated Statements of Earnings (Unaudited)
In millions, except share and per-share amounts
Three Months Ended Twelve Months Ended
6/30/2005 6/30/2004 6/30/2005 6/30/2004
Net sales $1,254 $1,185 $4,388 $4,162
Cost of products sold 701 643 2,493 2,331
Gross profit 553 542 1,895 1,831
Selling and administrative expenses 148 135 551 543
Advertising costs 132 124 435 420
Research and development costs 24 23 88 84
Restructuring and asset impairment (1) 11 36 11
Interest expense 27 9 79 30
Other (income) expense:
Equity earnings and gain on exchange of Henkel Iberica, S.A. - (3 ) (25) (11)
Other, net (8 ) (1 ) 2 2
Earnings from continuing operations before income taxes 231 244 729 752
Income taxes on continuing operations 75 85 214 262
Reversal of deferred taxes from equity investment in Henkel Iberica, S.A. - - (2) -
Earnings from continuing operations 156 159 517 490
Discontinued operations:
Gain on exchange - - 550 -
Earnings from exchanged businesses 1 29 37 87
Reversal of deferred taxes from exchanged business - - 6 -
Earnings (losses) from Brazil operations - 2 - (4)
Income tax expense on discontinued operations (1) (5 ) (14) (24)
Earnings from discontinued operations - 26 579 59
Net earnings $156 $185 $1,096 $549
Earnings per common share:
Basic
Continuing operations $1.02 $0.75 $2.92 $2.31
Discontinued operations - 0.12 3.28 0.28
Basic net earnings per common share $1.02 $0.87 $6.20 $2.59
Diluted
Continuing operations $1.00 $0.74 $2.88 $2.28
Discontinued operations - 0.12 3.23 0.28
Diluted net earnings per common share $1.00 $0.86 $6.11 $2.56
Weighted average common shares outstanding (in thousands)
Basic 152,627 212,363 176,586 211,683
Diluted 155,059 214,770 179,176 214,371
Page 5
2. Segment Information (Unaudited)
In millions
Fourth Quarter Earnings from Continuing Operations
Net Sales Before Income Taxes.
Three Months Ended % Three Months Ended %
Change (1) Change (1)
6/30/2005 6/30/2004 6/30/2005 6/30/2004
Household Group - North America $537 $529 2% $148 $170 -13%
Specialty Group 569 534 7% 174 154 13%
International 148 122 21% 28 22 27%
Corporate - - - (119) (102) -17%
Total Company $1,254 $1,185 6% $231 $244 -5%
Year To Date Earnings from Continuing Operations
Net Sales Before Income Taxes.
Twelve Months Ended % Twelve Months Ended %
Change (1) Change (1)
6/30/2005 6/30/2004 6/30/2005 6/30/2004
Household Group - North America $2,038 $1,986 3% $633 $634 0%
Specialty Group 1,788 1,677 7% 435 417 4%
International 562 499 13% 119 115 3%
Corporate - - - (458) (414) -11%
Total Company $4,388 $4,162 5% $729 $752 -3%
(1)
Percentages based on rounded numbers.
Page 6
3. Condensed Consolidated Balance Sheets (Unaudited)
In millions
6/30/2005 6/30/2004
Assets
Current assets
Cash and cash equivalents $ 293 $ 232
Receivables, net 411 460
Inventories 323 301
Other current assets 63 50
Total current assets 1,090 1,043
Property, plant and equipment, net 999 1,052
Goodwill, net 743 742
Trademarks and other intangible assets, net 599 633
Other assets, net 186 364
Total assets $3,617 $3,834
Liabilities and Stockholders' (Deficit) Equity
Current liabilities
Notes and loans payable $ 359 $ 289
Current maturities of long-term debt 2 2
Accounts payable 347 310
Accrued liabilities 572 643
Income taxes payable 26 24
Total current liabilities 1,306 1,268
Long-term debt 2,122 475
Other liabilities 618 377
Deferred income taxes 84 174
Stockholders' (deficit) equity
Common stock 250 250
Additional paid-in capital 328 301
Retained earnings 3,726 2,846
Treasury shares (4,463 ) (1,570 )
Accumulated other comprehensive net losses (338 ) (274 )
Unearned compensation (16 ) (13 )
Stockholders' (deficit) equity (513 ) 1,540
Total liabilities and stockholders' (deficit) equity $3,617 $3,834
Page 7