1. Ecology
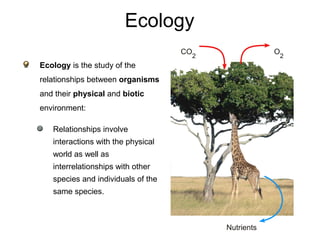
Ecology is the study of the
relationships between organisms
and their physical and biotic
environment:
Relationships involve
interactions with the physical
world as well as
interrelationships with other
species and individuals of the
same species.
O
2
Nutrients
CO
2
2. Living organisms can be
studied at different levels
of complexity.
From least to most
complex, these levels are
(in an ecological context):
Individual
Population
Community
Ecosystem
Biome
Biological Complexity
Biosphere
Biome
Ecosystem
Community
Population
Individual
3. The biosphere is the
region within which all
living things are found
on Earth.
It is the narrow belt
around the Earth
extending from the
bottom of the oceans to
the upper atmosphere.
The Biosphere
4. Ecosystems Light intensity varies
Flow rate varies Rainfall level varies
An ecosystem includes:
all of the organisms
(the community) …
and their physical
environment.
There are many different
sorts of ecosystems from
natural to artificial, and
they range in size from
large to small.
Still water habitatFast flowing water habitat
Rock habitat Stream bank habitat
5. A community is a naturally occurring group of organisms living together
as an ecological entity; the biological part of the ecosystem.
Communities
A nudibranch snail
feeding on rock
encrusting organisms
6. Abiotic (physical) factors are the
influences of the non-living parts of the
ecosystem.
Examples include pH, salinity,
temperature, turbidity, wind speed
and direction, humidity, precipitation,
water pressure, and light intensity
and quality.
Biotic factors are the influences of the
living parts of the ecosystem. Producers
and consumers interact as competitors,
parasites, pathogens, symbionts, and
predators.
Factors Affecting Ecosystems
8. The physical environment
refers to the physical
surroundings of any
organism, including:
the medium, e.g. water
substrate, e.g. soil
climatic (atmospheric)
conditions
light …
and other physical
properties.
Environments
9. The type and extent of
vegetation in a particular
ecosystem is determined
by physical factors on
both a large scale and on
a very localized
(microclimate) level.
Vegetation patterns
are governed largely
by climate (which is
broadly related to
latitude) and altitude.
Climate and Vegetation
Temperate climate
High latitude climate
10. Tropical evergreen forests are
found in equatorial regions
where total annual rainfall
exceeds 250 cm and the dry
season lasts for no more than
2-3 months. These forests are
species-rich.
The climate is warm and rainy
all year round.
Tropical Rainforests
11. Rainforest Communities
Dominant plants
Trees and vines
Floral richness
Extremely high; the richest
of all biomes.
Faunal richness
Extremely rich in mammals, birds,
amphibians, and arthropods.
13. The high species diversity
of tropical rainforests can
be supported because of
the wide variety of
microhabitats provided by
the layered structure of
the forest.
The physical conditions at
the uppermost level are
quite different to those at
the forest floor with
respect to light intensity
(and quality), wind speed,
and humidity.
A Tropical Rainforest
Canopy
Subcanopy
Understorey
Ground layer
15. The ecological niche
describes the functional
position of an organism in its
environment.
A niche comprises:
the habitat in which the
organism lives.
the organism’s activity
pattern: the periods of
time during which it is
active.
the resources it obtains
from the habitat.
Ecological Niche
Adaptations
Physical
conditions
Activity
patterns
Presence of other
organisms
Habitat
16. The physical conditions influence the habitat in which an
organism lives. These include:
substrate
humidity
sunlight
temperature
salinity
pH (acidity)
exposure
altitude
depth
Physical Conditions
17. The law of tolerance states that “For each abiotic factor, an
organism has a range of tolerances within which it can survive.”
Law of Tolerance
Examples of
abiotic factors
that influence
size of the
realized niche:
Tolerance range
Optimum range
Unavailabl
e niche
Marginal
niche
Numberoforganisms
Preferre
d niche
Marginal
niche
Unavailable
niche
18. An organism’s habitat is the physical place or environment in
which it lives.
Organisms show a preference for a particular habitat type, but
some are more specific in their requirements than others.
Habitat
Lichens are found on rocks,
trees, and bare ground.
Most frogs, like this leopard frog, live in or near
fresh water, but a few can survive in arid habitats.
19. An organism’s habitat is not always of a single type. Some organisms
occupy a range of habitats. There are various reasons why:
Highly adaptable in habitat requirements.
Different, but equivalent, resources available in different habitats.
Reduced competition for resources in sub-optimal habitats.
Habitat extremes may influence growth form, especially in plants.
Habitat Range
20. Dingoes are a highly
adaptable species found
throughout Australia in
ecosystems as diverse as the
tropical rainforests of the
north and the arid deserts in
the central Australia.
Within each of these
ecosystems, they may
occupy a range habitats,
each one offering slightly
different resources.
Dingo Habitats
21. A microhabitat describes the
precise location within a habitat
where a species is normally
found. It is a small, often highly
specialized, and effectively
isolated location.
The term microhabitat
generally applies to
invertebrates which do not
forage widely.
Example: Within a woodland
habitat, woodlice may be
found in the microhabitat
provided beneath the bark of
the rotting wood.
Microhabitats
Woodlouse
22. An adaptation (or adaptive
feature) is an inherited feature
of an organism that enables it
to survive and reproduce in its
habitat.
Adaptations are the end result
of the evolutionary changes
that a species has gone
through over time.
Adaptations may be:
behavioral
physiological
structural
Adaptations
Osprey: a diurnal bird of prey
Spotted owl: a nocturnal bird of prey
23. Organisms have adaptations for:
Biorhythms and activity
patterns, e.g. nocturnal
behavior
Locomotion (or movement)
Defense of resources
Predator avoidance
Reproduction
Feeding
These categories are not mutually
exclusive.
Purposes of Adaptations
24. Structural adaptations: physical
features of an organism, e.g.
presence of wings for flight.
Behavioral adaptations:
the way an organism acts, e.g.
mantid behavior when seeking,
capturing, and manipulating prey.
Functional (physiological)
adaptations:
those involving physiological
processes, e.g. the female mantid
produces a frothy liquid to
surround and protect the groups
of eggs she lays.
Types of Adaptations
Praying mantis
25. The adaptations found in plants
reflect both the plant’s environment
and the type and extent of
predation to which the plant is
subjected.
Many plant adaptations are
concerned with maintaining
water balance. Terrestrial
plant species show a variety of
structural and physiological
adaptations for water
conservation.
Plants evolve defenses, such
as camouflage, spines, thorns,
or poisons, against efficient
herbivores.
Plant Adaptations
26. Mangrove Adaptations
Water level at high tide
Prop roots descend from the trunk
to provide additional support.
Salt may accumulate
in older leaves
before they fall.
Specialized root membranes in some
mangroves prevent salt from entering
their roots (salt excluders).
Salt glands in the surface
layers of leaves secrete salt
(salt excretors).
Cable roots radiate from the trunk.
Fine feeding-roots grow off these radial
roots and create a stable platform.
Oxygen diffuses through
the spongy tissue of the
pneumatophore to the
rest of the plant.
Pneumatophores
(breathing roots) arise
from the cable roots.
27. Tropical forest plants live in
areas of often high rainfall.
Therefore, they have to cope
with high transpiration rates.
Tropical Forest Plants
Shallow fibrous
root system
Funnel shaped
leaves channel rain
Water table high
Water loss by
transpiration
28. Ocean margin plants, e.g. intertidal
seaweeds and mangroves, must cope
with high salt content in the water.
Ocean Margin Plants
Mangrove pneumatophores
Some mangrove species
take in brackish water and
excrete the salt through
glands in the leaves.
Seaweeds growing in
the intertidal zone
tolerate exposure to the
drying air every 12 h.
29. Structural Adaptations in Rabbits
Structural adaptations
Widely spaced eyes gives a wide
field of vision for surveillance of the
habitat and detection of danger.
Long, mobile ears enable acute
detection of sounds from many
angles for predator detection.
Long, strong hind legs and
large feet enable rapid movement
and are well suited to digging.
Cryptic coloration provides
effective camouflage in
grassland habitat.
Rabbits are colonial mammals
that live underground in warrens
and feed on a wide range of
vegetation.
Many of their more obvious
structural adaptations are
associated with detecting
and avoiding predators.
30. Functional Adaptations in Rabbits
Functional (physiological) adaptations are associated with physiology.
The functional adaptations of
rabbits are associated with
detecting and avoiding predation,
and maintaining populations
despite high losses.
Functional adaptations
High reproductive rate enables rapid
population increases when food is
available.
Keen sense of smell allows
detection of potential threats from
predators and from rabbits from
other warrens.
Microbial digestion of vegetation in
the hindgut enables more efficient
digestion of cellulose.
High metabolic rate and fast
response times enables rapid
response to dangers.
Hawks are major predators of rabbits
31. Behavioral Adaptations in Rabbits
The behavioral adaptations of
rabbits reflect their functional position
as herbivores and important prey
items in many food webs.
Behavioral adaptations
Freeze behavior when startled
reduces the possibility of detection by
wandering predators.
Thumps the ground with hind legs to
warn others in the warren of
impending danger.
Lives in groups with a well organized
social structure that facilitates
cooperative defense.
Burrowing activity provides extensive
underground habitat as refuge from
predators.
Freezing is a typical behavior when threatened
32. Competition describes the
active demand between two or
more organisms for a
resource.
Competition may be:
Intraspecific: between
individuals of the same
species.
Interspecific: between
individuals of different
species.
Each competitor is inhibited in
some way by the interaction.
Competition
Interspecific competition on a reef
Intraspecific competition: hyaenas
33. Competition affects the size of a
competitor’s realized niche.
The effect is dependent on the intensity
and type of the competition.
Niches are narrower with moderate
interspecific competition (Fig. 1).
Intense interspecific competition
results in a very narrow realized niche
as species specialize to exploit a
narrower range of resources (Fig. 2).
Intense intraspecific competition
results in a broader realized niche as
individuals are forced to occupy
suboptimal conditions (Fig. 3).
Competition and Niche Size
Fig. 1
Fig. 2
Fig. 3
Narrower niche
Broader niche
Possible tolerance range
Realized niche of species
34. Gause’s competitive exclusion principle states:
“two or more resource-limited species, having identical patterns of resource
use, cannot coexist in a stable environment:
one species will be better adapted and will out-compete or otherwise
eliminate the other(s)”.
If two species compete for some of the same resources (e.g. food items
of a particular size), their resource use curves will overlap. In the zone
of overlap, interspecific competition is the most intense.
Gause’s Principle
Zone of overlap
Species
B
Resource use as measured by food item size
Amounteaten
Species
A
35. Interspecific competition is usually less intense than intraspecific
competition because niche overlap between species is not complete.
Species with similar ecological requirements may reduce competition by
exploiting different microhabitats within the ecosystem.
Example: Ecologically similar damsel fish at Heron Island,
Queensland, Australia exploit different resources or regions over the
coral reef.
Niche Differentiation
Sea levelReef crest
Pw Pomacentrus wardi
Pf Pomacentrus flavicauda
Pb Pomacentrus bankanensis
Sa Stegastes apicalis
Pl Plectroglyphidodon lacrymatus
Ef Eupomacentrus fasciolatus
Eg Eupomacentrus gascoynei
Gb Glyphidodontops biocellatus
36. In the eucalypt
forests of
eastern Australia
different bird
species forage at
different heights
in the forest.
This selective
foraging behavior
reduces niche
overlap between
species that
might otherwise
compete directly.
Competition in Eucalypts
Key to bird species
Yellow-
throated
scrubwren
Brown thornbill
Spine-tailed swift
Striated thornbill
Leaden flycatcher
Ground thrush
Rufous fantail
White-throated
treecreeper
Ys
Bt
Sw
Lf
St
Gt
Rf
Wt
37. Organisms do not generally live
alone. A population is a group of
organisms from the same species
occupying in the same
geographical area.
This area may be difficult to
define because:
A population may comprise
widely dispersed individuals
which come together only
infrequently, e.g. for mating.
Populations may fluctuate
considerably over time.
Populations
Migrating wildebeest populationMigrating wildebeest population
Tiger populations compriseTiger populations comprise
widely separated individualswidely separated individuals
38. Populations are dynamic and
exhibit attributes that are not
shown by the individuals
themselves.
These attributes can be
measured or calculated and
include:
Population size: the total
number of organisms in the
population.
Population density: the
number of organisms per
unit area.
Features of Populations 1
39. Features of Populations 2
Population composition provides
information relevant to the
dynamics of the population, i.e.
whether the population is
increasing or declining.
Information on population
composition (or structure)
includes:
Sex ratios: the number of
organisms of each sex.
Fecundity (fertility): the
reproductive capacity of the
females.
40. The study of changes in the size
and composition of populations,
and the factors influencing these
changes, is population
dynamics.
Key factors for study include:
Population growth rate: the
change in the total
population size per unit time.
Natality (birth rate): the
number
of individuals born per unit
time.
Population Dynamics
Population size is influenced by births…Population size is influenced by births…
……and deathsand deaths
41. Migration
Migration is the movement of
organisms into (immigration)
and out of (emigration) a
population. It affects population
attributes such as age and sex
structure, as well as the
dynamics of a population.
Populations lose individuals
through deaths and
emigration.
Populations gain individuals
through births and
immigration.
Migrating species may group together to
form large mobile populations
WildebeestWildebeest
Canada geeseCanada geese
42. The number of individuals per unit
area (for terrestrial organisms) or
volume (for aquatic organisms) is
termed the population density.
At low population densities,
individuals are spaced well
apart. Examples: territorial,
solitary mammalian species
such as tigers and plant
species in marginal
environments.
At high population densities,
individuals are crowded
together. Examples: colonial
animals, such as rabbits,
corals, and termites.
Population Density
High density populations
Low density populations
43. A crude measure of population density tells
us nothing about the spatial distribution of
individuals in the habitat.
The population distribution describes the
location of individuals within an area.
Distribution patterns are determined by
the habitat patchiness (distribution of
resources) and features of the organisms
themselves, such as territoriality in
animals or autotoxicity in plants.
Individuals in a population may be
distributed randomly, uniformly, or in
clumps.
Population Distribution
More uniform distribution in cacti
Clumped distribution in termites
44. A population’s distribution is considered
random if the position of each individual is
independent of the others.
Random distributions are not common; they
can occur only where:
The environment is uniform and
resources are equally available
throughout the year.
There are no interactions between
individuals or interactions produce no
patterns of avoidance or attraction.
Random distributions are seen in some
invertebrate populations, e.g. spiders and
clams, and some trees.
Random Distribution
Spider populations appear to show
a random distribution
45. Uniform or regular distribution
patterns occur where individuals are
more evenly spaced than would
occur by chance.
Regular patterns of distribution
result from intraspecific competition
amongst members of a population:
Territoriality in a relatively
homogeneous environment.
Competition for root and crown
space in forest trees or moisture
in desert and savanna plants.
Autotoxicity: chemical inhibition
of plant seedlings of the same
species.
Uniform Distribution
Saguaro cacti compete for moisture
and show a uniform distribution
46. Clumped distributions are the most
common in nature; individuals are
clustered together in groups.
Population clusters may occur around a
a resource such as food or shelter.
Clumped distributions result from the
responses of plants and animals to:
Habitat differences
Daily and seasonal changes in
weather and environment
Reproductive patterns
Social behavior
Clumped Distribution
Sociality leads to clumped distribution
47. Calculating Population Change
Births, deaths, and net migrations
determine the numbers of individuals in a
population
Emigration (E)
Births (B)
Immigration (I)
Deaths (D)
48. Rates of Population Change
Ecologists usually measure the
rate of population change.
These rates are influenced by
environmental factors and by
the characteristics of the
organisms themselves.
Rates are expressed as:
Numbers per unit time,
e.g. 2000 live births per
year
Per capita rate (number
per head of population),
e.g. 122 live births per
1000 individuals (12.2%)
Many invertebrate populations
increase rapidly in the right conditions
Large mammalian carnivores have
a lower innate capacity for increase
49. Populations becoming established in a
new area for the first time are often
termed colonizing populations.
They may undergo a rapid
exponential (logarithmic) increase
in numbers to produce a J-shaped
growth curve.
In natural populations, population
growth rarely continues to increase at
an exponential rate.
Factors in the environment, such as
available food or space, act to slow
population growth.
Exponential Growth
Colonizing Population
Here the number being
added to the
population per unit
time is large.
Exponential (J) curve
Exponential growth is
sustained only when
there are no constraints
from the environment.
Here, the number being
added to the population
per unit time is small.
Lag
phas
e
Populationnumbers(N)
Time
50. Logistic Growth
As a population grows, its increase will slow, and it will stabilize at a level
that can supported by the environment.
This type of sigmoidal growth produces the logistic growth curve.
Environmental resistance
increases as the population
overshoots K.
Environmental resistance
decreases as the population
falls below K.
Established Population
Carrying capacity (K)
The population density that can be
supported by the environment.
The population tends to fluctuate around an 'equilibrium
level'. The fluctuations are caused by variations in the
birth rate and death rate as a result of the population
density exceeding of falling below carrying capacity.
In the early phase,
growth is exponential
(or nearly so)
Lag
phase
Logistic (S) curve
As the population grows, the
rate of population increase
slows, reaching an
equilibrium level around the
carrying capacity.
Populationnumbers(N)
The population encounters resistance
to exponential growth as it begins to fill
up the environment. This is called
environmental resistance.
Time
51. Two parameters govern the logistic growth of populations.
The intrinsic rate of natural increase or biotic potential. This is the
maximum reproductive potential of an organism, symbolized by the
letter r.
The saturation density or
carrying capacity of the
environment, represented
by the letter, K.
We can characterize
species by the relative
importance of r and K
in their life cycles.
‘r’ and ‘K’ Selection
r-selected species
These species rarely reach
carrying capacity (K). Their
populations are in nearly
exponential growth phases for
much of the year. Early growth,
rapid development, and fast
population growth are important.
K-selected species
These species exist near
asymptotic density (K) for
most of the time. Competition
and effective use of resources
are important.
Time
Populationnumbers(N)
52. r-Selected Species
Species with a high intrinsic
capacity for population increase
are called r-selected or
opportunistic species.
These species show certain
life history features and, to
survive, must continually
invade new areas to
compensate for being
displaced by more competitive
species.
Climate
Variable and/or
unpredictable
Mortality Density-independent
Survivorship
Often type III
(early loss)
Population
size
Fluctuates wildly.
Often below K.
Competition
Variable, often lax.
Generalist niche.
Selection
favors
Rapid development,
high rm, early
reproduction, small
body size, single
reproduction (annual)
Length of life
Short, usually less
than one year
Leads to: Productivity
53. K-Selected Species
Species that are K-selected
exist under strong competition
and are pushed to use available
resources more efficiently.
These species have fewer
offspring and longer lives.
They put their energy into
nurturing their young to
reproductive age.
K-selected species include
most large mammals, birds
of prey, and large, long-lived
plants.
Climate
Fairly constant and/or
predictable
Mortality Density-dependent
Survivorship
Usually types I and II
(late or constant loss)
Population size
Fairly constant in time.
Near equilibrium with
the environment.
Competition
Usually keen.
Specialist niche.
Selection favors
Slower development,
larger body size,
greater competitive
ability, delayed
reproduction, repeated
reproductions
Length of life Longer (> one year)
Leads to: Efficiency
54. No organism exists in isolation. Each participates in interactions with other
organisms and with the abiotic components of the environment.
Species interactions may involve only occasional or indirect contact (predation or
competition) or they may involve a close association between species.
Symbiosis is a term that encompasses a variety of such close associations,
including parasitism (a form of exploitation), mutualism, and commensalism.
Species Interactions
Oxpecker birds on buffaloCanopy tree with symbionts attached
56. Parasitism
Many animal taxa have representatives
that have adopted a parasitic lifestyle.
Parasites occur more commonly in
some taxa than in others. Insects,
some annelids, and flatworms have
many parasitic representatives.
Parasites live in or on a host organism.
The host is always harmed by the
presence of the parasite, but it is not
usually killed. Both parasite and host
show adaptations to the relationship.
Parasites may live externally on a host
as ectoparasites, or within the host’s
body as endoparasites.
Tick ectoparasite on bird wing
Many birds and mammals use dust bathing
to rid themselves of external parasites
57. Mutualistic relationships occur
between some birds (such as
oxpeckers) and large herbivores
(such as zebra, Cape buffalo, and
rhinoceros). The herbivore is
cleaned of parasites and the
oxpecker gains access to food.
Lichens are an obligate
mutualism between a fungus and
either a green alga or a
cynobacterium. The fungus
obtains organic carbon from the
alga. The alga obtains water and
nutrient salts from the fungus.
Mutualistic Relationships
Lichen: an obligate mutualism
Cape buffalo and oxpecker birds
58. In commensal relationships, one
party (the commensal) benefits,
while the host is unaffected.
Epiphytes (perching plants) gain
access to a better position in the
forest canopy, with more light for
photosynthesis, but do no harm to
the host tree.
Commensal anemone shrimps
(Periclimenes spp.) live within the
tentacles of host sea anemones.
The shrimp gains protection from
predators, but the anemone is
neither harmed nor benefitted.
Commensal Relationships
59. Competition is one of the most familiar of
species relationships. It occurs both within
(intraspecific) and between (interspecific)
species.
Individuals compete for resources such as
food, space, and mates. In all cases of
competition, both parties (the competitors)
are harmed to varying extents by the
interaction.
Neighboring plants compete for light, water,
and nutrients. Interactions involving
competition between animals for food are
dominated by the largest, most aggressive
species (or individuals).
Competition
60. Intraspecific Competition
Environmental resources are finite. Competition within species for
resources increases as the population grows. At carrying capacity (K), it
reduces the per capita growth rate to zero.
When the demand for a resource (e.g. water, food, nesting sites, light)
exceeds supply, that resource becomes a limiting factor.
Animals compete for resources such as water (left) or mates (right),
especially when these are in short supply or access to them is restricted.
61. Most predators have more than one prey species, although one may be
preferred. As one prey species becomes scarce, predation on other species
increases (prey switching), so the proportion of each prey species in the
predator’s diet fluctuates.
Where one prey species is the principal food item, and there is limited
opportunity for prey switching, fluctuations in the prey population may closely
govern predator cycles.
Predator-Prey Interactions
62. The Role of Prey Switching
Vertebrate predators rarely
control their prey populations.
Prey species tend to show
regular population cycles in
response to other factors and
predators track these cycles.
Predators usually have a
preferred prey species, but will
switch to other prey when that
species is rare.
Generalist predators can
maintain stable populations by
prey switching in response to
changing prey densities.
Voles are the preferred prey of red foxes,
but they will take other prey as well
Brown bears are true generalists
and feed according to availability
63. Predator-Prey Cycles
Mammals frequently exhibit marked population cycles of high and low
density that have a certain, predictable periodicity.
Regular trapping records of the Canada lynx over a 90 year period
revealed a cycle of population fluctuations that repeated every 10 years
or so (below). These oscillations closely matched, with a lag, the cycles
of their principal prey item, the snowshoe hare.