
Recommended
More Related Content
Similar to Six Sigma Sample For LinkedIn
Similar to Six Sigma Sample For LinkedIn (20)
Recently uploaded
Recently uploaded (20)
Six Sigma Sample For LinkedIn
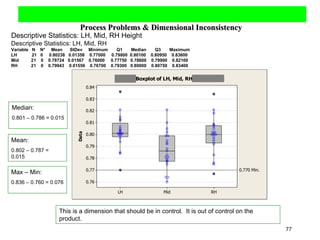
- 1. Descriptive Statistics: LH, Mid, RH Height Descriptive Statistics: LH, Mid, RH Variable N N* Mean StDev Minimum Q1 Median Q3 Maximum LH 21 0 0.80238 0.01358 0.77000 0.79800 0.80100 0.80950 0.83600 Mid 21 0 0.78724 0.01567 0.76000 0.77750 0.78600 0.79900 0.82100 RH 21 0 0.79943 0.01556 0.76700 0.79300 0.80000 0.80750 0.83400 This is a dimension that should be in control. It is out of control on the product. Median: 0.801 – 0.786 = 0.015 Mean: 0.802 – 0.787 = 0.015 Max – Min: 0.836 – 0.760 = 0.076 Process Problems & Dimensional Inconsistency 77
- 2. Scrap Averages The percentage of scrap is going down, some programs dramatically because of the direction provided. The “Project 3” program is the item that needs to be modified the most. The tooling was changed as well as the design of the product. Monitor 125 11.07% 53.53% 702 1307 Total Averages 23.21% (last six pours) 46.5% 199 428 Project 3 3.33% (last 3 pours) 46.5% 201 432 Project 2 6.67% (last 3 pours) 67.6% 302 447 Project 1 Last Pours % Scrap Total Avg. % Scrap Total Scraped Total Poured Program
- 3. History of Scrap Product 1. 88.5% Scrap to 23.2% Scrap the Last (6) Pours 2. 60.8% Scrap to 3.3% Scrap the Last (3) Pours 3. 65.3% Scrap to 6.7% Scrap the Last (3) Pours Tool Change Tool Change Improvement, But More Process and Tool Changes Required 126