Retail ETF and consumer confidence
•
1 like•259 views

S&P Retail ETF and Real Retail Sales are highly correlated. I expect the S&P Retail ETF (XRT) to hit a cycle low soon and trend upwards into the beginning of the Holiday Season. The XRT should then fall after Black Friday and the budget negotiations start to come to into focus. This presentation lays out the seasonality and cyclicality of Retail Sales, Consumer Confidence and the S&P Retail ETF.

Recommended
Recommended
More Related Content
What's hot
What's hot (19)
Viewers also liked
Similar to Retail ETF and consumer confidence
Similar to Retail ETF and consumer confidence (20)
Recently uploaded
Recently uploaded (20)
Retail ETF and consumer confidence
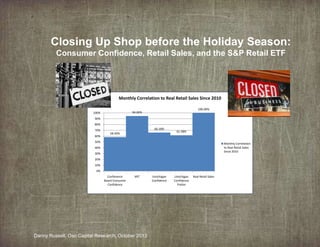
- 1. Closing Up Shop before the Holiday Season: Consumer Confidence, Retail Sales, and the S&P Retail ETF Monthly Correlation to Real Retail Sales Since 2010 100.00% 94.66% 100% 90% 80% 70% 60% 66.18% 58.40% 61.58% 50% Monthly Correlation to Real Retail Sales Since 2010 40% 30% 20% 10% 0% Conference Board Consumer Confidence XRT Danny Russell, Oso Capital Research, October 2013 Umichigan Confidence Umichigan Confidence Prelim Real Retail Sales
- 2. Retail Sales leads S&P Retail ETF Upwards Since the start of 2010, S&P Retail ETF (XRT) has followed Real Retail Sales closely The cumulative change in XRT and Real Retail Sales since January 2010 is 128% and 14.2% respectively S&P Retail ETF and Real Retail Sales 140 58 120 56 100 54 80 52 60 Real Retail Sales Index 50 40 20 XRT is levered to Real Retail Sales by an average of 6.27x every month XRT Index 48 0 46 Indexed at 12/31/2009 at 50 S&P Retail ETF and Retail Sales CAGR Since 2010 30.00% 25.00% 24.64% 20.00% 15.00% CAGR 10.00% 3.60% 5.00% 0.00% XRT Source: Federal Reserve, Yahoo Finance Real Retail Sales
- 3. Correlation to Real Retail Sales The correlation between XRT and Real Retail Sales is just under 95% Monthly Correlation to Real Retail Sales Since 2010 This correlation beats the Conference Board’s Consumer Confidence and University of Michigan’s Consumer Confidence 100.00% 94.66% 100% 90% 80% 70% 60% 66.18% 58.40% 61.58% 50% 40% 30% The correlation between Real Retail Sales and Consumer Confidence is relatively high at 70% 20% 10% 0% Conference Board Consumer Confidence XRT Umichigan Umichigan Confidence Prelim Sales Confidence Real Retail Conference Board Consumer Confidence XRT Umichigan Confidence Umichigan Confidence Prelim Real Retail Sales Conference Board Consumer Confidence 100.00% 69.05% 72.76% 73.10% 58.40% XRT 69.05% 100.00% 69.89% 64.04% 94.66% Umichigan Confidence Final 72.76% 69.89% 100.00% 97.19% 66.18% Umichigan Confidence Prelim 73.10% 64.04% 97.19% 100.00% 61.58% Real Retail Sales 58.40% 94.66% 66.18% 61.58% 100.00% Source: Federal Reserve, Yahoo Finance, Conference Board, University of Michigan/Reuters, Monthly Correlation to Real Retail Sales Since 2010
- 4. Consumer Confidence, Retail Sales, & XRT Seasonality 20.00% 15.00% Real Retail Sales bottom during the summer months and peak during the early fall and slide into the end of the year 1-Dec 1-Nov 1-Oct 1-Sep -10.00% 1-Aug -5.00% 1-Jul 2012 1-Jun 0.00% 1-May 2011 1-Apr 5.00% 1-Mar 2010 1-Feb 10.00% 1-Jan The rolling three month change in XRT, Real Retail Sales and the University of Michigan Consumer Confidence all exhibit similar seasonality XRT Rolling 3 MOM Change Seasonality 2013 -15.00% Real Retail Sales Index Rolling 3 MOM Change Seasonality 15.00% 10.00% 2010 1-Dec 1-Nov 1-Oct 1-Sep 1-Aug 1-Jul 1-Jun 1-May -5.00% 1-Apr 2012 1-Mar 0.00% 1-Feb The XRT shows similar seasonality to Real Retail Sales bottoming in the summer only to rise into the early fall and then slide down into the end of the year 2011 1-Jan 5.00% 2013 -10.00% Umichigan Confidence Final 2010 15.00% 10.00% 2010 -10.00% Source: Federal Reserve, Yahoo Finance, Conference Board, University of Michigan/Reuters, 1-Dec 1-Nov 1-Oct 1-Sep 1-Aug 1-Jul 1-Jun 1-May -5.00% 1-Apr 2012 1-Mar 0.00% 1-Feb 2011 1-Jan 5.00% 2013
- 5. Real Retail Sales & XRT Trade I expect the annualized volatility to mean revert just slightly and the XRT to trend up into the Black Friday and then start to fall This will correspond to the Real Retail Sales seasonality The recently passed “kick the can” bill to have a budget in early December of 2013 should act as a tailwind to this trade with the fear happening right along with the seasonality slide after Thanksgiving 80% Historical Volatility of XRT Volatility 70% Historical Volatility 60% 50% Average Vol Adjusted Close 50 Day SMA 90 80 70 60 50 40% 40 30% 20% 30 20 10% 10 0% 0 Source: Google Finance, InvestExcel
- 6. XRT Cycles and Buying Spot Courtesy of Stockcharts, the XRT makes a turn every 30 or so days The most recent turn was August 1 when the XRT retraced -4.95% in 7 trading days This retracement was due partially to the government shutdown and the broader market selloff I would buy the XRT when it makes another cycle low which should happen rather soon and will most likely correspond to the support which is around $81.20 I do not believe the economy is turning around or that consumers will spend a lot during the holidays, this is purely a sentiment play Source:StockCharts