SlideShare a Scribd company logo
1 of 1
OPTIONAL TOPIC—u-CHARTS
CD CHAPTER 17 Opt. T.: u-Charts 1
In the just completed discussion of scratches on tile surfaces, a c-chart was constructed. This was
the appropriate chart because the subgroup size, 6 tiles, was constant. And as long as the subgroup
size remains constant, the c-chart should be used. However, in some situations the subgroup size
cannot be held constant. For instance, at an assembly plant, Ford may manufacture several types of
Ranger pickup trucks as well as full-size trucks. In counting imperfections on the finish of each
truck, the subgroup size would depend on the truck size. A paper pulp mill will manufacture several
grades of paper in rolls of different width. The subgroup size, a roll of paper, will not be constant. In
situations where the number of defects is counted, but the subgroup size cannot be held constant, a
u-chart should be constructed.
Fiberglass Baths—Fiberglass Baths is a rapidly growing manufacturer of fiberglass tubs and
shower enclosures. Fiberglass tubs and shower stalls are made by first spraying an epoxy-based
paint on a mold and then spraying on a coat of fiberglass. When the fiberglass has dried, the mold is
peeled off. Unfortunately, sometimes the process causes a blemish in the paint. The tub or shower
stall is then set aside and someone has to buff out the blemish, a time-consuming process.
The company has decided to begin a process improvement effort and has started keeping track
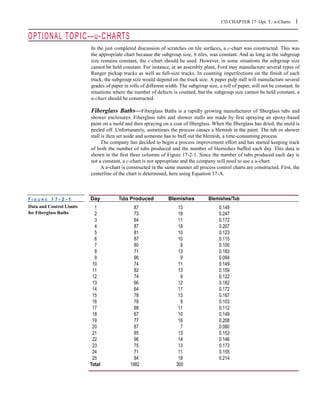
of both the number of tubs produced and the number of blemishes buffed each day. This data is
shown in the first three columns of Figure 17-2-1. Since the number of tubs produced each day is
not a constant, a c-chart is not appropriate and the company will need to use a u-chart.
A u-chart is constructed in the same manner all process control charts are constructed. First, the
centerline of the chart is determined, here using Equation 17-A.
F I G U R E 1 7 - 2 - 1 Day Tubs Produced Blemishes Blemishes/Tub
Data and Control Limits 1 87 13 0.149
for Fiberglass Baths 2 73 18 0.247
3 64 11 0.172
4 87 18 0.207
5 81 10 0.123
6 87 10 0.115
7 80 8 0.100
8 71 13 0.183
9 96 9 0.094
10 74 11 0.149
11 82 13 0.159
12 74 9 0.122
13 66 12 0.182
14 64 11 0.172
15 78 13 0.167
16 78 8 0.103
17 98 11 0.112
18 67 10 0.149
19 77 16 0.208
20 87 7 0.080
21 85 13 0.153
22 96 14 0.146
23 75 13 0.173
24 71 11 0.155
25 84 18 0.214
Total 1982 300

More Related Content

Viewers also liked (13)

An introduction to x-BAR chart
An introduction to x-BAR chartAn introduction to x-BAR chart
An introduction to x-BAR chart
 
Signal modelling
Signal modellingSignal modelling
Signal modelling
 
control Chart u np c p
control Chart u np c pcontrol Chart u np c p
control Chart u np c p
 
Multivariate Analaysis of Variance (MANOVA): Sharma, Chapter 11 - Bijan Yavar
Multivariate Analaysis of Variance (MANOVA): Sharma, Chapter 11 - Bijan YavarMultivariate Analaysis of Variance (MANOVA): Sharma, Chapter 11 - Bijan Yavar
Multivariate Analaysis of Variance (MANOVA): Sharma, Chapter 11 - Bijan Yavar
 
Manova
ManovaManova
Manova
 
Control charts
Control chartsControl charts
Control charts
 
P chart & c-chart
P chart & c-chartP chart & c-chart
P chart & c-chart
 
Control charts
Control chartsControl charts
Control charts
 
SAMPLING AND SAMPLING ERRORS
SAMPLING AND SAMPLING ERRORSSAMPLING AND SAMPLING ERRORS
SAMPLING AND SAMPLING ERRORS
 
Kinds & classification of research
Kinds & classification of researchKinds & classification of research
Kinds & classification of research
 
Definition and types of research
Definition and types of researchDefinition and types of research
Definition and types of research
 
Research Methods: Basic Concepts and Methods
Research Methods: Basic Concepts and MethodsResearch Methods: Basic Concepts and Methods
Research Methods: Basic Concepts and Methods
 
Types of Research
Types of ResearchTypes of Research
Types of Research
 

Similar to Control Chart for Attributes U

Developing barcode scan system of a small-scaled reverse vending machine to s...
Developing barcode scan system of a small-scaled reverse vending machine to s...Developing barcode scan system of a small-scaled reverse vending machine to s...
Developing barcode scan system of a small-scaled reverse vending machine to s...
TELKOMNIKA JOURNAL
 
ME3310 - Report 2 - Cam Design for Peanut Butter Extrusion
ME3310 - Report 2 - Cam Design for Peanut Butter ExtrusionME3310 - Report 2 - Cam Design for Peanut Butter Extrusion
ME3310 - Report 2 - Cam Design for Peanut Butter Extrusion
Constantine Christelis
 
3117t13 A;signment Print ViewEsercise 17-1 4 Activity-bas.docx
3117t13 A;signment Print ViewEsercise 17-1 4 Activity-bas.docx3117t13 A;signment Print ViewEsercise 17-1 4 Activity-bas.docx
3117t13 A;signment Print ViewEsercise 17-1 4 Activity-bas.docx
gilbertkpeters11344
 
CON E 430 FALL 2012CASE STUDYHossein Hemati Jona.docx
CON E 430 FALL 2012CASE STUDYHossein Hemati Jona.docxCON E 430 FALL 2012CASE STUDYHossein Hemati Jona.docx
CON E 430 FALL 2012CASE STUDYHossein Hemati Jona.docx
donnajames55
 
OPM500 EMC Additional InformationA. EMC—Background Information.docx
OPM500 EMC Additional InformationA.  EMC—Background Information.docxOPM500 EMC Additional InformationA.  EMC—Background Information.docx
OPM500 EMC Additional InformationA. EMC—Background Information.docx
hopeaustin33688
 

Similar to Control Chart for Attributes U (20)

Developing barcode scan system of a small-scaled reverse vending machine to s...
Developing barcode scan system of a small-scaled reverse vending machine to s...Developing barcode scan system of a small-scaled reverse vending machine to s...
Developing barcode scan system of a small-scaled reverse vending machine to s...
 
HCB Manual gtz 2008.doc
HCB Manual gtz 2008.docHCB Manual gtz 2008.doc
HCB Manual gtz 2008.doc
 
DELHI-AGRA ROAD PROJECT
DELHI-AGRA ROAD PROJECTDELHI-AGRA ROAD PROJECT
DELHI-AGRA ROAD PROJECT
 
ME3310 - Report 2 - Cam Design for Peanut Butter Extrusion
ME3310 - Report 2 - Cam Design for Peanut Butter ExtrusionME3310 - Report 2 - Cam Design for Peanut Butter Extrusion
ME3310 - Report 2 - Cam Design for Peanut Butter Extrusion
 
PN_article_Hollow Glass Moulding Precision_en_Oct15
PN_article_Hollow Glass Moulding Precision_en_Oct15PN_article_Hollow Glass Moulding Precision_en_Oct15
PN_article_Hollow Glass Moulding Precision_en_Oct15
 
PULSE-SBM.pptx
PULSE-SBM.pptxPULSE-SBM.pptx
PULSE-SBM.pptx
 
Finishing Manual Chaity Group.pdf
Finishing Manual Chaity Group.pdfFinishing Manual Chaity Group.pdf
Finishing Manual Chaity Group.pdf
 
Developers Transflex Installation
Developers Transflex InstallationDevelopers Transflex Installation
Developers Transflex Installation
 
2nd Semester MBA (Dec-2015; Jan-2016) Question Papers
2nd Semester MBA (Dec-2015; Jan-2016) Question Papers2nd Semester MBA (Dec-2015; Jan-2016) Question Papers
2nd Semester MBA (Dec-2015; Jan-2016) Question Papers
 
Final take home exam
Final take home examFinal take home exam
Final take home exam
 
Mmup questionnaire 4
Mmup questionnaire 4Mmup questionnaire 4
Mmup questionnaire 4
 
Finishing Manual Chaity Group.pdf
Finishing Manual Chaity Group.pdfFinishing Manual Chaity Group.pdf
Finishing Manual Chaity Group.pdf
 
Finishing Manual Chaity Group.pdf
Finishing Manual Chaity Group.pdfFinishing Manual Chaity Group.pdf
Finishing Manual Chaity Group.pdf
 
3117t13 A;signment Print ViewEsercise 17-1 4 Activity-bas.docx
3117t13 A;signment Print ViewEsercise 17-1 4 Activity-bas.docx3117t13 A;signment Print ViewEsercise 17-1 4 Activity-bas.docx
3117t13 A;signment Print ViewEsercise 17-1 4 Activity-bas.docx
 
PCB MANUFACTURING
PCB MANUFACTURINGPCB MANUFACTURING
PCB MANUFACTURING
 
CON E 430 FALL 2012CASE STUDYHossein Hemati Jona.docx
CON E 430 FALL 2012CASE STUDYHossein Hemati Jona.docxCON E 430 FALL 2012CASE STUDYHossein Hemati Jona.docx
CON E 430 FALL 2012CASE STUDYHossein Hemati Jona.docx
 
Best Practices for Cementing Job Software
Best Practices for Cementing Job SoftwareBest Practices for Cementing Job Software
Best Practices for Cementing Job Software
 
Project
ProjectProject
Project
 
ADVANCED TOOL FOR FLUID DYNAMICS-CFD AND ITS APPLICATIONS IN AUTOMOTIVE, AERO...
ADVANCED TOOL FOR FLUID DYNAMICS-CFD AND ITS APPLICATIONS IN AUTOMOTIVE, AERO...ADVANCED TOOL FOR FLUID DYNAMICS-CFD AND ITS APPLICATIONS IN AUTOMOTIVE, AERO...
ADVANCED TOOL FOR FLUID DYNAMICS-CFD AND ITS APPLICATIONS IN AUTOMOTIVE, AERO...
 
OPM500 EMC Additional InformationA. EMC—Background Information.docx
OPM500 EMC Additional InformationA.  EMC—Background Information.docxOPM500 EMC Additional InformationA.  EMC—Background Information.docx
OPM500 EMC Additional InformationA. EMC—Background Information.docx
 

Control Chart for Attributes U

  • 1. OPTIONAL TOPIC—u-CHARTS CD CHAPTER 17 Opt. T.: u-Charts 1 In the just completed discussion of scratches on tile surfaces, a c-chart was constructed. This was the appropriate chart because the subgroup size, 6 tiles, was constant. And as long as the subgroup size remains constant, the c-chart should be used. However, in some situations the subgroup size cannot be held constant. For instance, at an assembly plant, Ford may manufacture several types of Ranger pickup trucks as well as full-size trucks. In counting imperfections on the finish of each truck, the subgroup size would depend on the truck size. A paper pulp mill will manufacture several grades of paper in rolls of different width. The subgroup size, a roll of paper, will not be constant. In situations where the number of defects is counted, but the subgroup size cannot be held constant, a u-chart should be constructed. Fiberglass Baths—Fiberglass Baths is a rapidly growing manufacturer of fiberglass tubs and shower enclosures. Fiberglass tubs and shower stalls are made by first spraying an epoxy-based paint on a mold and then spraying on a coat of fiberglass. When the fiberglass has dried, the mold is peeled off. Unfortunately, sometimes the process causes a blemish in the paint. The tub or shower stall is then set aside and someone has to buff out the blemish, a time-consuming process. The company has decided to begin a process improvement effort and has started keeping track of both the number of tubs produced and the number of blemishes buffed each day. This data is shown in the first three columns of Figure 17-2-1. Since the number of tubs produced each day is not a constant, a c-chart is not appropriate and the company will need to use a u-chart. A u-chart is constructed in the same manner all process control charts are constructed. First, the centerline of the chart is determined, here using Equation 17-A. F I G U R E 1 7 - 2 - 1 Day Tubs Produced Blemishes Blemishes/Tub Data and Control Limits 1 87 13 0.149 for Fiberglass Baths 2 73 18 0.247 3 64 11 0.172 4 87 18 0.207 5 81 10 0.123 6 87 10 0.115 7 80 8 0.100 8 71 13 0.183 9 96 9 0.094 10 74 11 0.149 11 82 13 0.159 12 74 9 0.122 13 66 12 0.182 14 64 11 0.172 15 78 13 0.167 16 78 8 0.103 17 98 11 0.112 18 67 10 0.149 19 77 16 0.208 20 87 7 0.080 21 85 13 0.153 22 96 14 0.146 23 75 13 0.173 24 71 11 0.155 25 84 18 0.214 Total 1982 300