
Recommended
More Related Content
More from amylute
More from amylute (20)
Recently uploaded
Recently uploaded (20)
Chi square test of association independence
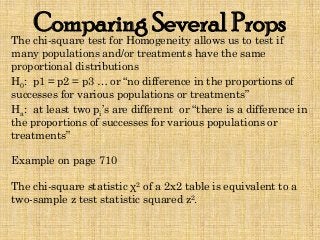
- 1. Comparing Several PropsThe chi-square test for Homogeneity allows us to test if many populations and/or treatments have the same proportional distributions H0: p1 = p2 = p3 … or “no difference in the proportions of successes for various populations or treatments” Ha: at least two pi’s are different or “there is a difference in the proportions of successes for various populations or treatments” Example on page 710 The chi-square statistic χ2 of a 2x2 table is equivalent to a two-sample z test statistic squared z2.
- 2. Comparing Several PropsIt is also common to take a single random sample of a single population and classify the data in two categorical variables. A study followed a random sample of 8474 people with normal blood pressure for about four years. All the individuals were free of heart disease at the beginning of the study. Each person took the Spielberger Trait Anger Scale Test, which measures how prone a person is to sudden anger. Researchers also recorded whether each individual developed coronary hear disease (CHD). This includes people who had heart attacks and those who needed medical treatment for heart disease. Low Anger Moderate Anger High Anger Total CHD 53 110 27 190 NO CHD 3057 4621 606 8284 Total 3110 4731 663 8474
- 3. Comparing Several PropsRandom sample of 8474 people with normal blood pressure. All the individuals were free of heart disease at the beginning of the study. Each person took the Spielberger Trait Anger Scale Test, which measures how prone a person is to sudden anger. Whether each individual developed coronary hear disease (CHD, including people who had heart attacks and those who needed medical treatment for heart disease. Calculate appropriate conditional distributions to describe the relationship between anger and CHD status Low Anger Moderate Anger High Anger Total CHD 53 110 27 190 NO CHD 3057 4621 606 8284 Total 3110 4731 663 8474
- 4. Comparing Several Props Make a well-labeled graph that compares the conditional distributions in part A Write a few sentences describing the relationship between the two variables. Do these data provide convincing evidence of an association between the variables in the larger population? … need new test!! Low Anger Moderate Anger High Anger Total CHD 53 110 27 190 NO CHD 3057 4621 606 8284 Total 3110 4731 663 8474
- 5. Comparing Several PropsChi-Square Test for Association/Independence Null – no association between categorical variables Alternative – there is an association between variables H0: there is no association between anger level and heart disease in the population of people with normal blood pressure Ha: there is an association between anger level and heart disease in the population of people with normal blood pressure No association means one variable does not occur in common with the other; the variables are independent Goal – analyze the relationship between two variables.
- 6. Comparing Several PropsH0: there is no association between anger level and heart disease in the population of people with normal blood pressure Ha: there is an association between anger level and heart disease in the population of people with normal blood pressure Similarly: H0: anger and heart disease are independent in the population of people with normal blood pressure Ha: anger and heart disease are not independent in the population of people with normal blood pressure. Begin by comparing observed counts with the expected counts if null is true.
- 7. Comparing Several PropsFind expected counts The null hypothesis is that there is no association between anger level and heart disease in the population of interest. If we assume that H0 is true, then anger level and heart disease are independent. We can find the expected cell counts Low Anger Moderate Anger High Anger Total CHD 53 110 27 190 NO CHD 3057 4621 606 8284 Total 3110 4731 663 8474
- 8. Comparing Several Props Chi-Square Test for Association/Independence If Large Sample Size, Random, & Independent conditions are met H0: There is no association between two categorical variables in the population of interest Ha: there is an association between two categorical variables in the population of interest Or H0: two categorical variables are independent in the population of interest Ha: two categorical variables are not independent in the population of interest Find expected counts, then calculate chi-square statistic Degree of freedom = (number of rows – 1)(number of columns – 1) P-value area to the right of the statistic
- 9. Comparing Several Props Do the data provide convincing evidence of an association between anger level and heart disease in the population of interest? Carry out an appropriate test to help answer the question. Observed counts: Expected Counts: State: Plan: Do: Conclude: Pg. 717 Low Mod. High Low Mod. High CHD 53 110 27 69.73 106.08 14.19 NO CHD 3057 4621 606 3040.27 4624.92 618.81
- 10. Comparing Several Props Can we conclude that being prone to anger causes heart disease? - Observational study - Lurking variables