1. Global Economic Research March 6, 2013
Global Auto Report
Carlos Gomes (416) 866-4735
carlos.gomes@scotiabank.com
Record Sales And Production In Early 2013
— North American Output Schedules Point To Further Gains In The Spring
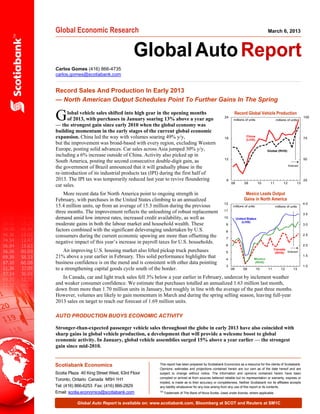
G lobal vehicle sales shifted into high gear in the opening months
of 2013, with purchases in January soaring 13% above a year ago
— the strongest gain since early 2010 when the global economy was
24
Record Global Vehicle Production
millions of units millions of units
100
building momentum in the early stages of the current global economic
expansion. China led the way with volumes soaring 49% y/y, 18
China
(LHS)
75
but the improvement was broad-based with every region, excluding Western
Europe, posting solid advances. Car sales across Asia jumped 30% y/y, Global (RHS)
including a 6% increase outside of China. Activity also picked up in
12 50
South America, posting the second consecutive double-digit gain, as
the government of Brazil announced that it will gradually phase in the forecast
re-introduction of its industrial products tax (IPI) during the first half of
2013. The IPI tax was temporarily reduced last year to revive floundering 6 25
08 09 10 11 12 13
car sales.
More recent data for North America point to ongoing strength in Mexico Leads Output
February, with purchases in the United States climbing to an annualized Gains in North America
12 4.0
15.4 million units, up from an average of 15.3 million during the previous millions of units millions of units
three months. The improvement reflects the unleashing of robust replacement 11
3.5
demand amid low interest rates, increased credit availability, as well as 10 United States
(LHS)
moderate gains in both the labour market and household wealth. These 9 3.0
factors combined with the significant deleveraging undertaken by U.S. 8
consumers during the current economic upswing are more than offsetting the 7
2.5
negative impact of this year’s increase in payroll taxes for U.S. households.
6 2.0
An improving U.S. housing market also lifted pickup truck purchases 5
Canada
(RHS) forecast
21% above a year earlier in February. This solid performance highlights that 4 Mexico
1.5
business confidence is on the mend and is consistent with other data pointing (RHS)
3 1.0
to a strengthening capital goods cycle south of the border. 08 09 10 11 12 13
In Canada, car and light truck sales fell 3% below a year earlier in February, undercut by inclement weather
and weaker consumer confidence. We estimate that purchases totalled an annualized 1.63 million last month,
down from more than 1.70 million units in January, but roughly in line with the average of the past three months.
However, volumes are likely to gain momentum in March and during the spring selling season, leaving full-year
2013 sales on target to reach our forecast of 1.69 million units.
AUTO PRODUCTION BUOYS ECONOMIC ACTIVITY
Stronger-than-expected passenger vehicle sales throughout the globe in early 2013 have also coincided with
sharp gains in global vehicle production, a development that will provide a welcome boost to global
economic activity. In January, global vehicle assemblies surged 15% above a year earlier — the strongest
gain since mid-2010.
Scotiabank Economics This report has been prepared by Scotiabank Economics as a resource for the clients of Scotiabank.
Opinions, estimates and projections contained herein are our own as of the date hereof and are
Scotia Plaza 40 King Street West, 63rd Floor subject to change without notice. The information and opinions contained herein have been
compiled or arrived at from sources believed reliable but no representation or warranty, express or
Toronto, Ontario Canada M5H 1H1
implied, is made as to their accuracy or completeness. Neither Scotiabank nor its affiliates accepts
Tel: (416) 866-6253 Fax: (416) 866-2829 any liability whatsoever for any loss arising from any use of this report or its contents.
Email: scotia.economics@scotiabank.com TM
Trademark of The Bank of Nova Scotia. Used under license, where applicable.
Global Auto Report is available on: www.scotiabank.com, Bloomberg at SCOT and Reuters at SM1C
2. Global Economic Research March 6, 2013
Global Auto Report
Thailand Becomes a TOP 10 Global Auto Manufacturer months, and will add nearly half a percentage point to economic
Asia also led the gains in vehicle production. However, it was growth in the United States in the second quarter.
Thailand, not China that posted the strongest advance. Vehicle The impact will be even greater in Mexico, with second-
output in Thailand soared 68% above a year earlier in January, quarter assemblies scheduled to jump 9% above a year earlier
climbing to record highs alongside robust exports and strong to an annualized 3.1 million units. We estimate that this will
domestic car sales. Nearly 60% of all vehicles produced in add nearly a full percentage point to economic growth in
Thailand are geared to the domestic market, with the remaining Mexico in the April-June period — the largest contribution
40% shipped overseas. Domestic car sales will continue to be since the final months of 2009, when the global economic
supported by a government new car buyer rebate which has expansion was in its infancy.
been extended to June 2013.
The improvement will be driven by a 44% y/y jump in truck
Automakers with operations in Thailand have invested in production at General Motors, as assemblies of the new GMT900
excess of US$1 billion in recent years to either expand capacity pickups begin in Silao, Mexico this spring. In fact, a
or re-tool for new models. The Thai Federation of Industries strengthening U.S. housing market suggests that production of
expects vehicle production to jump 43% y/y in the first quarter, large pickups is going to be a source of strength for both the auto
while a government official recently stated that full-year 2013 industry and Mexico over the next several years. Pickup trucks
vehicle assemblies could reach 2.8 million units, up from 2.4 account for roughly one-quarter of overall vehicle production in
million last year. This would enable car and truck production in the southernmost NAFTA member, compared with 15% in the
Thailand to leapfrog past assemblies in Canada and secure a ‘top United States. Aside from General Motors, Nissan will also
10’ global ranking in vehicle output this year, up from 13th place provide a significant boost to assemblies in Mexico, as it raises
in 2012. Record vehicle production in Thailand will provide a its second-quarter truck production 36% y/y.
significant boost to economic growth, as the auto industry
For its part, the Canadian auto industry currently specializes
accounts for roughly 10% of overall economic activity,
in meeting demand for the rapidly-growing CUV segment.
compared with an average of less than 3% for the G7 nations.
These models account for 40% of Canadian vehicle production
Further gains lie ahead, with the Thailand Automotive Institute
and their share will increase as Toyota boosts RAV4 output in
expecting production to surpass 3 million units by 2015.
Woodstock. Production gains in Canada will also be supported
Mexico Leads North American Auto Assembly Revival in coming months by the start-up of assemblies for the
In North America, automakers are also planning to lift redesigned Chevrolet Impala, which begins in March at GM’s
production in coming months, leading us to increase our full Oshawa No.1 plant. Rising output of the Honda CR-V in
-year 2013 vehicle assemblies forecast to 16.5 million units, Alliston, Ontario will also boost overall assemblies. However,
up from 15.8 million in 2012. During the second quarter, North even with this added production, the auto sector will add only
American production is scheduled to jump above an annualized an annualized 0.1% to Canadian economic growth in the
16 million units for the first time since early 2007. This second quarter, in line with the contribution in the current
represents a significant ramp-up from the output level of recent period, due to a flat-to-weaker performance in other segments.
International Car Sales Outlook
1990-99 2000-09 2010 2011 2012 2013f
(m illions of units)
TOTAL SALES 39.20 49.64 56.82 58.89 62.45 65.71
North America* 16.36 18.38 13.96 15.22 17.07 18.23
Canada 1.27 1.59 1.56 1.59 1.68 1.69
United States 14.55 15.79 11.55 12.73 14.40 15.50
Mexico 0.54 1.00 0.85 0.90 0.99 1.04
Western Europe 13.11 14.39 12.98 12.80 11.76 11.76
Germ any 3.57 3.33 2.92 3.17 3.08 3.14
Eastern Europe 1.18 2.71 3.14 3.90 4.14 4.50
Rus s ia 0.78 1.53 1.91 2.65 2.93 3.08
Asia 6.91 11.64 22.47 22.50 24.76 26.24
China 0.43 3.56 9.41 10.04 10.68 11.79
India 0.31 0.89 1.87 1.95 2.02 2.12
South America 1.64 2.52 4.27 4.47 4.72 4.98
Brazil 0.94 1.57 2.69 2.64 2.84 2.98
*Includes light trucks.
2
3. Global Economic Research March 6, 2013
Global Auto Report
Canada/U.S. Motor Vehicle Sales Outlook
1991-05 2006-10 2011 2012 2013
Average Jan-Feb ** Annual f
(thousands of units, annualized)
CANADA 1,398 1,586 1,589 1,677 1,670 1,690
Cars 797 815 691 760 730 767
Domestic 583 500 433 470 455 475
Transplants 178 270 257 280 275 282
Imports 214 315 258 290 275 292
Light Trucks 601 771 898 917 940 923
(millions of units, annualized)
UNITED STATES 15.5 13.5 12.7 14.4 15.3 15.5
Cars 8.3 6.7 6.1 7.2 7.8 7.9
Light Trucks 7.2 6.8 6.6 7.2 7.5 7.6
(millions of units, annualized)
NORTH AMERICAN
PRODUCTION* 15.58 13.03 13.11 15.77 15.90 16.50
CANADA 2.50 2.16 2.13 2.46 2.50 2.60
UNITED STATES 11.67 8.83 8.64 10.30 10.40 10.80
MEXICO 1.41 2.04 2.34 3.01 3.00 3.10
*Inc ludes transplants; light, medium and heavy truc ks. **U.S. sales and North Americ an produc tion to February. Canadian sales are Sc otiabank estimates.
Vehicle Sales Outlook By Province*
(thousands of units, annual rates)
1994-05 2006-10 2011 2012 2013
Average Jan-Feb * Annual f
CANADA 1,446 1,586 1,589 1,677 1,670 1,690
ATLANTIC 102 118 119 126 129 128
CENTRAL 936 985 997 1,034 1,017 1,038
Quebec 366 408 408 416 421 417
Ontario 570 577 589 618 596 621
WEST 408 483 473 517 524 524
Manitoba 42 44 47 50 53 50
Saskatchewan 36 44 50 55 58 56
Alberta 166 220 218 239 250 244
British Columbia 164 175 158 173 163 174
*Includes cars and light trucks.* Scotiabank estimates.
800 800 275 275 70 70
thousands of units thousands of units thousands of units
250 250
700 700 Alberta
225 225 60 60
Ontario Manitoba
600 600 200 200
British 50 50
175 Columbia 175
500 500
150 150
40 40
400 Quebec 400 125 125
100 100 30 30
300 300
75 75 Saskatchewan
Atlantic
200 200 50 50 20 20
80 84 88 92 96 00 04 08 12 80 84 88 92 96 00 04 08 12 80 84 88 92 96 00 04 08 12
Includes cars and trucks (light, medium and heavy).
Shaded bars indicate U.S. recession periods.
3
4. Global Economic Research March 6, 2013
Global Auto Report
Auto Market Share By Manufacturer — Canada*
(thousands of units, not seasonally adjusted)
2012 2013 2012 2013
Jan to Feb Jan to Feb Feb Feb
Units % of Total Units % of Total Units % of Total Units % of Total
TOTAL 87.3 100.0 82.6 100.0 46.3 100.0 44.2 100.0
Big Three 19.4 22.2 21.0 25.3 10.0 21.7 11.2 25.3
General Motors 8.2 9.4 8.9 10.7 4.3 9.3 4.7 10.6
Ford 6.2 7.1 6.7 8.1 3.3 7.2 3.7 8.4
Chrysler 5.0 5.7 5.4 6.5 2.4 5.2 2.8 6.3
Japanese 39.1 44.7 33.1 40.1 20.4 44.0 17.4 39.3
Honda 10.2 11.6 8.7 10.5 4.4 9.4 4.6 10.3
Toyota 12.5 14.3 10.6 12.8 6.9 14.9 5.2 11.7
Nissan 5.9 6.7 4.6 5.6 3.3 7.2 2.5 5.7
Mazda 7.0 8.1 6.6 7.9 4.0 8.6 3.8 8.5
Mitsubishi 1.0 1.2 0.9 1.1 0.5 1.1 0.5 1.1
Subaru 2.0 2.3 1.3 1.6 1.0 2.2 0.7 1.6
Hyundai 11.5 13.2 11.1 13.4 6.5 14.0 6.3 14.1
Volkswagen 5.6 6.4 6.4 7.8 3.0 6.5 3.5 7.9
Kia 5.5 6.4 5.2 6.3 3.2 6.9 2.7 6.2
BMW 2.1 2.4 2.3 2.9 1.1 2.3 1.2 2.8
Mercedes-Benz 2.0 2.3 1.8 2.2 1.1 2.4 1.0 2.3
Other 2.1 2.4 1.7 2.0 1.0 2.2 0.9 2.1
*Source: Dealer sales from the Association of International Automobile Manufacturers of Canada.
Truck Market Share By Manufacturer — Canada*
(thousands of units, not seasonally adjusted)
2012 2013 2012 2013
Jan to Feb Jan to Feb Feb Feb
Units % of Total Units % of Total Units % ot Total Units % of Total
TOTAL 122.6 100.0 121.0 100.0 63.4 100.0 61.4 100.0
Big Three 71.4 58.2 72.0 59.5 36.2 57.2 35.9 58.3
General Motors 19.0 15.5 18.9 15.6 9.9 15.7 9.3 15.1
Ford 24.2 19.7 24.6 20.3 12.2 19.2 12.6 20.4
Chrysler 28.2 23.0 28.5 23.6 14.1 22.3 14.0 22.8
Other Domestic 6.2 5.1 6.9 5.7 3.2 5.0 2.9 4.8
Japanese 27.7 22.6 26.2 21.7 14.8 23.4 14.3 23.3
Honda 7.9 6.4 6.4 5.3 4.5 7.1 3.3 5.3
Toyota 10.6 8.6 9.6 8.0 5.5 8.7 5.6 9.1
Nissan 5.8 4.7 5.6 4.6 3.0 4.8 3.1 5.0
Mazda 1.4 1.2 2.0 1.7 0.7 1.2 1.1 1.7
Mitsubishi 2.0 1.6 1.8 1.5 1.1 1.7 0.9 1.4
Subaru 1.8 1.4 2.4 2.0 0.9 1.4 1.2 1.9
Hyundai 5.2 4.2 5.0 4.1 2.8 4.4 2.5 4.1
Kia 2.9 2.4 2.7 2.2 1.5 2.3 1.4 2.3
Other Imports 9.2 7.5 8.2 6.8 4.9 7.7 4.4 7.2
LIGHT TRUCKS 117.1 95.5 116.2 96.1 60.6 95.6 59.0 96.0
*Source: Dealer sales from the Association of International Automobile Manufacturers of Canada.
4
5. Global Economic Research March 6, 2013
Global Auto Report
Auto Sales By Province
(thousands of units, not seasonally adjusted)
2011 2012 2011 2012
Jan to Dec Jan to Dec Dec Dec
CANADA 691.1 759.1 45.7 48.1
ATLANTIC 55.0 61.5 3.3 3.1
Newfoundland 12.4 14.0 0.7 0.6
Nova Scotia 23.3 25.8 1.4 1.3
New Brunswick 16.5 18.3 1.0 1.0
Prince Edward Island 2.8 3.4 0.2 0.2
CENTRAL 490.7 533.6 32.2 33.1
Quebec 227.4 240.6 14.9 13.6
Ontario 263.3 293.0 17.3 19.5
WEST 145.4 164.0 10.2 11.9
Manitoba 15.8 17.3 1.1 1.2
Saskatchewan 11.9 13.5 0.8 0.9
Alberta 53.1 59.4 3.4 4.0
British Columbia 64.6 73.8 4.9 5.8
Truck Sales By Province*
(thousands of units, not seasonally adjusted)
2011 2012 2011 2012
Jan to Dec Jan to Dec Dec Dec
CANADA 929.5 957.7 72.3 63.9
ATLANTIC 67.0 67.2 4.9 4.0
Newfoundland 18.4 19.3 1.3 0.9
Nova Scotia 22.6 22.9 1.7 1.4
New Brunswick 23.0 21.6 1.7 1.3
Prince Edward Island 3.0 3.4 0.2 0.4
CENTRAL 523.5 521.5 38.4 32.4
Quebec 186.1 182.5 13.2 10.2
Ontario 337.4 339.0 25.2 22.2
WEST 339.0 369.0 29.0 27.5
Manitoba 32.8 34.9 2.8 2.6
Saskatchewan 39.2 43.0 3.5 3.3
Alberta 171.1 188.4 14.6 13.9
British Columbia 95.9 102.7 8.1 7.7
*Light, medium and heavy trucks.
5
6. Global Economic Research March 6, 2013
Global Auto Report
Canadian Motor Vehicle Production*
(thousands of units, not seasonally adjusted)
2011 2012 2012 2013
Jan to Dec Jan to Dec Jan Jan
TOTAL 2,135.1 2,463.7 210.6 183.4
CAR 990.5 1,040.4 98.3 85.0
Chrysler 194.6 240.2 19.1 20.4
Ford 76.5 0.0 0.0 0.0
GM 317.9 319.6 29.2 26.1
Honda 179.9 226.4 26.9 23.0
Toyota 221.6 254.2 23.1 15.5
TRUCKS** 1,144.6 1,423.3 112.3 98.4
CAMI (GM/Suzuki) 0.0 0.0 0.0 0.0
Chrysler 301.5 345.7 23.8 12.7
Ford 243.9 255.9 22.1 23.9
GM 343.9 363.5 32.2 29.8
Honda 54.1 183.6 9.3 15.3
Toyota 191.3 265.0 24.0 15.6
Others 9.9 9.6 0.9 1.1
*Production data from Ward’s Automotive Reports. **Light, medium and heavy trucks.
Canada — Motor Vehicle Production Canada — World Auto Trade Balances
3.4 3.4 50 50
quarterly billions of dollars
3.0 3.0 40 40
Total Assembled vehicles
2.6 2.6 30 30
2.2 2.2 20 20
Total
1.8 1.8 10 10
Cars
1.4 1.4 0 0
1.0 1.0 -10 -10
Parts
Trucks*
0.6 0.6 -20 -20
0.2 0.2 -30 -30
82 84 86 88 90 92 94 96 98 00 02 04 06 08 10 12 82 84 86 88 90 92 94 96 98 00 02 04 06 08 10 12
Millions of units, seasonally adjusted annual rates.
* Light, medium and heavy trucks.
6
7. Global Economic Research March 6, 2013
Global Auto Report
New & Used Car Prices
Scotiabank Car Price Indicators — Canada
year-over-year per cent change
25 25
Used*
15 New 15
5 5
CPI
-5 -5
-15 -15
79 80 82 84 86 88 90 92 94 96 98 00 02 04 06 08 10 12
* Scotiabank estimate from Canadian Black Book data.
Scotiabank Car Price Indicators — Canada
20 20
thousands of dollars by age of car, seasonally adjusted
18 18
16 16
14 14
12 1 Year 12
10 10
8 2 Year 8
6 6
4 Year
4 4
2 2
79 80 82 84 86 88 90 92 94 96 98 00 02 04 06 08 10 12
Scotiabank estimate from Canadian Black Book data.
Scotiabank Car Price Indicators — United States
year-over-year per cent change
25 25
15 Used 15
5 CPI 5
New
-5 -5
-15 -15
79 80 82 84 86 88 90 92 94 96 98 00 02 04 06 08 10 12
Consumer price indices for new and used cars.
Shaded areas indicate recession periods.
7
8. Global Economic Research March 6, 2013
Global Auto Report
Canadian Corporate Financial Performance
Motor Vehicle Dealers and Repair Shops
Net Income Pre-Tax Inventory Interest Debt/ Return on
After Tax Profit Turnover Coverage Equity Shareholders
($ mil) Margin (%) Ratio Ratio Ratio Equity (%)
Annual 2000 400 0.75 6.79 2.10 2.02 6.46
2001 521 0.75 7.06 2.13 1.98 8.37
2002 773 1.02 7.48 3.09 2.04 11.28
2003 594 0.91 5.30 2.65 2.91 10.14
2004 571 0.69 4.98 2.25 3.17 10.49
2005 799 0.93 5.35 2.55 2.74 12.90
2006 942 1.20 5.16 2.64 2.75 14.37
2007 1089 1.41 5.05 3.36 2.56 15.13
2008 1142 1.43 5.04 3.51 2.44 14.66
2009 1392 1.84 5.34 4.85 2.07 16.99
2010 1645 2.05 4.98 5.33 2.15 18.61
2011 1939 2.21 4.91 5.08 1.77 17.65
2012 2330 2.52 4.74 5.36 1.67 19.05
Quarterly at annual rates
2011Q4 2948 3.20 5.20 6.05 1.58 24.19
2012Q1 2556 2.88 4.40 5.82 1.79 21.96
Q2 2908 2.97 4.81 6.56 1.76 24.35
Q3 1968 2.08 4.91 4.62 1.59 15.74
Q4 1888 2.17 4.86 4.57 1.55 14.71
Average (89-12) 755 1.20 6.14 2.90 2.36 11.13
Low (89-12) -68 0.10 4.30 1.10 3.57 -1.20
Definition of Ratios: Interest Coverage Ratio: (pre-tax income and interest payments)/(interest payments)
Pre-tax Profit Margin: pre-tax income/sales Debt/Equity Ratio: (short-term and long-term debt)/total equity
Inventory Turnover Ratio: sales/inventory Return of Shareholders’ Equity: after-tax income/total equity
Retail Auto Dealer Bankruptcies
30 30
number of bankruptcies
25 25
2012
20 2011 20
2010
15 15
10 10
5 5
0 0
Jan. Feb. Mar. Apr. May June July Aug. Sept. Oct. Nov. Dec.
New car dealers only; cumulative total during the year.
8