SlideShare a Scribd company logo
1 of 3
The Randomness of Returns
                                   1997      1998       1999       2000      2001       2002       2003      2004       2005       2006      2007       2008      2009       2010       2011

     Highest Return               40.72      37.81     31.70      36.18      24.88       2.58     36.10      23.47     24.11      35.72       9.82      2.56      68.35     38.09      11.72
                                  39.18      28.62     24.83      28.30      21.56       2.39     31.32      22.49     21.44      29.88       4.27    -21.94      46.22     23.38       4.30
                                  32.20      26.31     24.79      12.24      19.35      -3.63     30.11      17.53     19.56      26.10       3.36    -22.85      35.05     21.50       2.04
                                  28.65      21.65     22.53       7.41       4.36      -3.79     27.83      15.28     10.97      26.08       2.15    -24.94      27.29     17.61       0.90
                                  24.87      18.16     19.52       5.17       1.63      -3.86     26.74      14.47     10.95      23.18      -5.25    -25.55      25.12     16.40      -3.52
                                  14.99       4.74     17.28       1.54       1.05     -12.45     18.85      11.49     10.72      22.11      -7.92    -30.06      13.99     14.53      -5.19
                                  13.77       4.60     13.94       0.24      -6.40     -16.02     13.57      10.98     10.69      18.15     -10.09    -30.67      13.85     10.26      -8.71
                                   6.22      -0.47       4.59     -5.54     -11.56     -16.75     11.60       8.63       4.16     17.25     -10.14    -32.53      10.98       9.16    -10.00
                                   5.95      -1.59       3.48     -7.77     -12.57     -16.77      7.46       8.42       3.05     16.56     -15.63    -33.00       9.26       2.22    -10.26
                                   2.85     -11.05       0.39     -8.82     -13.41     -20.47      5.46       2.80       2.57     15.58     -17.01    -35.24       3.47       0.43    -12.43

     Lowest Return               -10.82     -21.01      -8.30    -10.80     -16.55     -22.85      2.86       2.25       2.29      3.93     -29.73    -45.71       0.36      -2.14    -13.78


                                   1997      1998       1999       2000      2001       2002       2003      2004       2005       2006      2007       2008      2009       2010       2011

Canadian Fixed Incom e             2.85       4.60       4.59      5.17       4.36       2.39      2.86       2.25       2.57      3.93       4.27      2.56       0.36       0.43      0.90
Canadian Large Cap                14.99      -1.59     31.70       7.41     -12.57     -12.45     26.74      14.47     24.11      17.25       9.82    -33.00      35.05     17.61      -8.71
Canadian Value                    28.65      -0.47       3.48     28.30       1.05      -3.63     27.83      17.53     21.44      18.15       2.15    -32.53      46.22     16.40      -5.19
Canadian Small Cap                13.77     -21.01     24.79       1.54      21.56      -3.86     36.10       8.63     10.72      23.18       3.36    -45.71      68.35     38.09     -12.43
US Large Cap                      39.18      37.81     13.94      -5.54      -6.40     -22.85      5.46       2.80       2.29     15.58     -10.09    -22.85       9.26       9.16      4.30
US Value                          40.72      21.65       0.39     12.24       1.63     -16.02      7.46       8.42       4.16     22.11     -15.63    -21.94       3.47     10.26       2.04
US Sm all Cap                     32.20       4.74     24.83      -7.77      24.88     -20.47     30.11      10.98       3.05     16.56     -17.01    -24.94      27.29     23.38      -3.52
US Real Estate                    24.87     -11.05      -8.30     36.18      19.35       2.58     11.60      23.47     10.97      35.72     -29.73    -25.55      10.98     21.50      11.72
International Large Cap            6.22      28.62     19.52     -10.80     -16.55     -16.75     13.57      11.49     10.69      26.10      -5.25    -30.67      13.85       2.22    -10.26
International Value                5.95      26.31     17.28       0.24     -13.41     -16.77     18.85      15.28     10.95      29.88     -10.14    -30.06      13.99      -2.14    -10.00
International Sm all Cap         -10.82      18.16     22.53      -8.82     -11.56      -3.79     31.32      22.49     19.56      26.08      -7.92    -35.24      25.12     14.53     -13.78


In Canadian dollars. Charts are for illustrative purposes only.
Canadian Fixed Income is Canadian One-Month Treasury Bills. Canadian Large Cap is the S&P/TSX Composite Index. Canadian Value is the MSCI Canada IMI Value Index (gross dividends),
June 1998–2011; Barra Canada Value Index, January 1997–May 1998. Canadian Small Cap is the MSCI Canada Small Cap Index (gross dividends), January 1999–2011; Barra Canada Small Cap
Index, January 1997–December 1998. US Large Cap is the S&P 500 Index. US Value is Russell 3000 Value Index. US Small Cap is CRSP 6-10 Index. US Real Estate is the Dow Jones US Select
REIT Index. International Large Cap is the MSCI EAFE Index (net dividends), and International Value is the MSCI EAFE Value Index (net dividends). International Small Cap is compiled by
Dimensional from StyleResearch securities data; includes securities of MSCI EAFE countries in the 10%-1% of ME range; market-capitalization weighted; each country capped at 50%; value
defined as the top 30% of book-to-market; rebalanced semiannually. Canadian T-bills provided by PC-Bond a business unit of TSX Inc.; copyright © TSX Inc., all rights reserved. MSCI data
copyright MSCI 2012, all rights reserved. Canadian Barra data provided by MSCI Barra. The S&P data provided by Standard & Poor’s Index Services Group. Indices are not available for direct
investment. Index performance does not reflect the expenses associated with the management of an actual portfolio. Past performance is not a guarantee of future results.              S1035.9
Sample Portfolios: Allocations
                                                                                                            Fixed      Conservative     Moderate         Normal       Aggressive        Equity


 FIXED INCOME                                                                                              100%             80%             60%            40%            20%                –
 One-Month T-Bills                         Canadian One-Month T-Bills                                       100%             80%            60%            40%            20%                –

 EQUITY                                                                                                          –           20%            40%            60%            80%           100%

 CANADIAN STOCKS                                                                                                 –            6%            12%            18%            24%            30%
 Canadian Large Cap                        S&P/TSX Composite Index                                               –            2%              4%             6%             8%           10%

 Canadian Value                            MSCI Canada Value Index (gross dividends)                             –            2%              4%             6%             8%           10%

 Canadian Small Cap                        MSCI Canada Small Cap Index (price-only)                              –            2%              4%             6%             8%           10%

 US STOCKS                                                                                                       –            6%            12%            18%            24%            30%
 US Large Cap                              S&P 500 Index                                                         –            2%              4%             6%             8%           10%

 US Value                                  Russell 3000 Value Index                                              –            2%              4%             6%             8%           10%

 US Small Cap                              CRSP 6-10 Index                                                       –            2%              4%             6%             8%           10%

 INTERNATIONAL STOCKS                                                                                            –            6%            12%            18%            24%            30%
 International Large Cap                   MSCI EAFE Index (net dividends)                                       –            2%              4%             6%             8%           10%

 International Value                       MSCI EAFE Value Index (net dividends)                                 –            2%              4%             6%             8%           10%

 International Small Cap                   International Small Cap Index                                         –            2%              4%             6%             8%           10%

 REAL ESTATE                                                                                                     –            2%             4%             6%             8%            10%
 Real Estate                               Dow Jones Wilshire US Select REIT Index                               –            2%              4%             6%             8%           10%

The returns and other characteristics of the allocation mixes contained in this presentation are based on model/back-tested simulations to demonstrate broad economic principles. They were
achieved with the benefit of hindsight and do not represent actual investment performance. There are limitations inherent in model performance; it does not reflect trading in actual accounts and
may not reflect the impact that economic and market factors may have had on an advisor’s decision making if the advisor were managing actual client money. Model performance is hypothetical
and is for illustrative purposes only. Model performance shown includes reinvestment of dividends and other earnings but does not reflect the deduction of investment advisory fees or other
expenses. Clients’ investment returns would be reduced by the advisory fees and other expenses they would incur in the management of their accounts. S&P/TSX data provided by S&P/TSX. The
S&P data are provided by Standard & Poor's Index Services Group. Russell data copyright © Russell Investment Group 1996-2012, all rights reserved. CRSP data provided by the Center for
Research in Security Prices, University of Chicago. MSCI data copyright MSCI 2012, all rights reserved. Dow Jones Wilshire data provided by Dow Jones Indexes.
For illustrative purposes only. The balanced strategies are not recommendations for an actual allocation.
Indices are not available for direct investment. Index performance does not reflect the expenses associated with the management of an actual portfolio. Past performance is not a guarantee of
future results. Not to be construed as investment advice.                                                                                                                                   S1035.9
Model Portfolio: Historical Returns
Annual Return (%)

                          1997     1998     1999     2000      2001    2002     2003       2004      2005   2006    2007      2008     2009     2010       2011

Highest Return           17.86    11.45    14.89     5.18      4.36     2.39   20.84      13.58     11.93   22.78    4.27     2.56    24.74     14.43       0.90

                         14.83    10.48    12.82     5.17      3.81    -0.60   17.32      11.31     10.02   19.00    1.66    -4.57    19.94     11.66      -0.13

                         11.81     9.30    10.76     5.17      3.16    -3.62   13.75       9.05      8.12   15.22   -0.92   -11.38    15.09      8.87      -1.22

                          8.80     7.92     8.70     5.14      2.42    -6.68   10.15       6.78      6.25   11.44   -3.47   -17.88    10.20      6.07      -2.37

                          5.82     6.35     6.64     5.10      1.59    -9.77     6.51      4.51      4.40    7.68   -5.98   -24.08     5.29      3.25      -3.57

Lowest Return             2.85     4.60     4.59     5.03      0.67   -12.89     2.86      2.25      2.57    3.93   -8.46   -29.97     0.36      0.43      -4.84
                          6.93     4.61       2.85      4.60                            0.67      --12.89   2.86     2.25      2.57               -8.46              0.36

                                                                                                                                                                             Annual
                                                                                                                                                                Annualized Standard
                          1997     1998     1999     2000      2001    2002     2003       2004      2005   2006    2007      2008     2009     2010       2011    Return Deviation

   Equity                17.86    11.45    14.89     5.03      0.67   -12.89   20.84      13.58     11.93   22.78   -8.46   -29.97    24.74     14.43      -4.84          5.66      15.27

   Aggressive            14.83    10.48    12.82     5.10      1.59    -9.77   17.32      11.31     10.02   19.00   -5.98   -24.08    19.94     11.66      -3.57          5.31      12.31

   Normal                11.81     9.30    10.76     5.14      2.42    -6.68   13.75       9.05      8.12   15.22   -3.47   -17.88    15.09      8.87      -2.37          4.86       9.31

   Moderate               8.80     7.92     8.70     5.17      3.16    -3.62   10.15       6.78      6.25   11.44   -0.92   -11.38    10.20      6.07      -1.22          4.31       6.29

   Conservative           5.82     6.35     6.64     5.18      3.81    -0.60     6.51      4.51      4.40    7.68    1.66    -4.57     5.29      3.25      -0.13          3.67       3.34

   Fixed                  2.85     4.60     4.59     5.17      4.36     2.39     2.86      2.25      2.57    3.93    4.27     2.56     0.36      0.43       0.90          2.93       1.55


Assumes all strategies have been rebalanced quarterly. In CAD.
The S&P data are provided by Standard & Poor’s Index Services Group. Fama/French data provided by Fama/French. International Small Cap data compiled by Dimensional from Bloomberg,
StyleResearch, London Business School, and Nomura Securities data. MSCI data copyright MSCI 2012, all rights reserved; see MSCI disclosure page for additional information. The Merrill Lynch indices
are used with permission; copyright 2012 Merrill Lynch, Pierce, Fenner & Smith Incorporated; all rights reserved. Barclays Capital data, formerly Lehman Brothers, provided by Barclays Bank PLC.
The returns and other characteristics of the allocation mixes contained in this presentation are based on model/back-tested simulations to demonstrate broad economic principles. They were achieved
with the benefit of hindsight and do not represent actual investment performance. There are limitations inherent in model performance; it does not reflect trading in actual accounts and may not reflect the
impact that economic and market factors may have had on an advisor’s decision making if the advisor were managing actual client money. Model performance is hypothetical and is for illustrative
purposes only. Model performance shown includes reinvestment of dividends and other earnings but does not reflect the deduction of investment advisory fees or other expenses. Clients’ investment
returns would be reduced by the advisory fees and other expenses they would incur in the management of their accounts. Indexes are not available for direct investment. Index performance does not
reflect the expenses associated with the management of an actual portfolio. Past performance is not a guarantee of future results. Not to be construed as investment advice.                S1035.9

More Related Content

Similar to The randomness of_returns

club-asteria income plan
club-asteria income planclub-asteria income plan
club-asteria income plan
smartatul
 
SPX (1990-2012) - Long Straddle, Strangle & Deep OTM
SPX (1990-2012) - Long Straddle, Strangle & Deep OTMSPX (1990-2012) - Long Straddle, Strangle & Deep OTM
SPX (1990-2012) - Long Straddle, Strangle & Deep OTM
Stefan Bolta
 
2016 12 31 - Annual Market Returns - Colour Coded
2016 12 31 - Annual Market Returns - Colour Coded2016 12 31 - Annual Market Returns - Colour Coded
2016 12 31 - Annual Market Returns - Colour Coded
Richard Philbin
 
Kerala livsetock trend state planning board 1966 to 2007
Kerala livsetock trend state planning board 1966 to 2007Kerala livsetock trend state planning board 1966 to 2007
Kerala livsetock trend state planning board 1966 to 2007
People's Archive of Rural India
 
Historical performance april 2011
Historical performance april 2011Historical performance april 2011
Historical performance april 2011
gchawla
 
Sip _ready_reckoner___compliance_approved
Sip  _ready_reckoner___compliance_approvedSip  _ready_reckoner___compliance_approved
Sip _ready_reckoner___compliance_approved
guestc7ba7d90
 

Similar to The randomness of_returns (20)

Simplified Sensex
Simplified SensexSimplified Sensex
Simplified Sensex
 
Useful engineering data
Useful engineering dataUseful engineering data
Useful engineering data
 
Chi squire test
Chi squire testChi squire test
Chi squire test
 
The growth of Real Estate
The growth of Real Estate The growth of Real Estate
The growth of Real Estate
 
GOLD
GOLDGOLD
GOLD
 
DOW
DOWDOW
DOW
 
club-asteria income plan
club-asteria income planclub-asteria income plan
club-asteria income plan
 
Oferta hídrica
Oferta hídricaOferta hídrica
Oferta hídrica
 
Gsom1
Gsom1Gsom1
Gsom1
 
SPX (1990-2012) - Long Straddle, Strangle & Deep OTM
SPX (1990-2012) - Long Straddle, Strangle & Deep OTMSPX (1990-2012) - Long Straddle, Strangle & Deep OTM
SPX (1990-2012) - Long Straddle, Strangle & Deep OTM
 
2016 12 31 - Annual Market Returns - Colour Coded
2016 12 31 - Annual Market Returns - Colour Coded2016 12 31 - Annual Market Returns - Colour Coded
2016 12 31 - Annual Market Returns - Colour Coded
 
Kerala livsetock trend state planning board 1966 to 2007
Kerala livsetock trend state planning board 1966 to 2007Kerala livsetock trend state planning board 1966 to 2007
Kerala livsetock trend state planning board 1966 to 2007
 
I has a money puppy
I has a money puppyI has a money puppy
I has a money puppy
 
EPF Fund Performance
EPF Fund PerformanceEPF Fund Performance
EPF Fund Performance
 
Historical performance april 2011
Historical performance april 2011Historical performance april 2011
Historical performance april 2011
 
Sta iluu
Sta iluuSta iluu
Sta iluu
 
Sip _ready_reckoner___compliance_approved
Sip  _ready_reckoner___compliance_approvedSip  _ready_reckoner___compliance_approved
Sip _ready_reckoner___compliance_approved
 
Kedia april commodity seasonality report
Kedia april commodity seasonality reportKedia april commodity seasonality report
Kedia april commodity seasonality report
 
Kurva s m-32
Kurva s m-32Kurva s m-32
Kurva s m-32
 
Midterm grades
Midterm gradesMidterm grades
Midterm grades
 

More from Atlantis Financial Inc (10)

1st Quarter 2014 Performance of the Global 60 Equity -40 Fixed Income
1st Quarter 2014 Performance of the Global 60 Equity -40 Fixed Income1st Quarter 2014 Performance of the Global 60 Equity -40 Fixed Income
1st Quarter 2014 Performance of the Global 60 Equity -40 Fixed Income
 
Quarterly Investment Update: First Quarter 2014 Dimensional Fund Advisors
Quarterly Investment Update: First Quarter 2014  Dimensional Fund AdvisorsQuarterly Investment Update: First Quarter 2014  Dimensional Fund Advisors
Quarterly Investment Update: First Quarter 2014 Dimensional Fund Advisors
 
World market capitalization
World market capitalizationWorld market capitalization
World market capitalization
 
Missing opportunity
Missing opportunityMissing opportunity
Missing opportunity
 
Distribution of the_us_market_returns
Distribution of the_us_market_returnsDistribution of the_us_market_returns
Distribution of the_us_market_returns
 
Bull and bear_markets
Bull and bear_marketsBull and bear_markets
Bull and bear_markets
 
Value stocks vs large stocks
Value stocks vs large stocksValue stocks vs large stocks
Value stocks vs large stocks
 
2012 matrix book
2012 matrix book2012 matrix book
2012 matrix book
 
The greatest hits of investing
The greatest hits of investingThe greatest hits of investing
The greatest hits of investing
 
Rethink The Way You Invest
Rethink The Way You InvestRethink The Way You Invest
Rethink The Way You Invest
 

The randomness of_returns

  • 1. The Randomness of Returns 1997 1998 1999 2000 2001 2002 2003 2004 2005 2006 2007 2008 2009 2010 2011 Highest Return 40.72 37.81 31.70 36.18 24.88 2.58 36.10 23.47 24.11 35.72 9.82 2.56 68.35 38.09 11.72 39.18 28.62 24.83 28.30 21.56 2.39 31.32 22.49 21.44 29.88 4.27 -21.94 46.22 23.38 4.30 32.20 26.31 24.79 12.24 19.35 -3.63 30.11 17.53 19.56 26.10 3.36 -22.85 35.05 21.50 2.04 28.65 21.65 22.53 7.41 4.36 -3.79 27.83 15.28 10.97 26.08 2.15 -24.94 27.29 17.61 0.90 24.87 18.16 19.52 5.17 1.63 -3.86 26.74 14.47 10.95 23.18 -5.25 -25.55 25.12 16.40 -3.52 14.99 4.74 17.28 1.54 1.05 -12.45 18.85 11.49 10.72 22.11 -7.92 -30.06 13.99 14.53 -5.19 13.77 4.60 13.94 0.24 -6.40 -16.02 13.57 10.98 10.69 18.15 -10.09 -30.67 13.85 10.26 -8.71 6.22 -0.47 4.59 -5.54 -11.56 -16.75 11.60 8.63 4.16 17.25 -10.14 -32.53 10.98 9.16 -10.00 5.95 -1.59 3.48 -7.77 -12.57 -16.77 7.46 8.42 3.05 16.56 -15.63 -33.00 9.26 2.22 -10.26 2.85 -11.05 0.39 -8.82 -13.41 -20.47 5.46 2.80 2.57 15.58 -17.01 -35.24 3.47 0.43 -12.43 Lowest Return -10.82 -21.01 -8.30 -10.80 -16.55 -22.85 2.86 2.25 2.29 3.93 -29.73 -45.71 0.36 -2.14 -13.78 1997 1998 1999 2000 2001 2002 2003 2004 2005 2006 2007 2008 2009 2010 2011 Canadian Fixed Incom e 2.85 4.60 4.59 5.17 4.36 2.39 2.86 2.25 2.57 3.93 4.27 2.56 0.36 0.43 0.90 Canadian Large Cap 14.99 -1.59 31.70 7.41 -12.57 -12.45 26.74 14.47 24.11 17.25 9.82 -33.00 35.05 17.61 -8.71 Canadian Value 28.65 -0.47 3.48 28.30 1.05 -3.63 27.83 17.53 21.44 18.15 2.15 -32.53 46.22 16.40 -5.19 Canadian Small Cap 13.77 -21.01 24.79 1.54 21.56 -3.86 36.10 8.63 10.72 23.18 3.36 -45.71 68.35 38.09 -12.43 US Large Cap 39.18 37.81 13.94 -5.54 -6.40 -22.85 5.46 2.80 2.29 15.58 -10.09 -22.85 9.26 9.16 4.30 US Value 40.72 21.65 0.39 12.24 1.63 -16.02 7.46 8.42 4.16 22.11 -15.63 -21.94 3.47 10.26 2.04 US Sm all Cap 32.20 4.74 24.83 -7.77 24.88 -20.47 30.11 10.98 3.05 16.56 -17.01 -24.94 27.29 23.38 -3.52 US Real Estate 24.87 -11.05 -8.30 36.18 19.35 2.58 11.60 23.47 10.97 35.72 -29.73 -25.55 10.98 21.50 11.72 International Large Cap 6.22 28.62 19.52 -10.80 -16.55 -16.75 13.57 11.49 10.69 26.10 -5.25 -30.67 13.85 2.22 -10.26 International Value 5.95 26.31 17.28 0.24 -13.41 -16.77 18.85 15.28 10.95 29.88 -10.14 -30.06 13.99 -2.14 -10.00 International Sm all Cap -10.82 18.16 22.53 -8.82 -11.56 -3.79 31.32 22.49 19.56 26.08 -7.92 -35.24 25.12 14.53 -13.78 In Canadian dollars. Charts are for illustrative purposes only. Canadian Fixed Income is Canadian One-Month Treasury Bills. Canadian Large Cap is the S&P/TSX Composite Index. Canadian Value is the MSCI Canada IMI Value Index (gross dividends), June 1998–2011; Barra Canada Value Index, January 1997–May 1998. Canadian Small Cap is the MSCI Canada Small Cap Index (gross dividends), January 1999–2011; Barra Canada Small Cap Index, January 1997–December 1998. US Large Cap is the S&P 500 Index. US Value is Russell 3000 Value Index. US Small Cap is CRSP 6-10 Index. US Real Estate is the Dow Jones US Select REIT Index. International Large Cap is the MSCI EAFE Index (net dividends), and International Value is the MSCI EAFE Value Index (net dividends). International Small Cap is compiled by Dimensional from StyleResearch securities data; includes securities of MSCI EAFE countries in the 10%-1% of ME range; market-capitalization weighted; each country capped at 50%; value defined as the top 30% of book-to-market; rebalanced semiannually. Canadian T-bills provided by PC-Bond a business unit of TSX Inc.; copyright © TSX Inc., all rights reserved. MSCI data copyright MSCI 2012, all rights reserved. Canadian Barra data provided by MSCI Barra. The S&P data provided by Standard & Poor’s Index Services Group. Indices are not available for direct investment. Index performance does not reflect the expenses associated with the management of an actual portfolio. Past performance is not a guarantee of future results. S1035.9
  • 2. Sample Portfolios: Allocations Fixed Conservative Moderate Normal Aggressive Equity FIXED INCOME 100% 80% 60% 40% 20% – One-Month T-Bills Canadian One-Month T-Bills 100% 80% 60% 40% 20% – EQUITY – 20% 40% 60% 80% 100% CANADIAN STOCKS – 6% 12% 18% 24% 30% Canadian Large Cap S&P/TSX Composite Index – 2% 4% 6% 8% 10% Canadian Value MSCI Canada Value Index (gross dividends) – 2% 4% 6% 8% 10% Canadian Small Cap MSCI Canada Small Cap Index (price-only) – 2% 4% 6% 8% 10% US STOCKS – 6% 12% 18% 24% 30% US Large Cap S&P 500 Index – 2% 4% 6% 8% 10% US Value Russell 3000 Value Index – 2% 4% 6% 8% 10% US Small Cap CRSP 6-10 Index – 2% 4% 6% 8% 10% INTERNATIONAL STOCKS – 6% 12% 18% 24% 30% International Large Cap MSCI EAFE Index (net dividends) – 2% 4% 6% 8% 10% International Value MSCI EAFE Value Index (net dividends) – 2% 4% 6% 8% 10% International Small Cap International Small Cap Index – 2% 4% 6% 8% 10% REAL ESTATE – 2% 4% 6% 8% 10% Real Estate Dow Jones Wilshire US Select REIT Index – 2% 4% 6% 8% 10% The returns and other characteristics of the allocation mixes contained in this presentation are based on model/back-tested simulations to demonstrate broad economic principles. They were achieved with the benefit of hindsight and do not represent actual investment performance. There are limitations inherent in model performance; it does not reflect trading in actual accounts and may not reflect the impact that economic and market factors may have had on an advisor’s decision making if the advisor were managing actual client money. Model performance is hypothetical and is for illustrative purposes only. Model performance shown includes reinvestment of dividends and other earnings but does not reflect the deduction of investment advisory fees or other expenses. Clients’ investment returns would be reduced by the advisory fees and other expenses they would incur in the management of their accounts. S&P/TSX data provided by S&P/TSX. The S&P data are provided by Standard & Poor's Index Services Group. Russell data copyright © Russell Investment Group 1996-2012, all rights reserved. CRSP data provided by the Center for Research in Security Prices, University of Chicago. MSCI data copyright MSCI 2012, all rights reserved. Dow Jones Wilshire data provided by Dow Jones Indexes. For illustrative purposes only. The balanced strategies are not recommendations for an actual allocation. Indices are not available for direct investment. Index performance does not reflect the expenses associated with the management of an actual portfolio. Past performance is not a guarantee of future results. Not to be construed as investment advice. S1035.9
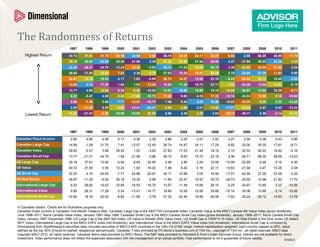
  • 3. Model Portfolio: Historical Returns Annual Return (%) 1997 1998 1999 2000 2001 2002 2003 2004 2005 2006 2007 2008 2009 2010 2011 Highest Return 17.86 11.45 14.89 5.18 4.36 2.39 20.84 13.58 11.93 22.78 4.27 2.56 24.74 14.43 0.90 14.83 10.48 12.82 5.17 3.81 -0.60 17.32 11.31 10.02 19.00 1.66 -4.57 19.94 11.66 -0.13 11.81 9.30 10.76 5.17 3.16 -3.62 13.75 9.05 8.12 15.22 -0.92 -11.38 15.09 8.87 -1.22 8.80 7.92 8.70 5.14 2.42 -6.68 10.15 6.78 6.25 11.44 -3.47 -17.88 10.20 6.07 -2.37 5.82 6.35 6.64 5.10 1.59 -9.77 6.51 4.51 4.40 7.68 -5.98 -24.08 5.29 3.25 -3.57 Lowest Return 2.85 4.60 4.59 5.03 0.67 -12.89 2.86 2.25 2.57 3.93 -8.46 -29.97 0.36 0.43 -4.84 6.93 4.61 2.85 4.60 0.67 --12.89 2.86 2.25 2.57 -8.46 0.36 Annual Annualized Standard 1997 1998 1999 2000 2001 2002 2003 2004 2005 2006 2007 2008 2009 2010 2011 Return Deviation Equity 17.86 11.45 14.89 5.03 0.67 -12.89 20.84 13.58 11.93 22.78 -8.46 -29.97 24.74 14.43 -4.84 5.66 15.27 Aggressive 14.83 10.48 12.82 5.10 1.59 -9.77 17.32 11.31 10.02 19.00 -5.98 -24.08 19.94 11.66 -3.57 5.31 12.31 Normal 11.81 9.30 10.76 5.14 2.42 -6.68 13.75 9.05 8.12 15.22 -3.47 -17.88 15.09 8.87 -2.37 4.86 9.31 Moderate 8.80 7.92 8.70 5.17 3.16 -3.62 10.15 6.78 6.25 11.44 -0.92 -11.38 10.20 6.07 -1.22 4.31 6.29 Conservative 5.82 6.35 6.64 5.18 3.81 -0.60 6.51 4.51 4.40 7.68 1.66 -4.57 5.29 3.25 -0.13 3.67 3.34 Fixed 2.85 4.60 4.59 5.17 4.36 2.39 2.86 2.25 2.57 3.93 4.27 2.56 0.36 0.43 0.90 2.93 1.55 Assumes all strategies have been rebalanced quarterly. In CAD. The S&P data are provided by Standard & Poor’s Index Services Group. Fama/French data provided by Fama/French. International Small Cap data compiled by Dimensional from Bloomberg, StyleResearch, London Business School, and Nomura Securities data. MSCI data copyright MSCI 2012, all rights reserved; see MSCI disclosure page for additional information. The Merrill Lynch indices are used with permission; copyright 2012 Merrill Lynch, Pierce, Fenner & Smith Incorporated; all rights reserved. Barclays Capital data, formerly Lehman Brothers, provided by Barclays Bank PLC. The returns and other characteristics of the allocation mixes contained in this presentation are based on model/back-tested simulations to demonstrate broad economic principles. They were achieved with the benefit of hindsight and do not represent actual investment performance. There are limitations inherent in model performance; it does not reflect trading in actual accounts and may not reflect the impact that economic and market factors may have had on an advisor’s decision making if the advisor were managing actual client money. Model performance is hypothetical and is for illustrative purposes only. Model performance shown includes reinvestment of dividends and other earnings but does not reflect the deduction of investment advisory fees or other expenses. Clients’ investment returns would be reduced by the advisory fees and other expenses they would incur in the management of their accounts. Indexes are not available for direct investment. Index performance does not reflect the expenses associated with the management of an actual portfolio. Past performance is not a guarantee of future results. Not to be construed as investment advice. S1035.9

Editor's Notes

  1. Talking Points: This example features annual performance of major asset classes in the Canadian, US, and international markets between 1996 and 2011. • The top chart ranks the annual returns (from highest to lowest) using the colours that correspond to the asset classes. • The bottom chart displays annual performance by asset class. There is little predictability in asset class performance from one year to the next. Studying the annual data in the slide reveals no obvious pattern in returns that can be exploited for excess profits, strengthening the case for broad diversification across many asset classes.
  2. Talking Points: Investors need portfolios that reflect their different financial goals, time horizons, and risk preferences. Although there is no “perfect” portfolio, many investors will find that a sensible approach incorporates diversification across multiple sources of risk and return. This slide illustrates how various portfolios along the risk/return spectrum (e.g., conservative, moderate, aggressive) might be constructed to capture the equity, size, and value risk premiums in global markets. The more aggressive strategies hold more equity, while the less aggressive strategies hold more fixed income. To simplify the illustration, the relative proportion invested in each component within the equity allocation (large cap, small cap and value) remains consistent. As total equity exposure increases in the portfolios, global diversification is maintained by allocating consistent relative proportions to risk factors in the Canadian, US, and international markets. This exhibit clarifies the proper role of equity and fixed income in a balanced portfolio. Even for the most aggressive investor, broad global diversification across multiple asset classes is desirable. Investors seeking greater safety should allocate a larger fraction to fixed income while maintaining a similar diversified equity exposure.
  3. Talking Points: Asset class returns vary considerably from year to year, and past returns offer little insight into future performance. However, combining multiple asset classes tends to minimize the volatility associated with this random behavior. Global diversification reduces the effect of a single asset class or market. The historical returns chart offers compelling evidence that structured portfolios are a reliable way to capture the returns associated with multiple measures of risk across the global capital markets. The upper chart ranks the year-to-year returns (from highest to lowest) of the model portfolios using the corresponding colors. The lower chart features historical annual performance of the model portfolios over a fifteen-year period, with the far right columns showing annualized returns and standard deviations for the entire period. The dispersion of colors now appears more uniform and consistent, with annual returns based on risk assumed in the model portfolios. This example illustrates how markets tend to reward investors for the risks they bear, with riskier strategies generally offering higher expected returns.