Ipa global publishing statistics
•
2 likes•2,877 views

IPA Global Publishing Statistics Rüdiger Wischenbart

Recommended
Recommended
More Related Content
What's hot
What's hot (20)
Similar to Ipa global publishing statistics
Similar to Ipa global publishing statistics (20)
More from Vincent DEMULIERE
More from Vincent DEMULIERE (20)
Recently uploaded
Recently uploaded (20)
Ipa global publishing statistics
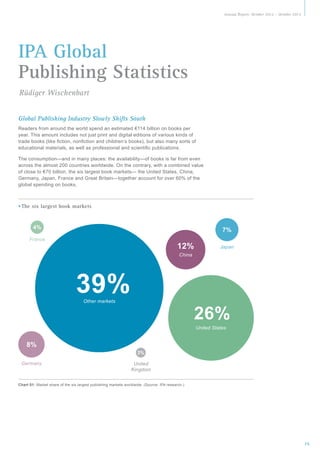
- 1. Annual Report: October 2012 – October 2013 IPA Global Publishing Statistics Rüdiger Wischenbart Global Publishing Industry Slowly Shifts South Readers from around the world spend an estimated €114 billion on books per year. This amount includes not just print and digital editions of various kinds of trade books (like fiction, nonfiction and children’s books), but also many sorts of educational materials, as well as professional and scientific publications. The consumption—and in many places: the availability—of books is far from even across the almost 200 countries worldwide. On the contrary, with a combined value of close to €70 billion, the six largest book markets— the United States, China, Germany, Japan, France and Great Britain—together account for over 60% of the global spending on books. » The six largest book markets 4% 7% France 12% Japan China 39% Other markets 26% United States 8% 3% Germany United Kingdom Chart 01: Market share of the six largest publishing markets worldwide. (Source: IPA research.) 15
- 2. International Publishers Association The 20 Largest Publishing Markets A list of the 20 largest publishing markets therefore highlights complex dynamics between publishing, the general economy and the size of the included countries: Country Year Publishers’ total net revenue (m€) World Total market value at consumer prices (m€) 2012 GDP per capita PPP in US$ (Worldbank) Population 12,189 New titles re-editions per 1m inhabitants 7,046,368,813 114,000 USA 2012 China 2012 Germany 2012 5,407 29,643 1,080 49,965 313,914,040 14,200 20,750 306 9,233 1,350,695,000 9,520 1,115 40,901 81,889,839 Japan 2012 7,878 617 35,178 127,561,489 France 2012 2,771 4,534 1,321 36,104 65,696,689 UK 2012 3,736 3,975 2,459 36,901 63,227,526 Italy 2012 3,072 1,049 33,111 60,917,978 Spain 2011 1,820 2,890 1,692 32,682 46,217,961 1,884 2,810 339 11,909 198,656,019 2,734 1,257 30,801 50,004,000 3,876 1,236,686,732 Brazil 2012 Korea, Rep. 2012 India 2010 1,675 2,500 Canada 2010 1,535 2,342 42,533 34,880,491 Turkey 2012 1,096 1,682 564 18,348 73,997,128 Australia 2011 1,520 877 44,598 22,683,600 Russian Federation 2012 1,494 23,501 143,533,000 Netherlands 2012 1,363 1,412 43,198 16,767,705 Poland 2012 654 1,053 775 22,162 38,542,737 519 Belgium 2011 850 39,788 11,142,157 Switzerland 2011 806 53,367 7,997,152 Norway 2012 743 65,640 5,018,869 Top 20 Publishing Markets 95,609 Other Markets 1,486 18,391 Table 01: The 20 largest publishing markets worldwide, ranked according to domestic market value at consumer prices. (Various sources; research and compilation by IPA. Estimated values in italics.) With a total market value of €95.6 billion, we estimate that the 20 largest publishing markets account for just under 84% of global spending on books. The figures for the United Kingdom show how, a comparative ranking of markets sometimes throws up paradoxes, depending on the metric chosen. In this case, British publishers’ net sales are much closer to the domestic market value at retail prices, due to exceptionally strong exports worth £1,211 million (or €1,480 million). (For a more detailed discussion, see the UK case study below.) Books and publishing thereby closely reflect the evolution of a global knowledge society. Together with access to the Internet and to modern communication networks, published book content is a measure of a country’s or a region’s position in the global commercial exchange of knowledge, which must be seen as the true global currency in the early 21st century. To understand in more detail what publishing and book markets represent, we have started to juxtapose market size to the number of new titles (and re-editions) released per one million inhabitants (as a measure for domestic production), and to the GDP per capita (PPP or Purchasing Power Parity) as an indicator of a country’s relative affluence. 16
- 3. Annual Report: October 2012 – October 2013 The Rise of Emerging Markets in Global Publishing Over the past decade, several new centres of gravity for global publishing have emerged. The demand for books and educational material reflect overall economic growth patterns with remarkable precision. » Share of global publishing industry, by region A Global Digital Expansion 18% 33% BRIC countries European Union 22% 26% USA Rest of the World Chart 02: Market share in global publishing industry of selected regions, at consumer value. (Source: IPA research.) China alone, by now the second largest publishing market worldwide, accounts for more than half of the BRIC countries’ global market share (to be exact, over 12% of global publishing). The Chinese publishing industry is expected to grow further, driven by domestic consumption and the aspiration for a better education of the expanding middle class in China’s large urban regions. Meanwhile, other BRIC countries, notably Brazil, have recently hinted that the expansion of their book sectors could be coming to an end. Such growth patterns—including an eventual a slow-down in publishing, in accordance with overall development—can be observed in several other countries after stupendous recent growth, notably in Turkey and Mexico, as we will show in case studies, below. Unfortunately, for some of the most dynamic markets—for example India or Korea—a continuous overview of trends and developments is almost impossible due to gaps in availability of reliable data. In 2012, e-books worth US$3.5 billion were sold in the United States, equalling 13% of all publishers’ combined net sales. In the United Kingdom, digital revenues were worth £411 million, as compared to £2,932 million for sales of physical books. In a largely mature publishing market which has seen declining revenues in recent years, digital sales clearly helped balance the losses in revenue from printed books for the first time in the UK in 2012. This is even more remarkable as e-books only started to gain significant market share in North America and Great Britain as recently as 2010. The music industry, by comparison, had to wait much longer before digital sales (by rising to 34% of income) helped to tip the overall market into new growth for the first time in over a decade in 2012. No other markets can boast comparable market share for digital publishing as the US and the UK. But in contrast to trade (or general consumer) publishing, other sectors of the industry have already largely and successfully completed their digital migration. Leading companies in scientific, technical and medical publishing (STM) as well as professional publishing, today get over 80% of their revenues from digital. Educational publishing is now closely replicating this pattern, driven particularly by strategic government programs in both developed and emerging economies. 17
- 4. International Publishers Association Publishing Plays a Particularly Strong Role in Global Media and Entertainment In the global publishing, media and entertainment industries—in total, worth over US$1,000 billion—books account for 15% of the value. » Share of publishing in the media and entertainment industries (2012) Publishing (Trade + Education + STM) 11% 17% 15% 6% Magazines Video Games TV Subscriptions 13% 5% 16% 17% Movies Entertainment TV Advertising Music Newspapers US$ Share in % Source1 TV Subscriptions $172 17% PwC Global Entertainment and Media Outlook 2013 - 2017 Newspapers $170 17% IbisWorld, Global Newspaper Publishing industry TV Advertising $162 16% PwC Global Entertainment and Media Outlook 2013 - 2017 Publishing (Trade + Education + STM) $151 15% IPA (RW): Global Publishing Markets 2013 Movies Entertainment* $133 13% Lucintel, Global Movie and Entertainment Industry 2012-2017: Trends, Profits and Forecast Analysis Magazines $107 11% Lucintel, Global Magazine Publishing Industry 2013-2018: Trend, Profit, and Forecast Analysis Video games $63 6% PwC Global Entertainment and Media Outlook 2013 - 2017 Music $50 5% PwC Global Entertainment and Media Outlook 2013 - 2017 $1,008 100% Total publishing, media entertainment * broader definition than PwC Book Publishing (Trade + Edu) 112 IPA (RW) Book Publishing (Trade + Edu) 104 PwC Global Entertainment and Media Outlook: 2013-2017 Recorded music (net industry sales, not market value; excl. Live revenues) 16.5 IFPI Filmed Entertainment 106 PwC Global Entertainment and Media Outlook: 2013-2017 Table 02, Chart 03: Consumer spending on TV, filmed entertainment, video games, music, and all sectors of publishing. (Various sources, compiled by IPA/RW) 1 Research from various sources, and IPA/RW research for book publishing, including the following: • wC Global Entertainment and Media Outlook: 2013-2017, www.pwc.com/outlook P • ucintel (Movies entertainment) - http://www.researchandmarkets.com/reports/2172264/global_movie_and_entertainment_industry L • ucintel (Magazines) - http://www.prweb.com/releases/2013/3/prweb10565084.htm L • bisWorld (Newspaper) - http://www.prweb.com/releases/2013/6/prweb10834034.htm I 18
- 5. Annual Report: October 2012 – October 2013 Among entertainment products, book publishing is clearly the largest industry, equalling roughly three times the turnover of the global music industry, and almost 14% more than the value of global movies and entertainment. » Publishing and entertainment media (bn US$, 2012) $50 $107 $63 Video games Magazines $15 1 Music $133 Movies Entertainment Publishing (Trade + Education + STM) US$ bn Source2 Publishing (Trade + Education + STM) 151 IPA (RW): Global Publishing Markets 2013 Movies Entertainment 133 Lucintel, Global Movie and Entertainment Industry 2012-2017: Trends, Profits and Forecast Analysis Magazines 107 Lucintel, Global Magazine Publishing Industry 2013-2018: Trend, Profit, and Forecast Analysis Video games 63 PwC Global Entertainment and Media Outlook 2013 - 2017 Music 50 PwC Global Entertainment and Media Outlook 2013 - 2017 Total 504 Table 03, Chart 04: Market share of book publishing, as compared to filmed entertainment, video games and music (Various sources, IPA/RW research) 2 Research from various sources, and IPA/RW research for book publishing, including the following: • wC Global Entertainment and Media Outlook: 2013-2017, www.pwc.com/outlook P • ucintel (Movies entertainment) - http://www.researchandmarkets.com/reports/2172264/global_movie_and_entertainment_industry L • ucintel (Magazines) - http://www.prweb.com/releases/2013/3/prweb10565084.htm L 19
- 6. International Publishers Association Case Studies and Close Ups Comparing Complex Developments: Mature Versus Emerging Economies In Publishing A comparison of mature book markets from across Europe, plus the United States, clearly shows how most European markets recently suffered the consequences of the economic crisis of 2008, while the US market experienced a recovery largely driven by the recent strong expansion of its e-book market segment. 6% 4% 2% 0% -2% -4% -6% -8% -10% -12% -14% -16% Sweden Italy Finland 2009 10 -1% 0% -3% 2010 11 3% -3% 0% 2011 12 -14% -7% -5% Poland Belgium France Germany Norway US 1% 0% 0% -2% 3% -6% 0% -1% -1% -1% -3% -3% -2% -1% -1% -1% 3% Chart 05: Selected mature markets: Relative annual growth or decline between 2009 and 2012, in local currencies, in %. (Sources: Various national statistics.) The picture is significantly different for selected emerging economies, where growth had been much more vibrant, before a harsh slowdown hit in 2012. 25% 20% 15% 10% 5% 0% -5% Brazil Mexico Turkey 2009 10 8% 8% 11% 2010 11 7% 13% 20% 2011 12 3% -3% Chart 06: Selected emerging economies: Relative annual growth or decline between 2009 and 2012, in local currencies, in %. (Sources: Various national statistics.) 20
- 7. Annual Report: October 2012 – October 2013 The United Kingdom: The Role of Digital and Exports The US example highlights how the evolution of an e-book market can make good for lost ground in print once e-books have evolved beyond their very early stages.3 Recent numbers from the United Kingdom showcase some remarkable details: 80% 70% 60% 50% 40% 30% 20% 10% 0% -10% UK physical UK digital UK p+e combined 2009 10 2% 39% 3% 2010 11 -5% 54% -2% 2011 12 -1% 69% 4% Chart 07: Evolution of print and digital in the United Kingdom. (Source: The Publishers Association.) In these UK figures, we see a declining print book market being counter-balanced by e-book sales, resulting in overall growth in 2012, as compared to 2011. Also, the United Kingdom example is even more relevant as it allows us to show the impact of exports. The UK is traditionally one of the strongest exporting markets for several sectors in the cultural industries, and notably for books. Analysing the total value created by the UK book industry in 2012 reveals that exports (£1,211 million) were a particularly significant portion of the £2933 million generated in overall net sales, plus another £1254 million coming from digital domestic revenues. 2012 (m£) UK domestic print sales UK domestic digital sales 1,721 125 UK exports 1,211 Total 3,057 Table 04: British publishers’ value creation. (Source: The Publishers Association.) Overall the UK publishing industry clearly stands out among all international markets by virtue of the important share of overall revenue generated by both digital sales and exports. The Data Challenge This report looks at an old cultural industry—rich in traditions and characterized by deep regional differences— from a truly global perspective. Its ambition is to collect existing data from a wide array of sources, always aiming to identify the best and most reliable statistics, retrieving the information either directly from local professional and government organizations, or, as a secondbest choice, from authoritative professional publications. In many cases, we have had detailed discussions with those local information providers, aiming at a well-founded understanding of what their data represent. With standardized definitions missing even for the most basic identifiers—such as what is included under the term ‘book publishing’, and what needs to be excluded (e.g. newspapers and magazines)—the International Publishers Association has begun a process engaging with its members to define a set of basic identifiers. A working group was established in 2012, with members representing both professional trade and commercial market research organizations to oversee best practices and provide valuable conceptual as well as technical advice. All research has been conducted by Rüdiger Wischenbart and his team at ‘Content and Consulting’. Still, users of this report should be aware of the complexities and uncertainties involved, and their critical feedback is therefore highly encouraged. Contacts: secretariat@ internationalpublishers.org ruediger@wischenbart.com 3 All data as reported by the UK Publishers Association in ‘The UK Book Publishing Industry in Statistics 2012’, www.publishers.org.uk 4 The total digital revenues of £411 million in 2012 includes digital exports. Domestic digital sales account for £125 million. Clarification by PA, for this report. 21