SlideShare a Scribd company logo
1 of 12
Reaching Price to Sales Ratio of: 7.9
Desired Annualized Return of 8%
Total Years
Holding Stock
Annual Sales:
Constant Share
Price
Annual
Growth for
Constant Price
Sales to Return
8% per Year
Annual
Growth for 8%
Return
1 $106.40 300.00% $114.91 332.00%
3 $106.40 58.74% $131.94 70.54%
5 $106.40 31.95% $148.96 41.14%
7 $106.40 21.90% $165.98 29.90%
10 $106.40 14.87% $191.52 21.82%
Reaching Price to Sales Ratio of: 7.9
Desired Annualized Return of 10%
Total Years
Holding Stock
Annual Sales:
Constant Share
Price
Annual
Growth for
Constant Price
Sales to Return
10% per Year
Annual
Growth for
10% Return
1 $106.40 300.00% $117.04 340.00%
3 $106.40 58.74% $138.32 73.25%
5 $106.40 31.95% $159.60 43.10%
7 $106.40 21.90% $180.88 31.50%
10 $106.40 14.87% $212.80 23.11%
Reaching Price to Sales Ratio of: 7.9
Desired Annualized Return of 12%
Total Years
Holding Stock
Annual Sales:
Constant Share
Price
Annual
Growth for
Constant Price
Sales to Return
12% per Year
Annual
Growth for
12% Return
1 $106.40 300.00% $119.17 348.00%
3 $106.40 58.74% $144.70 75.87%
5 $106.40 31.95% $170.24 44.96%
7 $106.40 21.90% $195.78 33.00%
10 $106.40 14.87% $234.08 24.29%
Reaching Price to Sales Ratio of: 7.9
Desired Annualized Return of 15%
Total Years
Holding Stock
Annual Sales:
Constant Share
Price
Annual
Growth for
Constant Price
Sales to Return
15% per Year
Annual
Growth for
15% Return
1 $106.40 300.00% $122.36 360.00%
3 $106.40 58.74% $154.28 79.67%
5 $106.40 31.95% $186.20 47.58%
7 $106.40 21.90% $218.12 35.07%
10 $106.40 14.87% $266.00 25.89%
Reaching Price to Sales Ratio of: 4.7
Desired Annualized Return of 8%
Total Years
Holding Stock
Annual Sales:
Constant Share
Price
Annual
Growth to
Break Even
Sales to Return
15% per Year
Annual
Growth for
15% Return
1 $106.40 300.00% $122.36 360.00%
3 $106.40 58.74% $154.28 79.67%
5 $106.40 31.95% $186.20 47.58%
7 $106.40 21.90% $218.12 35.07%
10 $106.40 14.87% $266.00 25.89%
Total Years
Holding Stock
Annual Sales:
Constant Share
Price
Annual
Growth for
Constant Price
Sales to Return
8% per Year
Annual
Growth for
8% Return
1 $ 177.33 566.67% $ 191.52 620.00%
3 $ 177.33 88.21% $ 219.89 102.20%
5 $ 177.33 46.14% $ 248.27 56.32%
7 $ 177.33 31.13% $ 276.64 39.73%
10 $ 177.33 20.89% $ 319.20 28.21%
Reaching Price to Sales Ratio of: 4.7
Desired Annualized Return of 10%
Total Years
Holding Stock
Annual Sales:
Constant Share
Price
Annual
Growth to
Break Even
Sales to Return
15% per Year
Annual
Growth for
15% Return
1 $106.40 300.00% $122.36 360.00%
3 $106.40 58.74% $154.28 79.67%
5 $106.40 31.95% $186.20 47.58%
7 $106.40 21.90% $218.12 35.07%
10 $106.40 14.87% $266.00 25.89%
Total Years
Holding Stock
Annual Sales:
Constant Share
Price
Annual
Growth for
Constant Price
Sales to Return
10% per Year
Annual
Growth for
10% Return
1 $ 177.33 566.67% $ 195.07 633.33%
3 $ 177.33 88.21% $ 230.53 105.41%
5 $ 177.33 46.14% $ 266.00 58.49%
7 $ 177.33 31.13% $ 301.47 41.46%
10 $ 177.33 20.89% $ 354.67 29.57%
Reaching Price to Sales Ratio of: 4.7
Desired Annualized Return of 12%
Total Years
Holding Stock
Annual Sales:
Constant Share
Price
Annual
Growth to
Break Even
Sales to Return
15% per Year
Annual
Growth for
15% Return
1 $106.40 300.00% $122.36 360.00%
3 $106.40 58.74% $154.28 79.67%
5 $106.40 31.95% $186.20 47.58%
7 $106.40 21.90% $218.12 35.07%
10 $106.40 14.87% $266.00 25.89%
Total Years
Holding Stock
Annual Sales:
Constant Share
Price
Annual
Growth for
Constant Price
Sales to Return
12% per Year
Annual
Growth for
12% Return
1 $177.33 566.67% $198.61 646.67%
3 $177.33 88.21% $241.17 108.52%
5 $177.33 46.14% $283.73 60.55%
7 $177.33 31.13% $326.29 43.06%
10 $177.33 20.89% $390.13 30.81%
Reaching Price to Sales Ratio of: 4.7
Desired Annualized Return of 15%
Total Years
Holding Stock
Annual Sales:
Constant Share
Price
Annual
Growth to
Break Even
Sales to Return
15% per Year
Annual
Growth for
15% Return
1 $106.40 300.00% $122.36 360.00%
3 $106.40 58.74% $154.28 79.67%
5 $106.40 31.95% $186.20 47.58%
7 $106.40 21.90% $218.12 35.07%
10 $106.40 14.87% $266.00 25.89%
Total Years
Holding Stock
Annual Sales:
Constant Share
Price
Annual
Growth for
Constant Price
Sales to Return
15% per Year
Annual
Growth for
15% Return
1 $177.33 566.67% $203.93 666.67%
3 $177.33 88.21% $257.13 113.02%
5 $177.33 46.14% $310.33 63.45%
7 $177.33 31.13% $363.53 45.29%
10 $177.33 20.89% $443.33 32.49%
Reaching Price to Sales Ratio of: 1.7 (S&P Avg.)
Desired Annualized Return of 8%
Total Years
Holding Stock
Annual Sales:
Constant Share
Price
Annual
Growth to
Break Even
Sales to Return
15% per Year
Annual
Growth for
15% Return
1 $106.40 300.00% $122.36 360.00%
3 $106.40 58.74% $154.28 79.67%
5 $106.40 31.95% $186.20 47.58%
7 $106.40 21.90% $218.12 35.07%
10 $106.40 14.87% $266.00 25.89%
Total Years
Holding Stock
Annual Sales:
Constant Share
Price
Annual
Growth for
Constant Price
Sales to Return
8% per Year
Annual
Growth for
8% Return
1 $458.83 1624.94% $495.54 1762.93%
3 $458.83 158.38% $568.95 177.59%
5 $458.83 76.75% $642.37 89.05%
7 $458.83 50.20% $715.78 60.06%
10 $458.83 32.95% $825.90 41.00%
Reaching Price to Sales Ratio of: 1.7 (S&P Avg.)
Desired Annualized Return of 10%
Total Years
Holding Stock
Annual Sales:
Constant Share
Price
Annual
Growth to
Break Even
Sales to Return
15% per Year
Annual
Growth for
15% Return
1 $106.40 300.00% $122.36 360.00%
3 $106.40 58.74% $154.28 79.67%
5 $106.40 31.95% $186.20 47.58%
7 $106.40 21.90% $218.12 35.07%
10 $106.40 14.87% $266.00 25.89%
Total Years
Holding Stock
Annual Sales:
Constant Share
Price
Annual
Growth for
Constant Price
Sales to Return
10% per Year
Annual
Growth for
10% Return
1 $458.83 1624.94% $504.72 1797.43%
3 $458.83 158.38% $596.48 181.99%
5 $458.83 76.75% $688.25 91.68%
7 $458.83 50.20% $780.02 62.03%
10 $458.83 32.95% $917.67 42.49%
Desired Annualized Return of 12%
Total Years
Holding Stock
Annual Sales:
Constant Share
Price
Annual
Growth to
Break Even
Sales to Return
15% per Year
Annual
Growth for
15% Return
1 $106.40 300.00% $122.36 360.00%
3 $106.40 58.74% $154.28 79.67%
5 $106.40 31.95% $186.20 47.58%
7 $106.40 21.90% $218.12 35.07%
10 $106.40 14.87% $266.00 25.89%
Total Years
Holding Stock
Annual Sales:
Constant Share
Price
Annual
Growth for
Constant Price
Sales to Return
12% per Year
Annual
Growth for
12% Return
1 $458.83 1624.94% $513.89 1831.93%
3 $458.83 158.38% $624.01 186.27%
5 $458.83 76.75% $734.13 94.17%
7 $458.83 50.20% $844.25 63.88%
10 $458.83 32.95% $1,009.43 43.85%
Reaching Price to Sales Ratio of: 1.7 (S&P Avg.)
Desired Annualized Return of 15%
Total Years
Holding Stock
Annual Sales:
Constant Share
Price
Annual
Growth to
Break Even
Sales to Return
15% per Year
Annual
Growth for
15% Return
1 $106.40 300.00% $122.36 360.00%
3 $106.40 58.74% $154.28 79.67%
5 $106.40 31.95% $186.20 47.58%
7 $106.40 21.90% $218.12 35.07%
10 $106.40 14.87% $266.00 25.89%
Total Years
Holding Stock
Annual Sales:
Constant Share
Price
Annual
Growth for
Constant Price
Sales to Return
15% per Year
Annual
Growth for
15% Return
1 $458.83 1624.94% $527.66 1883.68%
3 $458.83 158.38% $665.31 192.45%
5 $458.83 76.75% $802.96 97.68%
7 $458.83 50.20% $940.61 66.42%
10 $458.83 32.95% $1,147.08 45.70%
Reaching Price to Sales Ratio of: 1.7 (S&P Avg.)

More Related Content

What's hot

Decade 2000 Return Comparison
Decade 2000 Return ComparisonDecade 2000 Return Comparison
Decade 2000 Return ComparisonMatthew Sammut
 
January 2017 USPS® Rate Change Comparison Guide
January 2017 USPS® Rate Change Comparison GuideJanuary 2017 USPS® Rate Change Comparison Guide
January 2017 USPS® Rate Change Comparison GuidePostal Advocate Inc.
 
Analysis of S&P500 financial sector
Analysis of S&P500 financial sectorAnalysis of S&P500 financial sector
Analysis of S&P500 financial sectorJean. G. Ndoutoum
 
January 2018 USPS® Rate Change Comparison Grid
January 2018 USPS® Rate Change Comparison GridJanuary 2018 USPS® Rate Change Comparison Grid
January 2018 USPS® Rate Change Comparison GridPostal Advocate Inc.
 
Attendance 15th may
Attendance 15th mayAttendance 15th may
Attendance 15th maymaggiebarton
 
Okanagan Real Estate Statistics Package - September 2021
Okanagan Real Estate Statistics Package - September 2021Okanagan Real Estate Statistics Package - September 2021
Okanagan Real Estate Statistics Package - September 2021VickyAulakh1
 
Boston Real Estate Sales 1stQ 2019 Stats Report
Boston Real Estate Sales 1stQ 2019 Stats ReportBoston Real Estate Sales 1stQ 2019 Stats Report
Boston Real Estate Sales 1stQ 2019 Stats ReportFRANKLIN KNOTTS
 
April 2011 final stats
April 2011 final statsApril 2011 final stats
April 2011 final statsDoreen At Work
 
January 2019 USPS Rates Increase Webinar Presentation
January 2019 USPS Rates Increase Webinar PresentationJanuary 2019 USPS Rates Increase Webinar Presentation
January 2019 USPS Rates Increase Webinar PresentationPostal Advocate Inc.
 

What's hot (12)

Houston Market Report August 2010
Houston Market Report August 2010Houston Market Report August 2010
Houston Market Report August 2010
 
Decade 2000 Return Comparison
Decade 2000 Return ComparisonDecade 2000 Return Comparison
Decade 2000 Return Comparison
 
Houston Market Report January 2010
Houston Market Report January 2010Houston Market Report January 2010
Houston Market Report January 2010
 
Houston Market Report February 2010
Houston Market Report February 2010Houston Market Report February 2010
Houston Market Report February 2010
 
January 2017 USPS® Rate Change Comparison Guide
January 2017 USPS® Rate Change Comparison GuideJanuary 2017 USPS® Rate Change Comparison Guide
January 2017 USPS® Rate Change Comparison Guide
 
Analysis of S&P500 financial sector
Analysis of S&P500 financial sectorAnalysis of S&P500 financial sector
Analysis of S&P500 financial sector
 
January 2018 USPS® Rate Change Comparison Grid
January 2018 USPS® Rate Change Comparison GridJanuary 2018 USPS® Rate Change Comparison Grid
January 2018 USPS® Rate Change Comparison Grid
 
Attendance 15th may
Attendance 15th mayAttendance 15th may
Attendance 15th may
 
Okanagan Real Estate Statistics Package - September 2021
Okanagan Real Estate Statistics Package - September 2021Okanagan Real Estate Statistics Package - September 2021
Okanagan Real Estate Statistics Package - September 2021
 
Boston Real Estate Sales 1stQ 2019 Stats Report
Boston Real Estate Sales 1stQ 2019 Stats ReportBoston Real Estate Sales 1stQ 2019 Stats Report
Boston Real Estate Sales 1stQ 2019 Stats Report
 
April 2011 final stats
April 2011 final statsApril 2011 final stats
April 2011 final stats
 
January 2019 USPS Rates Increase Webinar Presentation
January 2019 USPS Rates Increase Webinar PresentationJanuary 2019 USPS Rates Increase Webinar Presentation
January 2019 USPS Rates Increase Webinar Presentation
 

Viewers also liked

Flaring in the Bakken
Flaring in the BakkenFlaring in the Bakken
Flaring in the BakkenTyler Crowe
 
Recreatie weerapp powerpoint (1)
Recreatie weerapp powerpoint (1)Recreatie weerapp powerpoint (1)
Recreatie weerapp powerpoint (1)Jan-Willem Schimmel
 
Windows storeaccessthroughdreamspark guide
Windows storeaccessthroughdreamspark guideWindows storeaccessthroughdreamspark guide
Windows storeaccessthroughdreamspark guideAnette n?gaard
 
Vooruitblik Marco van Dorst - bijeenkomst gemeente Sluis dd 17 februari 2011
Vooruitblik Marco van Dorst - bijeenkomst gemeente Sluis dd 17 februari 2011Vooruitblik Marco van Dorst - bijeenkomst gemeente Sluis dd 17 februari 2011
Vooruitblik Marco van Dorst - bijeenkomst gemeente Sluis dd 17 februari 2011nu2021
 
Incident management linkedin
Incident management linkedinIncident management linkedin
Incident management linkedinQualityonline
 
Presentatie SCOOP tijdens WoOn2009 congres
Presentatie SCOOP tijdens WoOn2009 congresPresentatie SCOOP tijdens WoOn2009 congres
Presentatie SCOOP tijdens WoOn2009 congresnu2021
 
Project report on fundamental analysis of scrips under banking sector
Project report on fundamental analysis of scrips under banking sectorProject report on fundamental analysis of scrips under banking sector
Project report on fundamental analysis of scrips under banking sectoraftabshaikh04
 
Periodontal disease and pregnancy
Periodontal disease and pregnancyPeriodontal disease and pregnancy
Periodontal disease and pregnancyDentaid
 
Workshop Springer - Tunisia
Workshop Springer - TunisiaWorkshop Springer - Tunisia
Workshop Springer - TunisiaBessem Aamira
 
Nu2021.nl - presentatie Marco van Dorst, ronde 3
Nu2021.nl - presentatie Marco van Dorst, ronde 3Nu2021.nl - presentatie Marco van Dorst, ronde 3
Nu2021.nl - presentatie Marco van Dorst, ronde 3nu2021
 

Viewers also liked (12)

Flaring in the Bakken
Flaring in the BakkenFlaring in the Bakken
Flaring in the Bakken
 
Slg bmi 30 35
Slg bmi 30 35Slg bmi 30 35
Slg bmi 30 35
 
Recreatie weerapp powerpoint (1)
Recreatie weerapp powerpoint (1)Recreatie weerapp powerpoint (1)
Recreatie weerapp powerpoint (1)
 
Windows storeaccessthroughdreamspark guide
Windows storeaccessthroughdreamspark guideWindows storeaccessthroughdreamspark guide
Windows storeaccessthroughdreamspark guide
 
Vooruitblik Marco van Dorst - bijeenkomst gemeente Sluis dd 17 februari 2011
Vooruitblik Marco van Dorst - bijeenkomst gemeente Sluis dd 17 februari 2011Vooruitblik Marco van Dorst - bijeenkomst gemeente Sluis dd 17 februari 2011
Vooruitblik Marco van Dorst - bijeenkomst gemeente Sluis dd 17 februari 2011
 
Incident management linkedin
Incident management linkedinIncident management linkedin
Incident management linkedin
 
Presentatie SCOOP tijdens WoOn2009 congres
Presentatie SCOOP tijdens WoOn2009 congresPresentatie SCOOP tijdens WoOn2009 congres
Presentatie SCOOP tijdens WoOn2009 congres
 
Aalborg newbiz2013
Aalborg newbiz2013Aalborg newbiz2013
Aalborg newbiz2013
 
Project report on fundamental analysis of scrips under banking sector
Project report on fundamental analysis of scrips under banking sectorProject report on fundamental analysis of scrips under banking sector
Project report on fundamental analysis of scrips under banking sector
 
Periodontal disease and pregnancy
Periodontal disease and pregnancyPeriodontal disease and pregnancy
Periodontal disease and pregnancy
 
Workshop Springer - Tunisia
Workshop Springer - TunisiaWorkshop Springer - Tunisia
Workshop Springer - Tunisia
 
Nu2021.nl - presentatie Marco van Dorst, ronde 3
Nu2021.nl - presentatie Marco van Dorst, ronde 3Nu2021.nl - presentatie Marco van Dorst, ronde 3
Nu2021.nl - presentatie Marco van Dorst, ronde 3
 

Similar to Plug valuation

Eastman Chemical Company
Eastman Chemical CompanyEastman Chemical Company
Eastman Chemical CompanyFranklin Monzon
 
Retail Merchandise Management Final Project- 6 Month Buying Plan
Retail Merchandise Management Final Project- 6 Month Buying PlanRetail Merchandise Management Final Project- 6 Month Buying Plan
Retail Merchandise Management Final Project- 6 Month Buying PlanAdrianQuinonesRivas
 
Table 7.7 Comparative Financial Statistics Universal Office Fur.docx
Table 7.7 Comparative Financial Statistics Universal Office Fur.docxTable 7.7 Comparative Financial Statistics Universal Office Fur.docx
Table 7.7 Comparative Financial Statistics Universal Office Fur.docxperryk1
 
Valuation Of Maruti Suzuki
Valuation Of Maruti SuzukiValuation Of Maruti Suzuki
Valuation Of Maruti SuzukiAakash Singh
 
Valuation Of Maruti Suzuki
Valuation Of Maruti SuzukiValuation Of Maruti Suzuki
Valuation Of Maruti SuzukiAakash Singh
 
Convexity(5YEARS)
Convexity(5YEARS)Convexity(5YEARS)
Convexity(5YEARS)XIAOLIN WU
 
2 Effective Strategies to Transform Your Net Profit. FAST.
2 Effective Strategies to Transform Your Net Profit. FAST.2 Effective Strategies to Transform Your Net Profit. FAST.
2 Effective Strategies to Transform Your Net Profit. FAST.Victor Ang
 
P'Kolino Case Study
P'Kolino Case StudyP'Kolino Case Study
P'Kolino Case Study楹翔 張
 
Amazon Fresh - Mock Financials
Amazon Fresh - Mock FinancialsAmazon Fresh - Mock Financials
Amazon Fresh - Mock FinancialsHelena Lavieri
 
Market watch jul 2019 frank yu oakville
Market watch jul 2019 frank yu oakvilleMarket watch jul 2019 frank yu oakville
Market watch jul 2019 frank yu oakvilleFrank Yu
 
Market watch jul 2019 frank yu oakville
Market watch jul 2019 frank yu oakvilleMarket watch jul 2019 frank yu oakville
Market watch jul 2019 frank yu oakvilleFrank Yu
 
TORONTO REAL ESTATE BOARD'S -- MARKET WATCH - JULY 2019
TORONTO REAL ESTATE BOARD'S -- MARKET WATCH - JULY 2019TORONTO REAL ESTATE BOARD'S -- MARKET WATCH - JULY 2019
TORONTO REAL ESTATE BOARD'S -- MARKET WATCH - JULY 2019Shawn Venasse
 
Edita Financial Analysis
Edita Financial Analysis Edita Financial Analysis
Edita Financial Analysis Abdallah Elngar
 
RR - Technicals 1.pdf
RR - Technicals 1.pdfRR - Technicals 1.pdf
RR - Technicals 1.pdfmerag76668
 
Vera Bradley Final Presentation
Vera Bradley Final PresentationVera Bradley Final Presentation
Vera Bradley Final PresentationBashayer Baljon
 
Round 5Dec. 31, 2018 C58538AndrewsEugene EllisPhili.docx
Round 5Dec. 31, 2018 C58538AndrewsEugene EllisPhili.docxRound 5Dec. 31, 2018 C58538AndrewsEugene EllisPhili.docx
Round 5Dec. 31, 2018 C58538AndrewsEugene EllisPhili.docxjoellemurphey
 
TREB Market Watch for May 2016
TREB Market Watch for May 2016TREB Market Watch for May 2016
TREB Market Watch for May 2016Michelle Makos
 

Similar to Plug valuation (20)

Eastman Chemical Company
Eastman Chemical CompanyEastman Chemical Company
Eastman Chemical Company
 
Retail Merchandise Management Final Project- 6 Month Buying Plan
Retail Merchandise Management Final Project- 6 Month Buying PlanRetail Merchandise Management Final Project- 6 Month Buying Plan
Retail Merchandise Management Final Project- 6 Month Buying Plan
 
Genes
GenesGenes
Genes
 
IFF 2016 DCF
IFF 2016 DCFIFF 2016 DCF
IFF 2016 DCF
 
Table 7.7 Comparative Financial Statistics Universal Office Fur.docx
Table 7.7 Comparative Financial Statistics Universal Office Fur.docxTable 7.7 Comparative Financial Statistics Universal Office Fur.docx
Table 7.7 Comparative Financial Statistics Universal Office Fur.docx
 
Valuation Of Maruti Suzuki
Valuation Of Maruti SuzukiValuation Of Maruti Suzuki
Valuation Of Maruti Suzuki
 
Valuation Of Maruti Suzuki
Valuation Of Maruti SuzukiValuation Of Maruti Suzuki
Valuation Of Maruti Suzuki
 
Convexity(5YEARS)
Convexity(5YEARS)Convexity(5YEARS)
Convexity(5YEARS)
 
2 Effective Strategies to Transform Your Net Profit. FAST.
2 Effective Strategies to Transform Your Net Profit. FAST.2 Effective Strategies to Transform Your Net Profit. FAST.
2 Effective Strategies to Transform Your Net Profit. FAST.
 
P'Kolino Case Study
P'Kolino Case StudyP'Kolino Case Study
P'Kolino Case Study
 
Amazon Fresh - Mock Financials
Amazon Fresh - Mock FinancialsAmazon Fresh - Mock Financials
Amazon Fresh - Mock Financials
 
Market watch jul 2019 frank yu oakville
Market watch jul 2019 frank yu oakvilleMarket watch jul 2019 frank yu oakville
Market watch jul 2019 frank yu oakville
 
Market watch jul 2019 frank yu oakville
Market watch jul 2019 frank yu oakvilleMarket watch jul 2019 frank yu oakville
Market watch jul 2019 frank yu oakville
 
TORONTO REAL ESTATE BOARD'S -- MARKET WATCH - JULY 2019
TORONTO REAL ESTATE BOARD'S -- MARKET WATCH - JULY 2019TORONTO REAL ESTATE BOARD'S -- MARKET WATCH - JULY 2019
TORONTO REAL ESTATE BOARD'S -- MARKET WATCH - JULY 2019
 
Edita Financial Analysis
Edita Financial Analysis Edita Financial Analysis
Edita Financial Analysis
 
RR - Technicals 1.pdf
RR - Technicals 1.pdfRR - Technicals 1.pdf
RR - Technicals 1.pdf
 
Vera Bradley Final Presentation
Vera Bradley Final PresentationVera Bradley Final Presentation
Vera Bradley Final Presentation
 
Round 5Dec. 31, 2018 C58538AndrewsEugene EllisPhili.docx
Round 5Dec. 31, 2018 C58538AndrewsEugene EllisPhili.docxRound 5Dec. 31, 2018 C58538AndrewsEugene EllisPhili.docx
Round 5Dec. 31, 2018 C58538AndrewsEugene EllisPhili.docx
 
BCI Senate Group presentation
BCI Senate Group presentationBCI Senate Group presentation
BCI Senate Group presentation
 
TREB Market Watch for May 2016
TREB Market Watch for May 2016TREB Market Watch for May 2016
TREB Market Watch for May 2016
 

Plug valuation

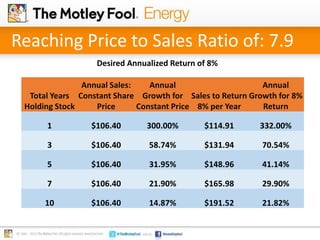
  • 1. Reaching Price to Sales Ratio of: 7.9 Desired Annualized Return of 8% Total Years Holding Stock Annual Sales: Constant Share Price Annual Growth for Constant Price Sales to Return 8% per Year Annual Growth for 8% Return 1 $106.40 300.00% $114.91 332.00% 3 $106.40 58.74% $131.94 70.54% 5 $106.40 31.95% $148.96 41.14% 7 $106.40 21.90% $165.98 29.90% 10 $106.40 14.87% $191.52 21.82%
  • 2. Reaching Price to Sales Ratio of: 7.9 Desired Annualized Return of 10% Total Years Holding Stock Annual Sales: Constant Share Price Annual Growth for Constant Price Sales to Return 10% per Year Annual Growth for 10% Return 1 $106.40 300.00% $117.04 340.00% 3 $106.40 58.74% $138.32 73.25% 5 $106.40 31.95% $159.60 43.10% 7 $106.40 21.90% $180.88 31.50% 10 $106.40 14.87% $212.80 23.11%
  • 3. Reaching Price to Sales Ratio of: 7.9 Desired Annualized Return of 12% Total Years Holding Stock Annual Sales: Constant Share Price Annual Growth for Constant Price Sales to Return 12% per Year Annual Growth for 12% Return 1 $106.40 300.00% $119.17 348.00% 3 $106.40 58.74% $144.70 75.87% 5 $106.40 31.95% $170.24 44.96% 7 $106.40 21.90% $195.78 33.00% 10 $106.40 14.87% $234.08 24.29%
  • 4. Reaching Price to Sales Ratio of: 7.9 Desired Annualized Return of 15% Total Years Holding Stock Annual Sales: Constant Share Price Annual Growth for Constant Price Sales to Return 15% per Year Annual Growth for 15% Return 1 $106.40 300.00% $122.36 360.00% 3 $106.40 58.74% $154.28 79.67% 5 $106.40 31.95% $186.20 47.58% 7 $106.40 21.90% $218.12 35.07% 10 $106.40 14.87% $266.00 25.89%
  • 5. Reaching Price to Sales Ratio of: 4.7 Desired Annualized Return of 8% Total Years Holding Stock Annual Sales: Constant Share Price Annual Growth to Break Even Sales to Return 15% per Year Annual Growth for 15% Return 1 $106.40 300.00% $122.36 360.00% 3 $106.40 58.74% $154.28 79.67% 5 $106.40 31.95% $186.20 47.58% 7 $106.40 21.90% $218.12 35.07% 10 $106.40 14.87% $266.00 25.89% Total Years Holding Stock Annual Sales: Constant Share Price Annual Growth for Constant Price Sales to Return 8% per Year Annual Growth for 8% Return 1 $ 177.33 566.67% $ 191.52 620.00% 3 $ 177.33 88.21% $ 219.89 102.20% 5 $ 177.33 46.14% $ 248.27 56.32% 7 $ 177.33 31.13% $ 276.64 39.73% 10 $ 177.33 20.89% $ 319.20 28.21%
  • 6. Reaching Price to Sales Ratio of: 4.7 Desired Annualized Return of 10% Total Years Holding Stock Annual Sales: Constant Share Price Annual Growth to Break Even Sales to Return 15% per Year Annual Growth for 15% Return 1 $106.40 300.00% $122.36 360.00% 3 $106.40 58.74% $154.28 79.67% 5 $106.40 31.95% $186.20 47.58% 7 $106.40 21.90% $218.12 35.07% 10 $106.40 14.87% $266.00 25.89% Total Years Holding Stock Annual Sales: Constant Share Price Annual Growth for Constant Price Sales to Return 10% per Year Annual Growth for 10% Return 1 $ 177.33 566.67% $ 195.07 633.33% 3 $ 177.33 88.21% $ 230.53 105.41% 5 $ 177.33 46.14% $ 266.00 58.49% 7 $ 177.33 31.13% $ 301.47 41.46% 10 $ 177.33 20.89% $ 354.67 29.57%
  • 7. Reaching Price to Sales Ratio of: 4.7 Desired Annualized Return of 12% Total Years Holding Stock Annual Sales: Constant Share Price Annual Growth to Break Even Sales to Return 15% per Year Annual Growth for 15% Return 1 $106.40 300.00% $122.36 360.00% 3 $106.40 58.74% $154.28 79.67% 5 $106.40 31.95% $186.20 47.58% 7 $106.40 21.90% $218.12 35.07% 10 $106.40 14.87% $266.00 25.89% Total Years Holding Stock Annual Sales: Constant Share Price Annual Growth for Constant Price Sales to Return 12% per Year Annual Growth for 12% Return 1 $177.33 566.67% $198.61 646.67% 3 $177.33 88.21% $241.17 108.52% 5 $177.33 46.14% $283.73 60.55% 7 $177.33 31.13% $326.29 43.06% 10 $177.33 20.89% $390.13 30.81%
  • 8. Reaching Price to Sales Ratio of: 4.7 Desired Annualized Return of 15% Total Years Holding Stock Annual Sales: Constant Share Price Annual Growth to Break Even Sales to Return 15% per Year Annual Growth for 15% Return 1 $106.40 300.00% $122.36 360.00% 3 $106.40 58.74% $154.28 79.67% 5 $106.40 31.95% $186.20 47.58% 7 $106.40 21.90% $218.12 35.07% 10 $106.40 14.87% $266.00 25.89% Total Years Holding Stock Annual Sales: Constant Share Price Annual Growth for Constant Price Sales to Return 15% per Year Annual Growth for 15% Return 1 $177.33 566.67% $203.93 666.67% 3 $177.33 88.21% $257.13 113.02% 5 $177.33 46.14% $310.33 63.45% 7 $177.33 31.13% $363.53 45.29% 10 $177.33 20.89% $443.33 32.49%
  • 9. Reaching Price to Sales Ratio of: 1.7 (S&P Avg.) Desired Annualized Return of 8% Total Years Holding Stock Annual Sales: Constant Share Price Annual Growth to Break Even Sales to Return 15% per Year Annual Growth for 15% Return 1 $106.40 300.00% $122.36 360.00% 3 $106.40 58.74% $154.28 79.67% 5 $106.40 31.95% $186.20 47.58% 7 $106.40 21.90% $218.12 35.07% 10 $106.40 14.87% $266.00 25.89% Total Years Holding Stock Annual Sales: Constant Share Price Annual Growth for Constant Price Sales to Return 8% per Year Annual Growth for 8% Return 1 $458.83 1624.94% $495.54 1762.93% 3 $458.83 158.38% $568.95 177.59% 5 $458.83 76.75% $642.37 89.05% 7 $458.83 50.20% $715.78 60.06% 10 $458.83 32.95% $825.90 41.00%
  • 10. Reaching Price to Sales Ratio of: 1.7 (S&P Avg.) Desired Annualized Return of 10% Total Years Holding Stock Annual Sales: Constant Share Price Annual Growth to Break Even Sales to Return 15% per Year Annual Growth for 15% Return 1 $106.40 300.00% $122.36 360.00% 3 $106.40 58.74% $154.28 79.67% 5 $106.40 31.95% $186.20 47.58% 7 $106.40 21.90% $218.12 35.07% 10 $106.40 14.87% $266.00 25.89% Total Years Holding Stock Annual Sales: Constant Share Price Annual Growth for Constant Price Sales to Return 10% per Year Annual Growth for 10% Return 1 $458.83 1624.94% $504.72 1797.43% 3 $458.83 158.38% $596.48 181.99% 5 $458.83 76.75% $688.25 91.68% 7 $458.83 50.20% $780.02 62.03% 10 $458.83 32.95% $917.67 42.49%
  • 11. Desired Annualized Return of 12% Total Years Holding Stock Annual Sales: Constant Share Price Annual Growth to Break Even Sales to Return 15% per Year Annual Growth for 15% Return 1 $106.40 300.00% $122.36 360.00% 3 $106.40 58.74% $154.28 79.67% 5 $106.40 31.95% $186.20 47.58% 7 $106.40 21.90% $218.12 35.07% 10 $106.40 14.87% $266.00 25.89% Total Years Holding Stock Annual Sales: Constant Share Price Annual Growth for Constant Price Sales to Return 12% per Year Annual Growth for 12% Return 1 $458.83 1624.94% $513.89 1831.93% 3 $458.83 158.38% $624.01 186.27% 5 $458.83 76.75% $734.13 94.17% 7 $458.83 50.20% $844.25 63.88% 10 $458.83 32.95% $1,009.43 43.85% Reaching Price to Sales Ratio of: 1.7 (S&P Avg.)
  • 12. Desired Annualized Return of 15% Total Years Holding Stock Annual Sales: Constant Share Price Annual Growth to Break Even Sales to Return 15% per Year Annual Growth for 15% Return 1 $106.40 300.00% $122.36 360.00% 3 $106.40 58.74% $154.28 79.67% 5 $106.40 31.95% $186.20 47.58% 7 $106.40 21.90% $218.12 35.07% 10 $106.40 14.87% $266.00 25.89% Total Years Holding Stock Annual Sales: Constant Share Price Annual Growth for Constant Price Sales to Return 15% per Year Annual Growth for 15% Return 1 $458.83 1624.94% $527.66 1883.68% 3 $458.83 158.38% $665.31 192.45% 5 $458.83 76.75% $802.96 97.68% 7 $458.83 50.20% $940.61 66.42% 10 $458.83 32.95% $1,147.08 45.70% Reaching Price to Sales Ratio of: 1.7 (S&P Avg.)