1. Eastman Chemical Company (NYSE:EMN)
$101.81
$106.77
$30.79
$84.64
$71.00
$85.77
$55.19
$66.70
$75.84
$88.37
$63.41
$79.59
$29.62
$29.36
$30.43
$31.40
$44.10
$32.70
$46.09
$62.70
$196.16
$172.21
$78.25
$203.03
$166.29
$141.45
$181.52
$189.63
$152.01
$111.92
$143.32
$147.57
$98.30
$114.53
$120.79
$124.81
$107.56
$119.89
$162.74
$81.45
$- $50 $100 $150 $200 $250 $300 $350 $400 $450
Price/2017E EPS
Price/2016E EPS
Price/LTM EPS
Price/2015A EPS
Price to Earnings
EV/2017E EBIT
EV/2016E EBIT
EV/LTM EBIT
EV/2015A EBIT
Enterprise Value to EBIT
EV/2017E EBITDA
EV/2016E EBITDA
EV/LTM EBITDA
EV/2015A EBITDA
Enterprise Value to EBITDA
EV/2017ERevenue
EV/2016E Revenue
EV/LTM Revenue
EV/2015A Revenue
Enterprise Value to Revenue
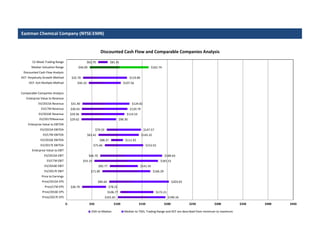
Comparable Companies Analysis
DCF: Exit Multiple Method
DCF: Perpetuity Growth Method
Discounted Cash Flow Analysis
Median Valuation Range
52-Week Trading Range
Discounted Cash Flow and Comparable Companies Analysis
25th to Median Median to 75th; Trading Range and DCF are described from minimum to maximum
2. Discounted Cash Flow Analysis — Perpetuity Growth Method Operating Scenario: Base
(Values in millions, USD, except per-share data) Fiscal Year Ended December 31,
Operating Scenario 1
Mid-Year Convention Y CAGR CAGR
Include Other Income Y 2013 A 2014 A 2015 A ('13-'15) 2016 E 2017 E 2018 E 2019 E 2020 E 2021 E ('16-'21)
Total Revenue $9,350.0 $9,527.0 $9,648.0 1.6% $9,841.0 $10,057.5 $10,308.9 $10,563.8 $10,822.0 $11,083.6 2.4%
% Growth NA 1.9% 1.3% 2.0% 2.2% 2.5% 2.5% 2.4% 2.4%
Cost of Goods Sold 6,141.0 6,856.0 6,497.0 6,724.1 6,872.0 7,043.8 7,218.0 7,394.4 7,573.2
Gross Profit 3,209.0 2,671.0 3,151.0 (0.9%) 3,116.8 3,185.4 3,265.1 3,345.8 3,427.6 3,510.4 2.4%
% Margin 34.3% 28.0% 32.7% 31.7% 31.7% 31.7% 31.7% 31.7% 31.7%
Total Operating Expenses 914.0 1,059.0 1,196.0 1,219.9 1,246.8 1,277.9 1,309.5 1,341.5 1,374.0
Other Income (3.0) 15.0 8.0 9.8 10.1 10.3 10.6 10.8 11.1
EBITDA 2,292.0 1,627.0 1,963.0 (7.5%) 1,906.8 1,948.7 1,997.4 2,046.8 2,096.9 2,147.5 2.4%
% Margin 24.5% 17.1% 20.3% 19.4% 19.4% 19.4% 19.4% 19.4% 19.4%
Depreciation & Amortization 433.0 450.0 571.0 579.5 646.0 712.8 779.7 846.7 913.8
EBIT 1,859.0 1,177.0 1,392.0 (13.5%) 1,327.3 1,302.7 1,284.6 1,267.1 1,250.1 1,233.8 (1.5%)
% Margin 19.9% 12.4% 14.4% 13.5% 13.0% 12.5% 12.0% 11.6% 11.1%
Income Tax Expense 507.0 235.0 275.0 262.2 257.4 253.8 250.3 247.0 243.7
EBIAT 1,352.0 942.0 1,117.0 (9.1%) 1,065.1 1,045.3 1,030.8 1,016.8 1,003.2 990.0 (1.5%)
Plus: Depreciation & Amortization 433.0 450.0 571.0 579.5 646.0 712.8 779.7 846.7 913.8
Less: Capital Expenditures (483.0) (593.0) (652.0) (665.0) (665.4) (667.5) (669.1) (670.1) (670.6)
Less: Inc./(Dec.) in Operating Working Capital (43.0) (105.0) 278.0 (65.5) (22.6) (26.2) (26.6) (26.9) (27.3)
Unlevered Free Cash Flow $1,259.0 $694.0 $1,314.0 2.2% $914.0 $1,003.4 $1,049.9 $1,100.9 $1,152.8 $1,205.9 5.7%
WACC 7.9%
Discount Period 0.5 1.5 2.5 3.5 4.5
Discount Factor 0.96 0.89 0.83 0.77 0.71
Present Value of Free Cash Flow $965.9 $936.8 $910.3 $883.5 $856.5
cc cc
Cumulative Present Value of FCF $4,552.9 Enterprise Value $20,551.0 Enterprise Value $20,551.0
Less: Total Debt (10,973.0) LTM EBITDA $1,977.4
Terminal Value Less: Preferred Equity
Terminal Year Free Cash Flow (2021E) $1,205.9 Less: Noncontrolling Interest (75.0) Implied EV/EBITDA 10.4x
Perpetuity Growth Rate 2.4% Less: Cash and Cash Equivalents (207.0)
WACC 7.9%
Discount Factor 0.71 Implied Equity Value $9,296.0
Terminal Value $22,525.0 Risk Free Rate (10-Year US Treasury) 2.417%
Present Value of Terminal Value $15,998.1 Fully Diluted Shares Outstanding 146.8 Long-Term Growth Rate of Sector
% of Enterprise Value 77.8% Long-Term Rate of Inflation
Enterprise Value $20,551.0 Implied Share Price $63.35 Long-Term GDP Growth Rate
Eastman Chemical Company (NYSE:EMN)
Historical Period
Implied EV/EBITDAImplied Equity Value and Share PriceEnterprise Value – PGM
Projection Period
Choices as to Perpetuity Growth Rate
3. Discounted Cash Flow Analysis — Perpetuity Growth Method Operating Scenario: Base
(Values in millions, USD, except per-share data) Fiscal Year Ended December 31,
Sensitivity Analysis
1.8% 2.1% 2.4% 2.7% 3.0% 1.8% 2.1% 2.4% 2.7% 3.0%
9.0% 16,053 16,614 17,227 17,901 18,646 9.0% 17,082 17,907 18,809 19,801 20,897
8.4% 17,315 17,983 18,719 19,534 20,443 8.4% 18,450 19,410 20,470 21,644 22,953
7.9% 18,797 19,602 $20,498.9 21,503 22,634 7.9% 20,055 21,189 $22,451.6 23,865 25,457
7.4% 20,561 21,549 22,661 23,921 25,361 7.4% 21,966 23,327 24,858 26,593 28,575
6.8% 22,697 23,933 25,343 26,964 28,849 6.8% 24,280 25,945 27,843 30,026 32,564
1.8% 2.1% 2.4% 2.7% 3.0% 1.8% 2.1% 2.4% 2.7% 3.0%
9.0% 72.3% 73.2% 74.2% 75.2% 76.2% 9.0% 4,798 5,359 5,972 6,646 7,391
8.4% 74.0% 75.0% 76.0% 77.0% 78.0% 8.4% 6,060 6,728 7,464 8,279 9,188
7.9% 75.8% 76.8% 77.8% 78.8% 79.9% 7.9% 7,542 8,347 $9,243.9 10,248 11,379
7.4% 77.6% 78.6% 79.7% 80.7% 81.8% 7.4% 9,306 10,294 11,406 12,666 14,106
6.8% 79.4% 80.5% 81.6% 82.7% 83.8% 6.8% 11,442 12,678 14,088 15,709 17,594
1.8% 2.1% 2.4% 2.7% 3.0% 1.8% 2.1% 2.4% 2.7% 3.0%
9.0% 32.70 36.52 40.70 45.29 50.36 9.0% 8.1x 8.4x 8.7x 9.1x 9.4x
8.4% 41.30 45.84 50.86 56.42 62.61 8.4% 8.8x 9.1x 9.5x 9.9x 10.3x
7.9% 51.39 56.88 $62.99 69.83 77.54 7.9% 9.5x 9.9x 10.4x 10.9x 11.4x
7.4% 63.41 70.15 77.72 86.31 96.12 7.4% 10.4x 10.9x 11.5x 12.1x 12.8x
6.8% 77.97 86.39 96.00 107.05 119.89 6.8% 11.5x 12.1x 12.8x 13.6x 14.6x
Assumptions of Sensitivity Analysis
Perpetuity Growth Rate
Difference between minimum and maximum possible Perpetuity Growth Rate: 0.620%
WACC
Difference between minimum and maximum possible WACC: 1.065%
Note
In the sensitivity analysis tables above, shaded regions indicate the boundary defined by Perpetuity Growth Rate and WACC minima and maxima, while the white regions are slightly beyond the likely minima and maxima.
WACC
WACC
WACC
WACC
WACC
WACC
Perpetuity Growth Rate
PV of Terminal Value % of Enterprise Value
Perpetuity Growth Rate
Implied Share Price
Perpetuity Growth Rate
Implied Enterprise Value / LTM EBITDA
Perpetuity Growth Rate
Perpetuity Growth Rate
Enterprise Value Terminal Value
Perpetuity Growth Rate
Implied Equity Value
Eastman Chemical Company (NYSE:EMN)
4. Discounted Cash Flow Analysis — Exit Multiple Method Operating Scenario: Base
Fiscal Year Ended December 31,
Operating Scenario 1
Mid-Year Convention Y CAGR CAGR
Include Other Income Y 2013 A 2014 A 2015 A ('13-'15) 2016 E 2017 E 2018 E 2019 E 2020 E 2021 E ('16-'21)
Total Revenue $9,350.0 $9,527.0 $9,648.0 1.6% $9,841.0 $10,057.5 $10,308.9 $10,563.8 $10,822.0 $11,083.6 2.4%
% Growth NA 1.9% 1.3% 2.0% 2.2% 2.5% 2.5% 2.4% 2.4%
Cost of Goods Sold 6,141.0 6,856.0 6,497.0 6,724.1 6,872.0 7,043.8 7,218.0 7,394.4 7,573.2
Gross Profit 3,209.0 2,671.0 3,151.0 (0.9%) 3,116.8 3,185.4 3,265.1 3,345.8 3,427.6 3,510.4 2.4%
% Margin 34.3% 28.0% 32.7% 31.7% 31.7% 31.7% 31.7% 31.7% 31.7%
Total Operating Expenses 914.0 1,059.0 1,196.0 1,219.9 1,246.8 1,277.9 1,309.5 1,341.5 1,374.0
Other Income (3.0) 15.0 8.0 9.8 10.1 10.3 10.6 10.8 11.1
EBITDA 2,292.0 1,627.0 1,963.0 (7.5%) 1,906.8 1,948.7 1,997.4 2,046.8 2,096.9 2,147.5 2.4%
% Margin 24.5% 17.1% 20.3% 19.4% 19.4% 19.4% 19.4% 19.4% 19.4%
Depreciation & Amortization 433.0 450.0 571.0 579.5 646.0 712.8 779.7 846.7 913.8
EBIT 1,859.0 1,177.0 1,392.0 (13.5%) 1,327.3 1,302.7 1,284.6 1,267.1 1,250.1 1,233.8 (1.5%)
% Margin 19.9% 12.4% 14.4% 13.5% 13.0% 12.5% 12.0% 11.6% 11.1%
Income Tax Expense 507.0 235.0 275.0 262.2 257.4 253.8 250.3 247.0 243.7
EBIAT 1,352.0 942.0 1,117.0 (9.1%) 1,065.1 1,045.3 1,030.8 1,016.8 1,003.2 990.0 (1.5%)
Plus: Depreciation & Amortization 433.0 450.0 571.0 579.5 646.0 712.8 779.7 846.7 913.8
Less: Capital Expenditures (483.0) (593.0) (652.0) (665.0) (665.4) (667.5) (669.1) (670.1) (670.6)
Less: Inc./(Dec.) in Net Working Capital (43.0) (105.0) 278.0 (65.5) (22.6) (26.2) (26.6) (26.9) (27.3)
Unlevered Free Cash Flow $1,259.0 $694.0 $1,314.0 2.2% $914.0 $1,003.4 $1,049.9 $1,100.9 $1,152.8 $1,205.9 5.7%
WACC 7.9%
Discount Period 0.5 1.5 2.5 3.5 4.5
Discount Factor 0.96 0.89 0.83 0.77 0.71
Present Value of Free Cash Flow $965.9 $936.8 $910.3 $883.5 $856.5
cc cc
Cumulative Present Value of FCF $4,552.9 Enterprise Value $22,173.3 Terminal Year Free Cash Flow (2021E) $1,205.9
Less: Total Debt (10,973.0) WACC 7.9%
Terminal Value Less: Preferred Equity 0.0 Terminal Value $25,770.5
Terminal Year EBITDA (2021E) $2,147.5 Less: Noncontrolling Interest (75.0)
Exit Multiple (EV/EBITDA) 12.0x Less: Cash and Cash Equivalents (207.0) Implied Perpetuity Growth Rate 2.9%
Terminal Value $25,770.5
Discount Factor 0.68 Implied Equity Value $10,918.3
Present Value of Terminal Value $17,620.4 Enterprise Value $22,173.3
% of Enterprise Value 79.5% Fully Diluted Shares Outstanding 146.8 LTM EBITDA $1,977.4
Enterprise Value $22,173.3 Implied Share Price $74.40 Implied EV/EBITDA 11.2x
Implied EV/EBITDA
Eastman Chemical Company (NYSE:EMN)
Historical Period Projection Period
Enterprise Value – EMM Implied Equity Value and Share Price Implied Perpetuity Growth Rate
5. Discounted Cash Flow Analysis — Exit Multiple Method Operating Scenario: Base
Fiscal Year Ended December 31,
Sensitivity Analysis
9.5x 10.8x 12.0x 13.3x 14.5x 9.5x 10.8x 12.0x 13.3x 14.5x
9.0% 17,726 19,474 21,221 22,969 24,716 9.0% 74.9% 77.2% 79.1% 80.6% 82.0%
8.4% 18,109 19,900 21,691 23,481 25,272 8.4% 75.2% 77.4% 79.3% 80.8% 82.2%
7.9% 18,502 20,338 $22,173.3 24,009 25,844 7.9% 75.4% 77.6% 79.5% 81.0% 82.4%
7.4% 18,907 20,789 22,670 24,551 26,433 7.4% 75.6% 77.8% 79.7% 81.2% 82.6%
6.8% 19,324 21,252 23,181 25,110 27,039 6.8% 75.9% 78.0% 79.9% 81.4% 82.7%
9.5x 10.8x 12.0x 13.3x 14.5x 9.5x 10.8x 12.0x 13.3x 14.5x
9.0% 6,471 8,219 9,966 11,714 13,461 9.0% 44.10 56.01 67.91 79.82 91.73
8.4% 6,854 8,645 10,436 12,226 14,017 8.4% 46.70 58.91 71.11 83.31 95.52
7.9% 7,247 9,083 $10,918.3 12,754 14,589 7.9% 49.39 61.89 $74.40 86.91 99.41
7.4% 7,652 9,534 11,415 13,296 15,178 7.4% 52.14 64.96 77.79 90.61 103.43
6.8% 8,069 9,997 11,926 13,855 15,784 6.8% 54.98 68.13 81.27 94.41 107.56
9.5x 10.8x 12.0x 13.3x 14.5x 9.5x 10.8x 12.0x 13.3x 14.5x
9.0% 2.6% 3.3% 3.9% 4.3% 4.7% 9.0% 9.0x 9.8x 10.7x 11.6x 12.5x
8.4% 2.1% 2.8% 3.4% 3.8% 4.2% 8.4% 9.2x 10.1x 11.0x 11.9x 12.8x
7.9% 1.7% 2.3% 2.9% 3.4% 3.7% 7.9% 9.4x 10.3x 11.2x 12.1x 13.1x
7.4% 1.2% 1.9% 2.4% 2.9% 3.2% 7.4% 9.6x 10.5x 11.5x 12.4x 13.4x
6.8% 0.7% 1.4% 1.9% 2.4% 2.7% 6.8% 9.8x 10.7x 11.7x 12.7x 13.7x
Assumptions of Sensitivity Analysis
Exit Multiple (EV/EBITDA)
Difference between minimum and maximum possible Exit Multiple (EV/EBITDA): 2.500x
WACC
Difference between minimum and maximum possible WACC: 1.065%
Note
In the sensitivity analysis tables above, shaded regions indicate the boundary defined by Exit Multiple and WACC minima and maxima, while the white regions are slightly beyond the likely minima and maxima.
WACCWACCWACC
WACCWACCWACC
Exit Multiple (EV/EBITDA) Exit Multiple (EV/EBITDA)
Implied Equity Value Implied Share Price
Exit Multiple (EV/EBITDA) Exit Multiple (EV/EBITDA)
Implied Perpetuity Growth Rate Implied Enterprise Value / LTM EBITDA
Eastman Chemical Company (NYSE:EMN)
Enterprise Value PV of Terminal Value % of Enterprise Value
Exit Multiple (EV/EBITDA) Exit Multiple (EV/EBITDA)
6. Discounted Cash Flow Analysis — Perpetuity Growth Method Operating Scenario: Upside
(Values in millions, USD, except per-share data) Fiscal Year Ended December 31,
Operating Scenario 3
Mid-Year Convention Y CAGR CAGR
Include Other Income Y 2013 A 2014 A 2015 A ('13-'15) 2016 E 2017 E 2018 E 2019 E 2020 E 2021 E ('16-'21)
Total Revenue $9,350.0 $9,527.0 $9,648.0 1.6% $9,889.2 $10,156.2 $10,460.9 $10,771.8 $11,089.0 $11,412.5 2.9%
% Growth NA 1.9% 1.3% 2.5% 2.7% 3.0% 3.0% 2.9% 2.9%
Cost of Goods Sold 6,141.0 6,856.0 6,497.0 6,757.1 6,939.5 7,147.7 7,360.2 7,576.9 7,797.9
Gross Profit 3,209.0 2,671.0 3,151.0 (0.9%) 3,132.1 3,216.7 3,313.2 3,411.7 3,512.1 3,614.6 2.9%
% Margin 34.3% 28.0% 32.7% 31.7% 31.7% 31.7% 31.7% 31.7% 31.7%
Total Operating Expenses 914.0 1,059.0 1,196.0 1,127.0 1,157.4 1,192.2 1,227.6 1,263.7 1,300.6
Other Income (3.0) 15.0 8.0 11.9 12.2 12.6 12.9 13.3 13.7
EBITDA 2,292.0 1,627.0 1,963.0 (7.5%) 2,017.0 2,071.4 2,133.6 2,197.0 2,261.7 2,327.7 2.9%
% Margin 24.5% 17.1% 20.3% 20.4% 20.4% 20.4% 20.4% 20.4% 20.4%
Depreciation & Amortization 433.0 450.0 571.0 584.8 657.4 731.0 805.5 880.8 957.0
EBIT 1,859.0 1,177.0 1,392.0 (13.5%) 1,432.2 1,414.0 1,402.6 1,391.5 1,380.9 1,370.6 (0.9%)
% Margin 19.9% 12.4% 14.4% 14.5% 13.9% 13.4% 12.9% 12.5% 12.0%
Income Tax Expense 507.0 235.0 275.0 282.9 279.4 277.1 274.9 272.8 270.8
EBIAT 1,352.0 942.0 1,117.0 (9.1%) 1,149.2 1,134.7 1,125.5 1,116.6 1,108.1 1,099.9 (0.9%)
Plus: Depreciation & Amortization 433.0 450.0 571.0 584.8 657.4 731.0 805.5 880.8 957.0
Less: Capital Expenditures (483.0) (593.0) (652.0) (693.0) (697.4) (703.5) (709.2) (714.4) (719.1)
Less: Inc./(Dec.) in Operating Working Capital (43.0) (105.0) 278.0 (65.5) (22.6) (26.2) (26.6) (26.9) (27.3)
Unlevered Free Cash Flow $1,259.0 $694.0 $1,314.0 2.2% $975.5 $1,072.2 $1,126.8 $1,186.4 $1,247.6 $1,310.6 6.1%
WACC 7.9%
Discount Period 0.5 1.5 2.5 3.5 4.5
Discount Factor 0.96 0.89 0.83 0.77 0.71
Present Value of Free Cash Flow $1,032.2 $1,005.3 $981.0 $956.1 $930.8
cc cc
Cumulative Present Value of FCF $4,905.4 Enterprise Value $22,291.9 Enterprise Value $22,291.9
Less: Total Debt (10,973.0) LTM EBITDA $1,977.4
Terminal Value Less: Preferred Equity
Terminal Year Free Cash Flow (2021E) $1,310.6 Less: Noncontrolling Interest (75.0) Implied EV/EBITDA 11.3x
Perpetuity Growth Rate 2.4% Less: Cash and Cash Equivalents (207.0)
WACC 7.9%
Discount Factor 0.71 Implied Equity Value $11,036.9
Terminal Value $24,479.9 Risk Free Rate (10-Year US Treasury) 2.417%
Present Value of Terminal Value $17,386.5 Fully Diluted Shares Outstanding 146.8 Long-Term Growth Rate of Sector
% of Enterprise Value 78.0% Long-Term Rate of Inflation
Enterprise Value $22,291.9 Implied Share Price $75.21 Long-Term GDP Growth Rate
Eastman Chemical Company (NYSE:EMN)
Historical Period
Implied EV/EBITDAImplied Equity Value and Share PriceEnterprise Value – PGM
Projection Period
Choices as to Perpetuity Growth Rate
7. Discounted Cash Flow Analysis — Perpetuity Growth Method Operating Scenario: Upside
(Values in millions, USD, except per-share data) Fiscal Year Ended December 31,
Sensitivity Analysis
1.8% 2.1% 2.4% 2.7% 3.0% 1.8% 2.1% 2.4% 2.7% 3.0%
9.0% 17,405 18,014 18,680 19,413 20,222 9.0% 18,565 19,461 20,442 21,520 22,710
8.4% 18,776 19,501 20,301 21,187 22,175 8.4% 20,051 21,095 22,246 23,522 24,945
7.9% 20,385 21,261 $22,235.3 23,326 24,555 7.9% 21,796 23,028 $24,400.2 25,936 27,667
7.4% 22,302 23,377 24,585 25,954 27,519 7.4% 23,873 25,352 27,016 28,901 31,055
6.8% 24,623 25,967 27,499 29,261 31,309 6.8% 26,387 28,197 30,260 32,632 35,390
1.8% 2.1% 2.4% 2.7% 3.0% 1.8% 2.1% 2.4% 2.7% 3.0%
9.0% 72.5% 73.4% 74.4% 75.3% 76.3% 9.0% 6,150 6,759 7,425 8,158 8,967
8.4% 74.2% 75.1% 76.1% 77.1% 78.1% 8.4% 7,521 8,246 9,046 9,932 10,920
7.9% 75.9% 76.9% 77.9% 79.0% 80.0% 7.9% 9,130 10,006 $10,980.3 12,071 13,300
7.4% 77.7% 78.8% 79.8% 80.9% 82.0% 7.4% 11,047 12,122 13,330 14,699 16,264
6.8% 79.6% 80.6% 81.7% 82.8% 83.9% 6.8% 13,368 14,712 16,244 18,006 20,054
1.8% 2.1% 2.4% 2.7% 3.0% 1.8% 2.1% 2.4% 2.7% 3.0%
9.0% 41.91 46.06 50.60 55.59 61.10 9.0% 8.8x 9.1x 9.4x 9.8x 10.2x
8.4% 51.25 56.19 61.64 67.68 74.41 8.4% 9.5x 9.9x 10.3x 10.7x 11.2x
7.9% 62.22 68.18 $74.82 82.26 90.63 7.9% 10.3x 10.8x 11.2x 11.8x 12.4x
7.4% 75.28 82.60 90.83 100.16 110.82 7.4% 11.3x 11.8x 12.4x 13.1x 13.9x
6.8% 91.10 100.25 110.69 122.70 136.66 6.8% 12.5x 13.1x 13.9x 14.8x 15.8x
Assumptions of Sensitivity Analysis
Perpetuity Growth Rate
Difference between minimum and maximum possible Perpetuity Growth Rate: 0.620%
WACC
Difference between minimum and maximum possible WACC: 1.065%
Note
In the sensitivity analysis tables above, shaded regions indicate the boundary defined by Perpetuity Growth Rate and WACC minima and maxima, while the white regions are slightly beyond the likely minima and maxima.
Eastman Chemical Company (NYSE:EMN)
Perpetuity Growth Rate
Enterprise Value Terminal Value
Perpetuity Growth Rate
Implied Equity Value
Perpetuity Growth Rate
PV of Terminal Value % of Enterprise Value
Perpetuity Growth Rate
Implied Share Price
Perpetuity Growth Rate
Implied Enterprise Value / LTM EBITDA
Perpetuity Growth Rate
WACC
WACC
WACC
WACC
WACC
WACC
8. Discounted Cash Flow Analysis — Exit Multiple Method Operating Scenario: Upside
Fiscal Year Ended December 31,
Operating Scenario 3
Mid-Year Convention Y CAGR CAGR
Include Other Income Y 2013 A 2014 A 2015 A ('13-'15) 2016 E 2017 E 2018 E 2019 E 2020 E 2021 E ('16-'21)
Total Revenue $9,350.0 $9,527.0 $9,648.0 1.6% $9,889.2 $10,156.2 $10,460.9 $10,771.8 $11,089.0 $11,412.5 2.9%
% Growth NA 1.9% 1.3% 2.5% 2.7% 3.0% 3.0% 2.9% 2.9%
Cost of Goods Sold 6,141.0 6,856.0 6,497.0 6,757.1 6,939.5 7,147.7 7,360.2 7,576.9 7,797.9
Gross Profit 3,209.0 2,671.0 3,151.0 (0.9%) 3,132.1 3,216.7 3,313.2 3,411.7 3,512.1 3,614.6 2.9%
% Margin 34.3% 28.0% 32.7% 31.7% 31.7% 31.7% 31.7% 31.7% 31.7%
Total Operating Expenses 914.0 1,059.0 1,196.0 1,127.0 1,157.4 1,192.2 1,227.6 1,263.7 1,300.6
Other Income (3.0) 15.0 8.0 11.9 12.2 12.6 12.9 13.3 13.7
EBITDA 2,292.0 1,627.0 1,963.0 (7.5%) 2,017.0 2,071.4 2,133.6 2,197.0 2,261.7 2,327.7 2.9%
% Margin 24.5% 17.1% 20.3% 20.4% 20.4% 20.4% 20.4% 20.4% 20.4%
Depreciation & Amortization 433.0 450.0 571.0 584.8 657.4 731.0 805.5 880.8 957.0
EBIT 1,859.0 1,177.0 1,392.0 (13.5%) 1,432.2 1,414.0 1,402.6 1,391.5 1,380.9 1,370.6 (0.9%)
% Margin 19.9% 12.4% 14.4% 14.5% 13.9% 13.4% 12.9% 12.5% 12.0%
Income Tax Expense 507.0 235.0 275.0 282.9 279.4 277.1 274.9 272.8 270.8
EBIAT 1,352.0 942.0 1,117.0 (9.1%) 1,149.2 1,134.7 1,125.5 1,116.6 1,108.1 1,099.9 (0.9%)
Plus: Depreciation & Amortization 433.0 450.0 571.0 584.8 657.4 731.0 805.5 880.8 957.0
Less: Capital Expenditures (483.0) (593.0) (652.0) (693.0) (697.4) (703.5) (709.2) (714.4) (719.1)
Less: Inc./(Dec.) in Net Working Capital (43.0) (105.0) 278.0 (65.5) (22.6) (26.2) (26.6) (26.9) (27.3)
Unlevered Free Cash Flow $1,259.0 $694.0 $1,314.0 2.2% $975.5 $1,072.2 $1,126.8 $1,186.4 $1,247.6 $1,310.6 6.1%
WACC 7.9%
Discount Period 0.5 1.5 2.5 3.5 4.5
Discount Factor 0.96 0.89 0.83 0.77 0.71
Present Value of Free Cash Flow $1,032.2 $1,005.3 $981.0 $956.1 $930.8
cc cc
Cumulative Present Value of FCF $4,905.4 Enterprise Value $24,003.7 Terminal Year Free Cash Flow (2021E) $1,310.6
Less: Total Debt (10,973.0) WACC 7.9%
Terminal Value Less: Preferred Equity 0.0 Terminal Value $27,932.1
Terminal Year EBITDA (2021E) $2,327.7 Less: Noncontrolling Interest (75.0)
Exit Multiple (EV/EBITDA) 12.0x Less: Cash and Cash Equivalents (207.0) Implied Perpetuity Growth Rate 2.9%
Terminal Value $27,932.1
Discount Factor 0.68 Implied Equity Value $12,748.7
Present Value of Terminal Value $19,098.4 Enterprise Value $24,003.7
% of Enterprise Value 79.6% Fully Diluted Shares Outstanding 146.8 LTM EBITDA $1,977.4
Enterprise Value $24,003.7 Implied Share Price $86.87 Implied EV/EBITDA 12.1x
Eastman Chemical Company (NYSE:EMN)
Historical Period Projection Period
Enterprise Value – EMM Implied Equity Value and Share Price Implied Perpetuity Growth Rate
Implied EV/EBITDA
9. Discounted Cash Flow Analysis — Exit Multiple Method Operating Scenario: Upside
Fiscal Year Ended December 31,
Sensitivity Analysis
9.5x 10.8x 12.0x 13.3x 14.5x 9.5x 10.8x 12.0x 13.3x 14.5x
9.0% 19,184 21,078 22,972 24,866 26,761 9.0% 75.0% 77.3% 79.2% 80.7% 82.1%
8.4% 19,599 21,540 23,481 25,422 27,363 8.4% 75.3% 77.5% 79.4% 80.9% 82.3%
7.9% 20,025 22,014 $24,003.7 25,993 27,983 7.9% 75.5% 77.7% 79.6% 81.1% 82.5%
7.4% 20,463 22,503 24,542 26,581 28,620 7.4% 75.7% 77.9% 79.8% 81.3% 82.7%
6.8% 20,915 23,005 25,096 27,187 29,277 6.8% 76.0% 78.2% 80.0% 81.5% 82.8%
9.5x 10.8x 12.0x 13.3x 14.5x 9.5x 10.8x 12.0x 13.3x 14.5x
9.0% 7,929 9,823 11,717 13,611 15,506 9.0% 54.03 66.94 79.85 92.75 105.66
8.4% 8,344 10,285 12,226 14,167 16,108 8.4% 56.86 70.08 83.31 96.54 109.76
7.9% 8,770 10,759 $12,748.7 14,738 16,728 7.9% 59.76 73.32 $86.87 100.43 113.99
7.4% 9,208 11,248 13,287 15,326 17,365 7.4% 62.75 76.65 90.54 104.44 118.33
6.8% 9,660 11,750 13,841 15,932 18,022 6.8% 65.82 80.07 94.32 108.56 122.81
9.5x 10.8x 12.0x 13.3x 14.5x 9.5x 10.8x 12.0x 13.3x 14.5x
9.0% 2.6% 3.3% 3.9% 4.3% 4.7% 9.0% 9.7x 10.7x 11.6x 12.6x 13.5x
8.4% 2.1% 2.8% 3.4% 3.8% 4.2% 8.4% 9.9x 10.9x 11.9x 12.9x 13.8x
7.9% 1.6% 2.3% 2.9% 3.3% 3.7% 7.9% 10.1x 11.1x 12.1x 13.1x 14.2x
7.4% 1.2% 1.8% 2.4% 2.8% 3.2% 7.4% 10.3x 11.4x 12.4x 13.4x 14.5x
6.8% 0.7% 1.3% 1.9% 2.3% 2.7% 6.8% 10.6x 11.6x 12.7x 13.7x 14.8x
Assumptions of Sensitivity Analysis
Exit Multiple (EV/EBITDA)
Difference between minimum and maximum possible Exit Multiple (EV/EBITDA): 2.500x
WACC
Difference between minimum and maximum possible WACC: 1.065%
Note
In the sensitivity analysis tables above, shaded regions indicate the boundary defined by Exit Multiple and WACC minima and maxima, while the white regions are slightly beyond the likely minima and maxima.
Eastman Chemical Company (NYSE:EMN)
Enterprise Value PV of Terminal Value % of Enterprise Value
Exit Multiple (EV/EBITDA) Exit Multiple (EV/EBITDA)
Exit Multiple (EV/EBITDA)
Implied Equity Value Implied Share Price
Exit Multiple (EV/EBITDA) Exit Multiple (EV/EBITDA)
Implied Perpetuity Growth Rate Implied Enterprise Value / LTM EBITDA
WACCWACCWACC
WACCWACCWACC
Exit Multiple (EV/EBITDA)
10. DCF Weighted Average Cost of Capital 76.0 143.0 180.0 187.0 263.0 180.4
Calculation of Weighted Average Cost of Capital 2.44% 2.00% 3.00% 1.91% 2.91% 2.30%
Capital Sctucture Projection
2011 A 2012 A 2013 A 2014 A 2015 A LTM 2016 E Target Capital Structure
Equity Capital Common Equity 61.01%
Share Price (Feb. 28) 46.70 54.96 69.73 87.43 74.46 83.67 Preferrred Equity 0.00%
Basic Shares Outstanding 139.5 145.7 153.9 149.3 148.5 146.8 Total Equity Capital 61.01%
Shares Issued/(Repurchased) NA 6.1 8.2 (4.6) (0.8) (1.8) Borrowings due within one year 3.35%
% Change NA 4.40% 5.65% (2.98%) (0.53%) (1.19%) Post-employment & Other LT Liabilities 6.16%
Market Capitalization 6,515.8 8,005.8 10,731.2 13,053.7 11,058.2 0.0 12,278.8 Long-term borrowings 29.48%
Preferred Share Price (Feb. 28) 0.00 0.00 0.00 0.00 0.00 0.00 Total Debt Capital 38.99%
Preferred Shares Outstanding 0.0 0.0 0.0 0.0 0.0 0.0 Target Debt-to-Equity 63.91%
Total Preferred Equity 0.0 0.0 0.0 0.0 0.0 0.0 0.0
Total Equity (Common & Preferred) 6,515.8 8,005.8 10,731.2 13,053.7 11,058.2 0.0 12,278.8 Cost of Common Equity
Risk-Free Rate 2.417%
Debt Capital Expected Market Rate of Return 8.11%
Borrowings due within one year 153.0 4.0 0.0 301.0 431.0 675.0 Market-Risk Premium 5.69%
Post-employment & Other LT Liabilities 1,514.0 2,357.0 1,750.0 2,266.0 1,998.0 1,239.0 Relevered Beta 1.70
Long-term borrowings 1,445.0 4,779.0 4,254.0 7,248.0 6,608.0 5,933.0 Size Premium
Total Debt Capital 3,112.0 7,140.0 6,004.0 9,815.0 9,037.0 0.0 7,847.0 Cost of Equity 12.06%
Total Capitalization 9,627.8 15,145.8 16,735.2 22,868.7 20,095.2 0.0 20,125.8 Cost of Preferred Equity
Marginal Tax Rate 40.0% 40.0% 40.0% 40.0% 40.0% 40.0% Cost of Debt
Market Risk Premium 6.01% 5.78% 4.96% 5.78% 6.12% 5.69% Pre-Tax Cost of Debt 2.43%
Analysis of Capital Structure Target Marginal Tax Rate 40.00%
Common Equity 67.68% 52.86% 64.12% 57.08% 55.03% 0.00% 61.01% After-Tax Cost of Debt (rd-After-Tax) 1.46%
Preferrred Equity 0.00% 0.00% 0.00% 0.00% 0.00% 0.00% 0.00%
Total Equity Capital 67.68% 52.86% 64.12% 57.08% 55.03% 0.00% 61.01% Weighted Average Cost of Capital 7.93%
Borrowings due within one year 1.59% 0.03% 0.00% 1.32% 2.14% 0.00% 3.35%
Post-employment & Other LT Liabilities 15.73% 15.56% 10.46% 9.91% 9.94% 0.00% 6.16% Notes:
Long-term borrowings 15.01% 31.55% 25.42% 31.69% 32.88% 0.00% 29.48% 1. Here all debt is assumed to take on the cost of long-term debt (put-sloping).
Total Debt Capital 32.32% 47.14% 35.88% 42.92% 44.97% 0.00% 38.99% 2. The cost of Preferred Equity is only taken into account if available.
Debt-to-Equity 47.76% 89.18% 55.95% 75.19% 81.72% 0.00% 63.91% 3. Preferred Equity not considered in Sensitivity Analysis.
Calculation of Relevered Beta from Closest Comparables Predicted Market Market Debt-to- Marginal Unlevered
Company Levered Beta Value of Debt Value of Equity Equity Tax Rate Beta
The Dow Chemical Company (NYSE:DOW) 1.12 21,056.0 75,540.8 27.87% 40.0% 0.96
E. I. Du Pont de Nemours and Company (NYSE:DD) 1.68 11,356.0 67,903.6 16.72% 40.0% 1.53 Top Ten Comparables Chosen from Among the Following Sources:
LyondellBasell Industries N.V. (NYSE:LYB) 1.04 9,088.0 36,727.0 24.74% 40.0% 0.91 1. Morning Star 5. S&P Capital IQ
Celanese Corporation (NYSE:CE) 1.23 3,015.0 12,566.4 23.99% 40.0% 1.08 2. Yahoo Finance 6. Zacks
Albemarle Corporation (NYSE:ALB) 1.41 3,449.3 11,417.4 30.21% 40.0% 1.19 3. Reuters 7. Value Line
Westlake Chemical Corporation (NYSE:WLK) 1.69 3,680.6 8,177.7 45.01% 40.0% 1.33 4. Google Finance 8. Sentieo
Ashland Global Holdings Inc. (NYSE:ASH) 0.95 3,244.0 7,507.1 43.21% 40.0% 0.75
Huntsman Corporation (NYSE:HUN) 2.61 4,556.0 5,390.2 84.52% 40.0% 1.73
Trinseo S.A. (NYSE:TSE) 1.55 1,190.9 3,087.8 38.57% 40.0% 1.26
PolyOne Corporation (NYSE:POL) 1.60 1,259.5 2,767.4 45.51% 40.0% 1.26
13.0
Mean 1.49 38.04% 1.20 53.09% 57.05% 61.01% 64.97% 68.93%
Median 1.48 34.39% 1.23 32.07% 8.78%
36.03% 8.36%
Calculation of Relevered Beta Mean Median Maximum Target 39.99% 7.94%
Unlevered Unlevered of Mean Target Marginal Relevered 43.95% 7.52%
Beta Beta and Median Debt/Equity Tax Rate Beta 47.91% 7.10%
1.20 1.23 1.23 63.91% 40.0% 1.70
Eastman Chemical Company (NYSE:EMN)
WACC as a Function of Capital Structure
Equity-to-Total Capitalization
Historical Period WACC Calculation
Debt-to-Total
Capitalization
11. WACC Sensitivity Analysis
Calculation of Weighted Average Cost of Capital
Sensitivity Analysis Tables numbered in logical order of analysis.
12.0 10.0
11.79% 11.90% 12.01% 12.12% 12.23% 1.79% 2.10% 2.41% 2.72% 3.03%
1.53% 7.79% 7.86% 7.92% 7.99% 8.05% 1.75 7.74% 7.93% 8.12% 8.31% 8.50%
1.49% 7.78% 7.84% 7.91% 7.98% 8.04% 1.72 7.63% 7.82% 8.01% 8.20% 8.39%
1.46% 7.77% 7.83% 7.90% 7.96% 8.03% 1.69 7.53% 7.72% 7.90% 8.09% 8.28%
1.43% 7.75% 7.82% 7.88% 7.95% 8.02% 1.66 7.42% 7.61% 7.80% 7.99% 8.17%
1.39% 7.74% 7.81% 7.87% 7.94% 8.00% 1.63 7.31% 7.50% 7.69% 7.88% 8.07%
11.0 9.0
5.49% 5.59% 5.69% 5.79% 5.89% 2.20% 2.32% 2.43% 2.54% 2.66%
1.75 7.91% 8.01% 8.13% 8.23% 8.34% 45.00% 7.70% 7.72% 7.74% 7.77% 7.79%
1.72 7.80% 7.91% 8.02% 8.12% 8.23% 42.50% 7.78% 7.81% 7.84% 7.86% 7.89%
1.69 7.70% 7.80% 7.91% 8.01% 8.12% 40.00% 7.87% 7.90% 7.93% 7.95% 7.98%
1.66 7.59% 7.69% 7.80% 7.90% 8.01% 37.50% 7.96% 7.99% 8.02% 8.05% 8.07%
1.63 7.49% 7.59% 7.69% 7.79% 7.90% 35.00% 8.05% 8.08% 8.11% 8.14% 8.17%
8.0 6.0
1.70% 2.01% 2.32% 2.63% 2.94% 1.79% 2.10% 2.41% 2.72% 3.03%
8.30% 8.44% 8.30% 8.17% 8.04% 7.91% 1.75 11.76% 12.07% 12.38% 12.69% 13.00%
8.20% 8.34% 8.21% 8.07% 7.94% 7.81% 1.72 11.58% 11.89% 12.20% 12.51% 12.82%
8.10% 8.23% 8.09% 7.96% 7.83% 7.70% 1.69 11.41% 11.72% 12.03% 12.34% 12.65%
8.00% 8.10% 7.97% 7.84% 7.71% 7.58% 1.66 11.23% 11.54% 11.85% 12.16% 12.47%
7.90% 7.97% 7.84% 7.71% 7.58% 7.44% 1.63 11.05% 11.36% 11.67% 11.98% 12.29%
7.0 5.0
5.49% 5.59% 5.69% 5.79% 5.89% 1.79% 2.10% 2.41% 2.72% 3.03%
1.75 12.03% 12.20% 12.39% 12.57% 12.75% 8.30% 12.83% 12.62% 12.40% 12.18% 11.97%
1.72 11.86% 12.03% 12.21% 12.39% 12.56% 8.20% 12.68% 12.46% 12.24% 12.03% 11.81%
1.69 11.68% 11.86% 12.03% 12.21% 12.38% 8.10% 12.49% 12.27% 12.05% 11.84% 11.62%
1.66 11.51% 11.68% 11.86% 12.02% 12.19% 8.00% 12.28% 12.06% 11.85% 11.63% 11.42%
1.63 11.34% 11.51% 11.68% 11.84% 12.01% 7.90% 12.05% 11.83% 11.62% 11.40% 11.19%
Relevered
Beta
Cost of Equity as a Function of Risk Free Rate and Market Rate of Return
Risk Free Rate
Expected
MarketRate
ofReturn
Cost of Equity as a Function of Market Risk Premium and Relevered Beta
Market Risk Premium
WACC as a Function of Cost of Equity and After Tax Cost of Debt
Cost of Common Equity
After-TaxCost
ofDebt
Risk Free Rate
Relevered
Beta
Risk Free Rate
Expected
MarketRate
ofReturn
WACC as a Function of Risk Free Rate and Relevered Beta
Risk Free Rate
Relevered
Beta
WACC as a Function of Market Risk Premium and Relevered Beta
Market Risk Premium
Relevered
Beta
WACC as a Function of Risk Free Rate and Market Rate of Return
WACC as a Function of Pre-Tax Cost of Debt and Tax Rate
Pre-Tax Cost of Debt
Target
MarginalTax
Rate
Cost of Equity as a Function of Risk Free Rate and Relevered Beta
Eastman Chemical Company (NYSE:EMN)
14. Assumptions CAGR CAGR
Operating Scenario 1 2013 A 2014 A 2015 A ('13-'15) 2016 E 2017 E 2018 E 2019 E 2020 E 2021 E ('16-'21)
#DIV/0! #DIV/0!
Balance Sheet Assumptions Inventories
Days Inventory Held (DIH) 74.0 72.8 82.8 82.8 82.8 82.8 82.8 82.8 82.8
Base 1 74.0 72.8 82.8 82.8 82.8 82.8 82.8 82.8 82.8
Management 2
Upside 3 74.0 72.8 82.8 82.8 82.8 82.8 82.8 82.8 82.8
Downside 1 4 74.0 72.8 82.8 82.8 82.8 82.8 82.8 82.8 82.8
Downside 2 5 74.0 72.8 82.8 82.8 82.8 82.8 82.8 82.8 82.8
Other current assets
Prepaid and Other CA (% Revenue) 2.68% 2.62% 0.70% 0.70% 0.70% 0.70% 0.70% 0.70% 0.70%
Base 1 2.68% 2.62% 0.70% 0.70% 0.70% 0.70% 0.70% 0.70% 0.70%
Management 2
Upside 3 2.68% 2.62% 0.70% 0.70% 0.70% 0.70% 0.70% 0.70% 0.70%
Downside 1 4 2.68% 2.62% 0.70% 0.70% 0.70% 0.70% 0.70% 0.70% 0.70%
Downside 2 5 2.68% 2.62% 0.70% 0.70% 0.70% 0.70% 0.70% 0.70% 0.70%
Payables and other current liabilities
Days Payable Outstanding (DPO) 83.0 83.8 92.7 92.7 92.7 92.7 92.7 92.7 92.7
Base 1 83.0 83.8 92.7 92.7 92.7 92.7 92.7 92.7 92.7
Management 2
Upside 3 83.0 83.8 92.7 92.7 92.7 92.7 92.7 92.7 92.7
Downside 1 4 83.0 83.8 92.7 92.7 92.7 92.7 92.7 92.7 92.7
Downside 2 5 83.0 83.8 92.7 92.7 92.7 92.7 92.7 92.7 92.7
Short-term time deposits
Prepaid and Other CA (% Revenue) 0.00% 0.00% 0.00% 0.00% 0.00% 0.00% 0.00% 0.00% 0.00%
Base 1 0.00% 0.00% 0.00% 0.00% 0.00% 0.00% 0.00% 0.00% 0.00%
Management 2
Upside 3 0.00% 0.00% 0.00% 0.00% 0.00% 0.00% 0.00% 0.00% 0.00%
Downside 1 4 0.00% 0.00% 0.00% 0.00% 0.00% 0.00% 0.00% 0.00% 0.00%
Downside 2 5 0.00% 0.00% 0.00% 0.00% 0.00% 0.00% 0.00% 0.00% 0.00%
Historical Period
Eastman Chemical Company (NYSE:EMN)
Projection Period
15. Assumptions CAGR CAGR
Operating Scenario 1 2013 A 2014 A 2015 A ('13-'15) 2016 E 2017 E 2018 E 2019 E 2020 E 2021 E ('16-'21)
Not required. #VALUE! #DIV/0!
Balance Sheet Assumptions Company Specific Line Item
(% Revenue) NA NA NA NA NA NA NA NA NA
Base 1 NA NA NA NA NA NA NA NA NA
Management 2
Upside 3 NA NA NA NA NA NA NA NA NA
Downside 1 4 NA NA NA NA NA NA NA NA NA
Downside 2 5 NA NA NA NA NA NA NA NA NA
Not required.
Company Specific Line Item
(% Revenue) NA NA NA NA NA NA NA NA NA
Base 1 NA NA NA NA NA NA NA NA NA
Management 2
Upside 3 NA NA NA NA NA NA NA NA NA
Downside 1 4 NA NA NA NA NA NA NA NA NA
Downside 2 5 NA NA NA NA NA NA NA NA NA
Not required.
Company Specific Line Item
(% Revenue) NA NA NA NA NA NA NA NA NA
Base 1 NA NA NA NA NA NA NA NA NA
Management 2
Upside 3 NA NA NA NA NA NA NA NA NA
Downside 1 4 NA NA NA NA NA NA NA NA NA
Downside 2 5 NA NA NA NA NA NA NA NA NA
Not required.
Company Specific Line Item
(% Revenue) NA NA NA NA NA NA NA NA NA
Base 1 NA NA NA NA NA NA NA NA NA
Management 2
Upside 3 NA NA NA NA NA NA NA NA NA
Downside 1 4 NA NA NA NA NA NA NA NA NA
Downside 2 5 NA NA NA NA NA NA NA NA NA
Projection PeriodHistorical Period
Eastman Chemical Company (NYSE:EMN)
17. Consolidated Statements of Income
Values in Millions USD except per-share data (0.028%)
Historical Period CAGR Projection Period CAGR
2011 A 2012 A 2013 A 2014 A 2015 A ('11-'15) 2016 E 2017 E 2018 E 2019 E 2020 E 2021 E ('16-'21)
Sales 7,178.0 8,102.0 9,350.0 9,527.0 9,648.0 7.67% 9,841.0 10,057.5 10,308.9 10,563.8 10,822.0 11,083.6 2.41%
Growth (%) NA 12.87% 15.40% 1.89% 1.27% NA 2.00% 2.20% 2.50% 2.47% 2.44% 2.42% 3.86%
Cost of sales 5,336.0 5,980.0 6,141.0 6,856.0 6,497.0 5.04% 6,724.1 6,872.0 7,043.8 7,218.0 7,394.4 7,573.2 2.41%
COGS as a Percentage of Sales 74.34% 73.81% 65.68% 71.96% 67.34% (2.44%) 68.33% 68.33% 68.33% 68.33% 68.33% 68.33% 0.00%
Gross profit 1,842.0 2,122.0 3,209.0 2,671.0 3,151.0 14.36% 3,116.8 3,185.4 3,265.1 3,345.8 3,427.6 3,510.4 2.41%
Gross profit margin (%) 25.66% 26.19% 34.32% 28.04% 32.66% 6.21% 31.67% 31.67% 31.67% 31.67% 31.67% 31.67% (0.00%)
Operating Expenses
Selling, general and administrative expenses 481.0 644.0 645.0 755.0 762.0 777.2 794.3 814.2 834.3 854.7 875.4
SG&A as a Percentage of Sales 6.70% 7.95% 6.90% 7.92% 7.90% 7.90% 7.90% 7.90% 7.90% 7.90% 7.90%
Research and development expenses 159.0 198.0 193.0 227.0 251.0 256.0 261.7 268.2 274.8 281.5 288.3
R&D as a Percentage of Sales 2.22% 2.44% 2.06% 2.38% 2.60% 2.60% 2.60% 2.60% 2.60% 2.60% 2.60%
Asset impairments and restructuring charges, net (8.0) 120.0 76.0 77.0 183.0 186.7 190.8 195.5 200.4 205.3 210.2
Asset Impairments & Restructuring as a Percentage of Sales (0.11%) 1.48% 0.81% 0.81% 1.90% 1.90% 1.90% 1.90% 1.90% 1.90% 1.90%
Total Operating Expenses 632.0 962.0 914.0 1,059.0 1,196.0 17.29% 1,219.9 1,246.8 1,277.9 1,309.5 1,341.5 1,374.0 2.41%
Total Operating Expenses as a Percentage of Sales 8.80% 11.87% 9.78% 11.12% 12.40% 12.40% 12.40% 12.40% 12.40% 12.40% 12.40%
Operating earnings 1,210.0 1,160.0 2,295.0 1,612.0 1,955.0 12.74% 1,896.9 1,938.7 1,987.1 2,036.3 2,086.0 2,136.5 2.41%
Other (income) charges, net (20.0) 8.0 3.0 (15.0) (8.0) (9.8) (10.1) (10.3) (10.6) (10.8) (11.1)
Other (income) charges as a Percentage of Sales (0.28%) 0.10% 0.03% (0.16%) (0.08%) (0.10%) (0.10%) (0.10%) (0.10%) (0.10%) (0.10%)
EBITDA 1,230.0 1,152.0 2,292.0 1,627.0 1,963.0 12.40% 1,906.8 1,948.7 1,997.4 2,046.8 2,096.9 2,147.5 2.41%
EBITDA Margin (%) 17.14% 14.22% 24.51% 17.08% 20.35% 19.38% 19.38% 19.38% 19.38% 19.38% 19.38%
Depreciation and Amortization 273.0 360.0 433.0 450.0 571.0 579.5 646.0 712.8 779.7 846.7 913.8
D&A as a Percentage of Sales 3.80% 4.44% 4.63% 4.72% 5.92% 5.89% 6.42% 6.91% 7.38% 7.82% 8.24%
EBIT 957.0 792.0 1,859.0 1,177.0 1,392.0 9.82% 1,327.3 1,302.7 1,284.6 1,267.1 1,250.1 1,233.8 (1.45%)
EBIT Margin (%) 13.33% 9.78% 19.88% 12.35% 14.43% 13.49% 12.95% 12.46% 11.99% 11.55% 11.13%
Net interest expense 76.0 143.0 180.0 187.0 263.0 180.4 176.1 171.0 165.9 160.7 155.4
Other (Income) Charges as a Percentage of Sales 1.06% 1.76% 1.93% 1.96% 2.73% 1.83% 1.75% 1.66% 1.57% 1.49% 1.40%
Earnings from continuing operations before income taxes (EBT) 881.0 649.0 1,679.0 990.0 1,129.0 6.40% 1,146.8 1,126.5 1,113.6 1,101.2 1,089.4 1,078.4 (1.22%)
EBT Margin (%) 12.27% 8.01% 17.96% 10.39% 11.70% 11.65% 11.20% 10.80% 10.42% 10.07% 9.73%
Provision for income taxes from continuing operations 274.0 206.0 507.0 235.0 275.0 279.3 274.4 271.3 268.2 265.4 262.7
Effective Tax Rate (%) 31.10% 31.74% 30.20% 23.74% 24.36% 24.36% 24.36% 24.36% 24.36% 24.36% 24.36%
Earnings from continuing operations 607.0 443.0 1,172.0 755.0 854.0 8.91% 867.5 852.1 842.4 833.0 824.1 815.7 (1.22%)
Earnings from discontinued operations, net of tax 9.0 0.0 0.0 2.0 0.0 0.0 0.0 0.0 0.0 0.0 0.0
Gain from disposal of discontinued operations, net of tax 31.0 1.0 0.0 0.0 0.0 0.0 0.0 0.0 0.0 0.0 0.0
Net earnings 647.0 444.0 1,172.0 757.0 854.0 867.5 852.1 842.4 833.0 824.1 815.7
Net earnings attributable to noncontrollig interest 1.0 7.0 7.0 6.0 6.0 6.1 6.0 5.9 5.9 5.8 5.7
NCI as a Percentage of Net earnings 0.15% 1.58% 0.60% 0.79% 0.70% 0.70% 0.70% 0.70% 0.70% 0.70% 0.70%
Net earnings attributable to Eastman stockholders 646.0 437.0 1,165.0 751.0 848.0 7.04% 861.4 846.1 836.5 827.1 818.3 810.0 (1.22%)
Amounts attributable to Eastman stockholders
Earnings from continuing operations, net of tax 606.0 436.0 1,165.0 749.0 848.0 861.4 846.1 836.5 827.1 818.3 810.0
Earnings from discontinued operations, net of tax 40.0 1.0 0.0 2.0 0.0 0.0 0.0 0.0 0.0 0.0 0.0
Net earnings attributable to Eastman stockholders 646.0 437.0 1,165.0 751.0 848.0 7.04% 861.4 846.1 836.5 827.1 818.3 810.0 (1.22%)
Earnings Per Share
Basic earnings per share attributable to Eastman
Earnings from continuing operations 4.34 2.99 7.57 5.01 5.71 5.87 5.83 5.82 5.78 5.75 5.72
Earnings from discontinued operations 0.29 0.01 0.00 0.02 0.00 0.00 0.00 0.00 0.00 0.00 0.00
Basic earnings per share attributable to Eastman 4.63 3.00 7.57 5.03 5.71 5.38% 5.87 5.83 5.82 5.78 5.75 5.72 (0.52%)
Diluted earnings per share attributable to Eastman
Earnings from continuing operations 4.24 2.92 7.44 4.95 5.66 5.87 5.83 5.82 5.78 5.75 5.72
Earnings from discontinued operations 0.28 0.01 0.00 0.02 0.00 0.00 0.00 0.00 0.00 0.00 0.00
Diluted earnings per share attributable to Eastman 4.52 2.93 7.44 4.97 5.66 5.78% 5.87 5.83 5.82 5.78 5.75 5.72 (0.52%)
Shares Outstanding
Basic 139.5 145.7 153.9 149.3 148.5 1.57% 146.8 145.2 143.8 143.1 142.4 141.6 (0.71%)
Diluted 142.9 149.1 156.6 151.1 149.8 1.19% 146.8 145.2 143.8 143.1 142.4 141.6 (0.71%)
Percent Change in Shares Outstanding
Basic NA 4.40% 5.65% (2.98%) (0.53%) NA (1.19%) (1.03%) (1.00%) (0.50%) (0.50%) (0.50%) (15.86%)
Diluted NA 4.36% 4.99% (3.50%) (0.85%) NA NA
Eastman Chemical Company (NYSE: EMN)
18. Consolidated Statements of Cash Flows
Values in Millions USD except per-share data
Historical Period CAGR Projection Period CAGR
2011 A 2012 A 2013 A 2014 A 2015 A ('11-'15) 2016 E 2017 E 2018 E 2019 E 2020 E 2021 E ('16-'21)
Operating activities
Net earnings including noncontrolling interest 647.0 444.0 1,172.0 757.0 854.0 7.19% 867.5 852.1 842.4 833.0 824.1 815.7 (1.22%)
Adjustments to reconcile net earnings to net cash provided by operating activities:
Depreciation and amortization 273.0 360.0 433.0 450.0 571.0 579.5 646.0 712.8 779.7 846.7 913.8
Asset impairment charges 0.0 46.0 28.0 52.0 107.0 0.0 0.0 0.0 0.0 0.0 0.0
Gains on sale of assets (70.0) 0.0 0.0 (5.0) 0.0 0.0 0.0 0.0 0.0 0.0 0.0
Provision for deferred income taxes (22.0) 48.0 331.0 99.0 107.0 0.0 112.9 75.1 41.6 11.6 (15.7)
Mark-to-market (gain) loss on pension and other postretirement benefit plans 147.0 247.0 (383.0) 304.0 115.0 0.0 0.0 0.0 0.0 0.0 0.0
Changes in operating assets and liabilities, net of effect of acquisitions and divestitures:
(Increase) decrease in trade receivables (73.0) 48.0 (38.0) 19.0 114.0 (103.4) (25.1) (29.2) (29.6) (30.0) (30.3)
(Increase) decrease in inventories (156.0) 38.0 (6.0) (61.0) (26.0) (67.2) (34.0) (39.5) (40.0) (40.6) (41.1)
Increase (decrease) in trade payables (51.0) 10.0 (2.0) (30.0) (102.0) 106.5 38.1 44.2 44.8 45.4 46.0
Pension and other postretirement contributions (in excess of) less than expenses (103.0) (97.0) (149.0) (165.0) (259.0) 0.0 0.0 0.0 0.0 0.0 0.0
Variable compensation (in excess of) less than expenses 15.0 26.0 82.0 27.0 71.0 0.0 0.0 0.0 0.0 0.0 0.0
Other items, net 18.0 (42.0) (171.0) (39.0) 60.0 (1.4) (1.5) (1.8) (1.8) (1.8) (1.8)
Net cash provided by operating activities 625.0 1,128.0 1,297.0 1,408.0 1,612.0 26.73% 1,381.5 1,588.5 1,604.1 1,627.7 1,655.5 1,686.6 4.07%
Investing activities
Additions to properties and equipment (Capex) (457.0) (465.0) (483.0) (593.0) (652.0) (665.0) (665.4) (667.5) (669.1) (670.1) (670.6)
Capex as a Percentage of Sales 6.37% 5.74% 5.17% 6.22% 6.76% 6.76% 6.62% 6.48% 6.33% 6.19% 6.05%
Proceeds from redemption of short-term time deposits 0.0 200.0 0.0 0.0 0.0 0.0 0.0 0.0 0.0 0.0 0.0
Proceeds from sale of assets and investments 651.0 7.0 31.0 13.0 4.0 0.0 0.0 0.0 0.0 0.0 0.0
Acquisitions and investments in joint ventures, net of cash acquired (156.0) (2,669.0) 0.0 (3,509.0) (45.0) 0.0 0.0 0.0 0.0 0.0 0.0
Additions to short-term time deposits (200.0) 0.0 0.0 0.0 0.0 0.0 0.0 0.0 0.0 0.0 0.0
Additions to capitalized software (9.0) (5.0) (5.0) (3.0) 0.0 0.0 0.0 0.0 0.0 0.0 0.0
Other items, net 29.0 (30.0) 0.0 1.0 0.0 0.0 0.0 0.0 0.0 0.0 0.0
Net cash used in investing activities (142.0) (2,962.0) (457.0) (4,091.0) (693.0) 48.63% (665.0) (665.4) (667.5) (669.1) (670.1) (670.6) 0.17%
Financing activities
Net increase (decrease) in commercial paper and other borrowings 1.0 (1.0) 425.0 (190.0) 195.0 0.0 0.0 0.0 0.0 0.0 0.0
Proceeds from borrowings (36.0) 3,511.0 150.0 3,565.0 250.0 0.0 0.0 0.0 0.0 0.0 0.0
Repayment of borrowings (2.0) (1,866.0) (1,105.0) (125.0) (950.0) 0.0 0.0 0.0 0.0 0.0 0.0
Net Borrowings (38.0) 1,645.0 (955.0) 3,440.0 (700.0) 0.0 0.0 0.0 0.0 0.0 0.0
Dividends paid to stockholders (136.0) (192.0) (140.0) (210.0) (238.0) (263.4) (287.0) (307.4) (325.0) (337.3) (343.7)
Treasury stock purchases (316.0) 0.0 (238.0) (410.0) (103.0) (108.3) (110.6) (113.4) (116.2) (119.0) (121.9)
Treasury stock purchases as a % of Sales 4.40% 0.00% 2.55% 4.30% 1.07% 1.10% 1.10% 1.10% 1.10% 1.10% 1.10%
Dividends paid to noncontrolling interests (3.0) (4.0) (10.0) (9.0) (6.0) (6.0) (6.0) (6.0) (6.0) (6.0) (6.0)
Dividends as a % of NCI 9.68% 4.71% 12.66% 11.25% 7.50% 7.50% 7.50% 7.50% 7.50% 7.50% 7.50%
Proceeds from stock option exercises and other items, net 69.0 56.0 59.0 43.0 20.0 0.0 0.0 0.0 0.0 0.0 0.0
Net cash (used in) provided by financing activities (423.0) 1,504.0 (859.0) 2,664.0 (832.0) 18.43% (377.7) (403.7) (426.8) (447.2) (462.3) (471.6) 4.54%
Effect of exchange rate changes on cash and cash equivalents 1.0 2.0 7.0 (4.0) (8.0) NA 0.0 0.0 0.0 0.0 0.0 0.0 NA
Net change in cash and cash equivalents 61.0 (328.0) (12.0) (23.0) 79.0 6.68% 338.8 519.4 509.8 511.5 523.1 544.3 9.95%
Cash and cash equivalents at beginning of period 516.0 577.0 249.0 237.0 214.0 (19.75%) 293.0 631.8 1,151.2 1,661.0 2,172.5 2,695.5 55.87%
Cash and cash equivalents at end of period 577.0 249.0 237.0 214.0 293.0 (15.58%) 631.8 1,151.2 1,661.0 2,172.5 2,695.5 3,239.9 38.67%
Eastman Chemical Company (NYSE: EMN)
19. Consolidated Balance Sheets
Values in Millions USD except per-share data
Historical Period CAGR Projection Period CAGR
ASSETS 2011 A 2012 A 2013 A 2014 A 2015 A ('11-'15) 2016 E 2017 E 2018 E 2019 E 2020 E 2021 E ('16-'21)
Current assets
Cash and cash equivalents 577.0 249.0 237.0 214.0 293.0 (15.58%) 631.8 1,151.2 1,661.0 2,172.5 2,695.5 3,239.9 38.67%
Short-term time deposits 200.0 0.0 0.0 0.0 0.0 0.0 0.0 0.0 0.0 0.0 0.0
Trade receivables, net 632.0 846.0 880.0 936.0 792.0 881.3 900.7 923.2 946.0 969.1 992.6
Miscellaneous receivables 72.0 151.0 208.0 264.0 246.0 260.1 265.8 272.5 279.2 286.0 292.9
Inventories 779.0 1,260.0 1,264.0 1,509.0 1,479.0 1,546.2 1,580.2 1,619.7 1,659.8 1,700.4 1,741.5
Other current assets 42.0 193.0 251.0 250.0 68.0 69.4 70.9 72.7 74.5 76.3 78.1
Total current assets 2,302.0 2,699.0 2,840.0 3,173.0 2,878.0 5.74% 3,388.8 3,968.8 4,549.0 5,132.0 5,727.4 6,345.0 13.36%
Properties
Properties and equipment at cost 8,383.0 9,681.0 9,958.0 11,026.0 11,234.0 7.59% 11,899.0 12,564.5 13,232.0 13,901.1 14,571.2 15,241.8 5.08%
Less: Accumulated depreciation 5,276.0 5,500.0 5,668.0 5,939.0 6,104.0 3.71% 6,683.5 7,329.6 8,042.4 8,822.1 9,668.8 10,582.6 9.63%
Accumulated Depreciation Percentage 62.94% 56.81% 56.92% 53.86% 54.34% 56.17% 58.34% 60.78% 63.46% 66.36% 69.43%
Net properties 3,107.0 4,181.0 4,290.0 5,087.0 5,130.0 13.36% 5,215.5 5,234.9 5,189.6 5,079.0 4,902.4 4,659.3 (2.23%)
Goodwill 406.0 2,644.0 2,637.0 4,486.0 4,518.0 4,518.0 4,518.0 4,518.0 4,518.0 4,518.0 4,518.0
Intangible assets, net of accumulated amortization 101.0 1,849.0 1,781.0 2,905.0 2,650.0 2,650.0 2,650.0 2,650.0 2,650.0 2,650.0 2,650.0
Other noncurrent assets 268.0 337.0 297.0 421.0 435.0 435.0 435.0 435.0 435.0 435.0 435.0
Total assets 6,184.0 11,710.0 11,845.0 16,072.0 15,611.0 26.05% 16,207.3 16,806.8 17,341.7 17,814.0 18,232.8 18,607.2 2.80%
LIABILITIES
Current liabilities
Payables and other current liabilities 961.0 1,360.0 1,470.0 1,721.0 1,625.0 14.03% 1,731.5 1,769.6 1,813.8 1,858.7 1,904.1 1,950.1 2.41%
Borrowings due within one year 153.0 4.0 0.0 301.0 431.0 29.55% 431.0 431.0 431.0 431.0 431.0 431.0 0.00%
Total current liabilities 1,114.0 1,364.0 1,470.0 2,022.0 2,056.0 16.56% 2,162.5 2,200.6 2,244.8 2,289.7 2,335.1 2,381.1 1.94%
Long-term borrowings 1,445.0 4,779.0 4,254.0 7,248.0 6,608.0 6,608.0 6,608.0 6,608.0 6,608.0 6,608.0 6,608.0
Deferred income tax liabilities 210.0 182.0 496.0 946.0 928.0 928.0 1,040.9 1,116.0 1,157.6 1,169.2 1,153.6
Post-employment obligations 1,411.0 1,856.0 1,297.0 1,498.0 1,297.0 1,297.0 1,297.0 1,297.0 1,297.0 1,297.0 1,297.0
Other long-term liabilities 103.0 501.0 453.0 768.0 701.0 701.0 701.0 701.0 701.0 701.0 701.0
Total liabilities 4,283.0 8,682.0 7,970.0 12,482.0 11,590.0 28.26% 11,696.5 11,847.5 11,966.8 12,053.3 12,110.3 12,140.7 0.75%
Stockholders' equity
Common stock 2.0 2.0 2.0 2.0 2.0 2.0 2.0 2.0 2.0 2.0 2.0
Additional paid-in capital 900.0 1,709.0 1,778.0 1,817.0 1,863.0 1,863.0 1,863.0 1,863.0 1,863.0 1,863.0 1,863.0
Retained earnings 2,760.0 3,038.0 4,012.0 4,545.0 5,146.0 5,744.1 6,303.1 6,832.1 7,334.2 7,815.0 8,281.0
Accumulated other comprehensive loss 138.0 123.0 171.0 (277.0) (390.0) (390.0) (390.0) (390.0) (390.0) (390.0) (390.0)
Total stockholders' equity before treasury stock 3,800.0 4,872.0 5,963.0 6,087.0 6,621.0 7,219.1 7,778.1 8,307.1 8,809.2 9,290.0 9,756.0
Less: Treasury stock at cost 1,930.0 1,929.0 2,167.0 2,577.0 2,680.0 2,788.3 2,898.9 3,012.3 3,128.5 3,247.5 3,369.4
Total Eastman stockholders' equity 1,870.0 2,943.0 3,796.0 3,510.0 3,941.0 4,430.8 4,879.3 5,294.9 5,680.7 6,042.4 6,386.6
Noncontrolling interest 31.0 85.0 79.0 80.0 80.0 80.0 80.0 80.0 80.0 80.0 80.0
Total equity 1,901.0 3,028.0 3,875.0 3,590.0 4,021.0 20.60% 4,510.8 4,959.3 5,374.9 5,760.7 6,122.4 6,466.6 7.47%
Total liabilities and stockholders' equity 6,184.0 11,710.0 11,845.0 16,072.0 15,611.0 26.05% 16,207.3 16,806.8 17,341.7 17,814.0 18,232.8 18,607.2 2.80%
Balance 0.0 0.0 0.0 0.0 0.0 0.0 0.0 0.0 0.0 0.0 0.0
Eastman Chemical Company (NYSE: EMN)
20. Operating Working Capital Schedule
Values in Millions USD except per-share data
Historical Period CAGR Projection Period CAGR
Income Statement Data 2011 A 2012 A 2013 A 2014 A 2015 A ('11-'15) 2016 E 2017 E 2018 E 2019 E 2020 E 2021 E ('16-'21)
Sales 7,178.0 8,102.0 9,350.0 9,527.0 9,648.0 7.67% 9,841.0 10,057.5 10,308.9 10,563.8 10,822.0 11,083.6 2.41%
Cost of sales 5,336.0 5,980.0 6,141.0 6,856.0 6,497.0 5.04% 6,724.1 6,872.0 7,043.8 7,218.0 7,394.4 7,573.2 2.41%
Balance Sheet Data
Current Assets
Short-term time deposits 200.0 0.0 0.0 0.0 0.0 0.0 0.0 0.0 0.0 0.0 0.0
Trade receivables, net 632.0 846.0 880.0 936.0 792.0 5.80% 881.3 900.7 923.2 946.0 969.1 992.6 2.41%
Miscellaneous receivables 72.0 151.0 208.0 264.0 246.0 35.96% 260.1 265.8 272.5 279.2 286.0 292.9 2.41%
Inventories 779.0 1,260.0 1,264.0 1,509.0 1,479.0 17.38% 1,546.2 1,580.2 1,619.7 1,659.8 1,700.4 1,741.5 2.41%
Other current assets 42.0 193.0 251.0 250.0 68.0 12.80% 69.4 70.9 72.7 74.5 76.3 78.1 2.41%
Total current assets 1,725.0 2,450.0 2,603.0 2,959.0 2,585.0 10.64% 2,757.0 2,817.6 2,888.1 2,959.5 3,031.8 3,105.1 2.41%
Current Liabilities
Payables and other current liabilities 961.0 1,360.0 1,470.0 1,721.0 1,625.0 14.03% 1,731.5 1,769.6 1,813.8 1,858.7 1,904.1 1,950.1 2.41%
Total Operating Working Capital 764.0 1,090.0 1,133.0 1,238.0 960.0 5.88% 1,025.5 1,048.0 1,074.2 1,100.8 1,127.7 1,155.0 2.41%
Change in Total Operating Working Capital NA (326.0) (43.0) (105.0) 278.0 NA (65.5) (22.6) (26.2) (26.6) (26.9) (27.3) (16.08%)
Match
Assumptions Assumptions
Short-term deposits (% Sales) 2.79% 0.00% 0.00% 0.00% 0.00% 0.00% 0.00% 0.00% 0.00% 0.00% 0.00%
Days Sales Outstanding: Trade receivables, net NA 32.8 33.2 34.3 32.2 32.2 32.2 32.2 32.2 32.2 32.2
Days Sales Outstanding: Miscellaneous receivables NA 5.0 6.9 8.9 9.5 9.5 9.5 9.5 9.5 9.5 9.5
Days Inventory Outstanding NA 61.4 74.0 72.8 82.8 82.8 82.8 82.8 82.8 82.8 82.8
Other Current Assets (% Sales) 0.59% 2.38% 2.68% 2.62% 0.70% 0.70% 0.70% 0.70% 0.70% 0.70% 0.70%
Days Payable Outstanding: Payables and Other Current Liabilities NA 69.9 83.0 83.8 92.7 92.7 92.7 92.7 92.7 92.7 92.7
Eastman Chemical Company (NYSE: EMN)
21. Depreciation Schedule
Values in Millions USD except per-share data
Historical Period CAGR Projection Period CAGR
2011 A 2012 A 2013 A 2014 A 2015 A ('11-'15) 2016 E 2017 E 2018 E 2019 E 2020 E 2021 E ('16-'21)
Net properties, End of the Year, and Beginning of 2016 3,107.0 4,181.0 4,290.0 5,087.0 5,130.0 13.36% 5,130.0 (100.00%)
Additions to properties and equipment (Capex) 457.0 465.0 483.0 593.0 652.0 665.0 665.4 667.5 669.1 670.1 670.6
Book (GAAP) Depreciation: Useful Lives and Depreciation
PP&E Years 10.0
Capex Years 10.0 10.0 10.0 10.0 10.0 10.0
Book (GAAP) Depreciation: Straight-Line
Existing PP&E 513.0 513.0 513.0 513.0 513.0 513.0
2016 Capex 66.5 66.5 66.5 66.5 66.5 66.5
2017 Capex 66.5 66.5 66.5 66.5 66.5
2018 Capex 66.8 66.8 66.8 66.8
2019 Capex 66.9 66.9 66.9
2020 Capex 67.0 67.0
2021 Capex 67.1
Total Book Depreciation 273.0 360.0 433.0 450.0 571.0 20.26% 579.5 646.0 712.8 779.7 846.7 913.8 9.54%
Accelerated Depreciation (%): MACRS (For Tax Purposes)
Existing PP&E 10.00% 18.00% 14.40% 11.52% 9.22% 7.37%
2016 Capex 10.00% 18.00% 14.40% 11.52% 9.22% 7.37%
2017 Capex 10.00% 18.00% 14.40% 11.52% 9.22%
2018 Capex 10.00% 18.00% 14.40% 11.52%
2019 Capex 10.00% 18.00% 14.40%
2020 Capex 10.00% 18.00%
2021 Capex 10.00%
Accelerated Depreciation: MACRS
Existing PP&E 513.0 923.4 738.7 591.0 473.0 378.1
2016 Capex 66.5 119.7 95.8 76.6 61.3 49.0
2017 Capex 66.5 119.8 95.8 76.7 61.4
2018 Capex 66.8 120.2 96.1 76.9
2019 Capex 66.9 120.4 96.3
2020 Capex 67.0 120.6
2021 Capex 67.1
Total Tax Depreciation 579.5 1,109.7 1,021.0 950.5 894.5 849.4 7.95%
Difference in Depreciation 0.0 463.6 308.2 170.8 47.8 (64.4)
Effective Tax Rate (%) 24.36% 24.36% 24.36% 24.36% 24.36% 24.36%
Deferred Income Taxes 0.0 112.9 75.1 41.6 11.6 (15.7)
Eastman Chemical Company (NYSE: EMN)
22. Debt Schedule
Values in Millions USD except per-share data
Period ending December 31, Historical Period CAGR Projection Period CAGR
2011 A 2012 A 2013 A 2014 A 2015 A ('11-'15) 2016 E 2017 E 2018 E 2019 E 2020 E 2021 E ('16-'21)
Here historical figures are analyzed in order to assess NA NA
Cash Available to Pay Down Debt prior behavior; historical schedule is incomplete.
Cash at the Beginning of the Year 516.0 577.0 249.0 237.0 214.0 293.0 631.8 1,151.2 1,661.0 2,172.5 2,695.5
Cash Flow Before Debt Paydown 98.0 (1,972.0) 518.0 (3,273.0) 584.0 338.8 519.4 509.8 511.5 523.1 544.3
Minimum Cash Cushion (200.0) (200.0) (200.0) (200.0) (200.0) (200.0)
Total Cash Available to Pay Down Debt 614.0 (1,395.0) 767.0 (3,036.0) 798.0 431.8 951.2 1,461.0 1,972.5 2,495.5 3,039.9
Borrowings due within one year
Borrowings due within one year, Beginning of the Year NA 153.0 4.0 0.0 301.0 431.0 431.0 431.0 431.0 431.0 431.0
Mandatory Issuances / (Retirements) NA 0.0 0.0 0.0 0.0 0.0 0.0 0.0 0.0 0.0 0.0
Non-Mandatory Issuances / (Retirements) NA (149.0) (4.0) 301.0 130.0 0.0 0.0 0.0 0.0 0.0 0.0
Borrowings due within one year, End of the Year 153.0 4.0 0.0 301.0 431.0 431.0 431.0 431.0 431.0 431.0 431.0
Interest Expense 12.9 12.9 12.9 12.9 12.9 12.9
Interest Rate 3.00% 3.00% 3.00% 3.00% 3.00% 3.00%
Long-term borrowings
Long-term borrowings, Beginning of the Year NA 1,445.0 4,779.0 4,254.0 7,248.0 6,608.0 6,608.0 6,608.0 6,608.0 6,608.0 6,608.0
Mandatory Issuances / (Retirements) NA 0.0 0.0 0.0 0.0 0.0 0.0 0.0 0.0 0.0 0.0
Non-Mandatory Issuances / (Retirements) NA 3,334.0 (525.0) 2,994.0 (640.0) 0.0 0.0 0.0 0.0 0.0 0.0
Long-term borrowings, End of the Year 1,445.0 4,779.0 4,254.0 7,248.0 6,608.0 6,608.0 6,608.0 6,608.0 6,608.0 6,608.0 6,608.0
Interest Expense 132.2 132.2 132.2 132.2 132.2 132.2
Interest Rate 2.00% 2.00% 2.00% 2.00% 2.00% 2.00%
Post-employment obligations
Post-employment obligations, Beginning of the Year NA 1,411.0 1,856.0 1,297.0 1,498.0 1,297.0 1,297.0 1,297.0 1,297.0 1,297.0 1,297.0
Mandatory Issuances / (Retirements) NA 0.0 0.0 0.0 0.0 0.0 0.0 0.0 0.0 0.0 0.0
Non-Mandatory Issuances / (Retirements) NA 445.0 (559.0) 201.0 (201.0) 0.0 0.0 0.0 0.0 0.0 0.0
Post-employment obligations, End of the Year 1,411.0 1,856.0 1,297.0 1,498.0 1,297.0 1,297.0 1,297.0 1,297.0 1,297.0 1,297.0 1,297.0
Interest Expense 25.9 25.9 25.9 25.9 25.9 25.9
Interest Rate 2.00% 2.00% 2.00% 2.00% 2.00% 2.00%
Other long-term liabilities
Other long-term liabilities, Beginning of the Year NA 103.0 501.0 453.0 768.0 701.0 701.0 701.0 701.0 701.0 701.0
Mandatory Issuances / (Retirements) NA 0.0 0.0 0.0 0.0 0.0 0.0 0.0 0.0 0.0 0.0
Non-Mandatory Issuances / (Retirements) NA 398.0 (48.0) 315.0 (67.0) 0.0 0.0 0.0 0.0 0.0 0.0
Other long-term liabilities, End of the Year 103.0 501.0 453.0 768.0 701.0 701.0 701.0 701.0 701.0 701.0 701.0
Interest Expense 14.0 14.0 14.0 14.0 14.0 14.0
Interest Rate 2.00% 2.00% 2.00% 2.00% 2.00% 2.00%
Total Issuances / (Retirements) NA 4,028.0 (1,136.0) 3,811.0 (778.0) 0.0 0.0 0.0 0.0 0.0 0.0
Total Interest Expense 76.0 143.0 180.0 187.0 263.0 36.39% 185.1 185.1 185.1 185.1 185.1 185.1 0.00%
Cash at the End of the Year 577.0 249.0 237.0 214.0 293.0 (15.58%) 631.8 1,151.2 1,661.0 2,172.5 2,695.5 3,239.9 38.67%
Interest Income 0.0 0.0 0.0 0.0 0.0 4.6 8.9 14.1 19.2 24.3 29.7
Interest Rate 2.44% 2.00% 3.00% 1.91% 2.91% 1.00% 1.00% 1.00% 1.00% 1.00% 1.00%
Match (Yes/No) 0.0 0.0 0.0 0.0 0.0 0.0
Eastman Chemical Company (NYSE: EMN)
23. Ratio Analysis
Values in Millions USD except per-share data
Historical Period CAGR Projection Period CAGR
2011 A 2012 A 2013 A 2014 A 2015 A ('11-'15) 2016 E 2017 E 2018 E 2019 E 2020 E 2021 E ('16-'21)
Liquidity Liquidity
Working Capital 1,188.0 1,335.0 1,370.0 1,151.0 822.0 (8.80%) 1,226.3 1,768.3 2,304.2 2,842.3 3,392.3 3,963.8 26.45%
Operating Working Capital 764.0 1,090.0 1,133.0 1,238.0 960.0 5.88% 1,025.5 1,048.0 1,074.2 1,100.8 1,127.7 1,155.0 2.41%
Current Ratio 2.07 x 1.98 x 1.93 x 1.57 x 1.40 x (9.28%) 1.57 x 1.80 x 2.03 x 2.24 x 2.45 x 2.66 x 11.20%
Current Cash Debt Coverage NA 0.91 x 0.92 x 0.81 x 0.79 x 0.65 x 0.73 x 0.72 x 0.72 x 0.72 x 0.72 x 1.78%
Inventory Turnover NA 5.87 x 4.87 x 4.94 x 4.35 x 4.45 x 4.40 x 4.40 x 4.40 x 4.40 x 4.40 x (0.20%)
Days in Inventory NA 62.2 75.0 73.8 83.9 82.1 83.0 82.9 82.9 82.9 82.9 0.20%
Solvency Solvency
Debt / Assets Ratio 0.69 x 0.74 x 0.67 x 0.78 x 0.74 x 1.75% 0.72 x 0.70 x 0.69 x 0.68 x 0.66 x 0.65 x (2.00%)
Cash Debt Coverage NA 0.17 x 0.16 x 0.14 x 0.13 x 0.12 x 0.13 x 0.13 x 0.14 x 0.14 x 0.14 x 3.23%
Interest Coverage Ratio NA 7.99 8.21 8.27 5.71 6.13 7.38 7.45 7.57 7.71 7.86 5.08%
Times Interest Earned 13.12 x 5.55 x 10.33 x 6.30 x 5.29 x (20.30%) 7.36 x 7.40 x 7.51 x 7.64 x 7.78 x 7.94 x 1.54%
Free Cash Flow 29.0 467.0 664.0 596.0 716.0 122.91% 447.0 630.1 623.2 627.7 642.1 666.2 8.31%
Unlevered Free Cash Flow (Approx. Due to Tax Differences) 499.0 155.0 1,259.0 694.0 1,314.0 27.39% 896.9 986.3 1,032.5 1,083.0 1,134.5 1,187.0 5.76%
Profitability Profitability
Quality of Earnings Ratio 0.97 x 2.54 x 1.11 x 1.86 x 1.89 x 18.23% 1.59 x 1.86 x 1.90 x 1.95 x 2.01 x 2.07 x 5.36%
Gross Profit Margin 25.7% 26.2% 34.3% 28.0% 32.7% 6.21% 31.7% 31.7% 31.7% 31.7% 31.7% 31.7% (0.00%)
EBITDA Margin 17.1% 14.2% 24.5% 17.1% 20.3% 4.39% 19.4% 19.4% 19.4% 19.4% 19.4% 19.4% 0.00%
EBIT Margin 13.3% 9.8% 19.9% 12.4% 14.4% 1.99% 13.5% 13.0% 12.5% 12.0% 11.6% 11.1% (3.77%)
EBT Margin 12.3% 8.0% 18.0% 10.4% 11.7% (1.19%) 11.7% 11.2% 10.8% 10.4% 10.1% 9.7% (3.54%)
Effective Tax Rate 31.1% 31.7% 30.2% 23.7% 24.4% (5.93%) 24.4% 24.4% 24.4% 24.4% 24.4% 24.4% 0.00%
Net Profit Margin 9.0% 5.4% 12.5% 7.9% 8.8% (0.59%) 8.8% 8.4% 8.1% 7.8% 7.6% 7.3% (3.54%)
Earnings per Share Earnings per Share
Basic 4.63 3.00 7.57 5.03 5.71 5.38% 5.87 5.83 5.82 5.78 5.75 5.72 (0.52%)
Diluted 4.52 2.93 7.44 4.97 5.66 5.78% 5.87 5.83 5.82 5.78 5.75 5.72 (0.52%)
Price Earnings Ratio Price Earnings Ratio: Assuming 12.37 % Annual Growth Rate
Share Price as at Feb. 28 46.70 54.96 69.73 87.43 74.46 12.37% 83.7 94.0 105.7 118.7 133.4 149.9 12.37%
Basic 10.09 x 18.32 x 9.21 x 17.38 x 13.04 x 6.63% 14.25 x 16.14 x 18.16 x 20.54 x 23.21 x 26.22 x 12.96%
Diluted 10.33 x 18.76 x 9.37 x 17.59 x 13.16 x 6.23% 14.25 x 16.14 x 18.16 x 20.54 x 23.21 x 26.22 x 12.96%
Enterprise Value / EBITDA Enterprise Value / EBITDA
4.56 x 9.95 x 5.06 x 9.75 x 7.80 x 14.38% 8.17 x 8.03 x 7.85 x 7.64 x 7.41 x 7.16 x (2.61%)
Returns on Investment Returns on Investment
Return on Common Stockholders' Equity 34.4% 18.3% 34.5% 20.5% 22.8% (9.83%) 20.6% 18.2% 16.4% 15.1% 14.0% 13.0% (8.74%)
Dividend Payout Ratio 21.1% 43.9% 12.0% 28.0% 28.1% 7.45% 30.6% 33.9% 36.7% 39.3% 41.2% 42.4% 6.77%
Asset Turnover Ratio NA 90.6% 79.4% 68.3% 60.9% 61.9% 60.9% 60.4% 60.1% 60.0% 60.2% (0.55%)
Return on Assets NA 5.0% 10.0% 5.4% 5.4% 5.5% 5.2% 4.9% 4.7% 4.6% 4.4% (4.08%)
Eastman Chemical Company (NYSE: EMN)
24. Comparable Companies Analysis
Comparables Input Page — Values in Millions, USD except per-share data Fiscal Year Ended December 31,
Company(1) Prior Current 2014 A 2015 A 2/28/17
Ticker(2) Stub Stub LTM Cash and Cash Equivalents 214.0 293.0 207.0
Exchange 2011 A 2012 A 2013 A 2014 A 2015 A 3Q15 3Q16 2/28/17 2016 E 2017 E 2018 E 2019 E 2020 E 2021 E Receivables, Net 1,200.0 1,038.0 1,163.0
Fiscal Year Ended Revenue 7,178.0 8,102.0 9,350.0 9,527.0 9,648.0 7,423.0 6,820.0 9,045.0 9,008.0 9,140.0 9,295.7 9,476.1 9,682.6 9,916.6 Inventories 1,509.0 1,479.0 1,471.0
Moody's Rating COGS 5,609.0 6,340.0 6,574.0 7,306.0 7,068.0 5,352.0 4,960.0 6,676.0 6,613.6 6,710.5 6,824.8 6,957.3 7,108.9 7,280.7 Prepaid and Other Current Assets 250.0 68.0 59.0
S&P Rating Gross Profit 1,569.0 1,762.0 2,776.0 2,221.0 2,580.0 2,071.0 1,860.0 2,369.0 2,394.4 2,429.5 2,470.9 2,518.9 2,573.8 2,636.0 Total Current Assets 3,173.0 2,878.0 2,900.0
Predicted Beta Operating Expenses 640.0 842.0 838.0 982.0 1,013.0 729.0 701.0 985.0 893.9 907.0 922.4 940.3 960.8 984.1
Marginal Tax Rate Other Expenses / (Income) (68.0) 127.0 79.0 60.0 175.0 132.0 32.0 75.0 98.7 100.2 101.9 103.9 106.1 108.7 Property, Plant & Equipment, Net 5,087.0 5,130.0 5,197.0
EBIT 997.0 793.0 1,859.0 1,179.0 1,392.0 1,210.0 1,127.0 1,309.0 1,401.8 1,422.4 1,446.6 1,474.7 1,506.8 1,543.2 Goodwill and Intangible Assets 7,812.0 7,603.0 7,392.0
Net Interest 76.0 143.0 180.0 187.0 263.0 198.0 191.0 256.0 198.6 201.5 204.9 208.9 213.5 218.6 Total Assets 16,072.0 15,611.0 15,489.0
Current Share Price(3) 2/28/17 $80.25 EBT 921.0 650.0 1,679.0 992.0 1,129.0 1,012.0 936.0 1,053.0 1,203.2 1,220.8 1,241.6 1,265.7 1,293.3 1,324.6
% 52-week High(5) 98.5% Income Tax Expense 274.0 206.0 507.0 235.0 275.0 283.0 195.0 187.0 263.9 267.8 272.4 277.6 283.7 290.6 Payables, Net 1,721.0 1,625.0 1,531.0
52-week High(4) 2/28/17 81.45 Noncontrolling Interest 1.0 7.0 7.0 6.0 6.0 5.0 3.0 4.0 5.6 5.7 5.8 5.9 6.0 6.2 Accrued Liabilities 0.0 0.0 0.0
52-week Low 2/28/17 62.70 Preferred Dividends 0.0 0.0 0.0 0.0 0.0 0.0 0.0 0.0 0.0 0.0 0.0 0.0 0.0 0.0 Other Current Liabilities 0.0 0.0 0.0
Dividend Per Share (MRQ) Net Income 646.0 437.0 1,165.0 751.0 848.0 724.0 738.0 862.0 933.7 947.4 963.5 982.2 1,003.6 1,027.9 Total Current Liabilities 1,721.0 1,625.0 1,531.0
Basic Shares Outstanding 146.8 Effective Tax Rate 29.75% 31.69% 30.20% 23.69% 24.36% 27.96% 20.83% 17.76% 21.94% 21.94% 21.94% 21.94% 21.94% 21.94%
Fully Diluted Shares Outstanding 146.8 Total Debt 7,549.0 7,039.0 6,608.0
Market Capitalization(6) 11,776.8 Weighted Avg. Diluted Shares 142.9 149.1 156.6 151.1 149.8 149.7 148.7 148.8 146.8 145.2 143.8 143.1 142.4 141.6 Other Long-Term Liabilities 3,212.0 2,926.0 2,834.0
Equity Value(7) 11,776.8 Diluted EPS 4.52 2.93 7.44 4.97 5.66 4.84 4.96 5.79 6.36 6.52 6.70 6.86 7.05 7.26 Total Liabilities 12,482.0 11,590.0 10,973.0
Plus: Total Debt 6,608.0 Percent Change in Shares Outstanding NA 4.36% 4.99% (3.50%) (0.85%) * Approximately (0.66%) (2.05%) (1.03%) (1.00%) (0.50%) (0.50%) (0.50%)
Plus: Preferred Equity 0.0 Noncontrolling Interest 80.0 80.0 75.0
Plus: Noncontrolling Interest 75.0 Preferred Equity 0.0 0.0 0.0
Less: Cash and Cash Equivalents (207.0) Reported Gross Profit 1,569.0 1,762.0 2,776.0 2,221.0 2,580.0 2,071.0 1,860.0 2,369.0 2,394.4 2,429.5 2,470.9 2,518.9 2,573.8 2,636.0 Shareholders' Equity 3,510.0 3,941.0 4,441.0
Enterprise Value(8) 18,252.8 Non-Recurring Items in COGS 0.0 Total Liabilities and Equity 16,072.0 15,611.0 15,489.0
Adj. Gross Profit 1,569.0 1,762.0 2,776.0 2,221.0 2,580.0 2,071.0 1,860.0 2,369.0 2,394.4 2,429.5 2,470.9 2,518.9 2,573.8 2,636.0 Balance Yes Yes Yes
% Margin 21.9% 21.7% 29.7% 23.3% 26.7% 27.9% 27.3% 26.2% 26.6% 26.6% 26.6% 26.6% 26.6% 26.6%
(9-20, 23-26) Historical LTM
2015 A 2/28/17 2016 E 2017 E Reported EBIT 997.0 793.0 1,859.0 1,179.0 1,392.0 1,210.0 1,127.0 1,309.0 1,401.8 1,422.4 1,446.6 1,474.7 1,506.8 1,543.2
EV/Revenue 1.9 x 2.0 x 2.0 x 2.0 x Non-Recurring Items in COGS 0.0 0.0 0.0 0.0 0.0 0.0 0.0 0.0 0.0 0.0 0.0 0.0 0.0 0.0 Basic Shares Outstanding 146.8
Metric 9,648.0 9,045.0 9,008.0 9,140.0 Other Non-Recurring Items 0.0 Plus: Shares from In-the-Money Options 0.0
EV/EBITDA 9.3 x 9.7 x 9.2 x 9.1 x Adjusted EBIT 997.0 793.0 1,859.0 1,179.0 1,392.0 1,210.0 1,127.0 1,309.0 1,401.8 1,422.4 1,446.6 1,474.7 1,506.8 1,543.2 Less: Shares Repurchased 0.0
Metric 1,963.0 1,887.0 1,977.4 2,006.4 % Margin 13.9% 9.8% 19.9% 12.4% 14.4% 16.3% 16.5% 14.5% 15.6% 15.6% 15.6% 15.6% 15.6% 15.6% Net New Shares from Options 0.0
EV/EBIT 13.1 x 13.9 x 13.0 x 12.8 x Plus: Shares from Convertible Securities 0.0
Metric 1,392.0 1,309.0 1,401.8 1,422.4 Depreciation & Amortization 273.0 360.0 433.0 450.0 571.0 429.0 436.0 578.0 575.6 584.1 594.0 605.6 618.7 633.7 Fully Diluted Shares Outstanding 146.8
P/E 14.2 x 5.5 x 12.6 x 12.3 x Adjusted EBITDA 1,270.0 1,153.0 2,292.0 1,629.0 1,963.0 1,639.0 1,563.0 1,887.0 1,977.4 2,006.4 2,040.6 2,080.2 2,125.5 2,176.9
Metric 5.7 14.6 6.4 6.5 % Margin 17.7% 14.2% 24.5% 17.1% 20.3% 22.1% 22.9% 20.9% 22.0% 22.0% 22.0% 22.0% 22.0% 22.0% Options/Warrants
Number of Exercise In-the-Money
Reported Net Income 646.0 437.0 1,165.0 751.0 848.0 724.0 738.0 862.0 933.7 947.4 963.5 982.2 1,003.6 1,027.9 Tranche Shares Price Shares Proceeds
Return on Invested Capital 12.16% Non-Recurring Items in COGS 0.0 0.0 0.0 0.0 0.0 0.0 0.0 0.0 Tranche 1 0.0 0.0
Return on Equity 51.80% Other Non-Recurring Items 0.0 0.0 0.0 0.0 0.0 0.0 0.0 0.0 0.0 0.0 0.0 0.0 0.0 0.0 Tranche 2 0.0 0.0
Return on Assets 13.96% Non-Operating Non-Rec. Items 1,210.0 1,127.0 1,309.0 Tranche 3 0.0 0.0
Implied Annual Dividend Per Share 0.00% Tax Adjustment 0.0 0.0 0.0 0.0 0.0 0.0 0.0 0.0 0.0 0.0 0.0 0.0 0.0 Tranche 4 0.0 0.0
Adjusted Net Income 646.0 437.0 1,165.0 751.0 848.0 1,934.0 1,865.0 2,171.0 933.7 947.4 963.5 982.2 1,003.6 1,027.9 Tranche 5 0.0 0.0
% Margin 9.0% 5.4% 12.5% 7.9% 8.8% 26.1% 27.3% 24.0% 10.4% 10.4% 10.4% 10.4% 10.4% 10.4% Total 0.0 0.0 0.0
Debt/Total Capitalization 59.81%
Total Debt/EBITDA(22) 3.5x Adjusted Diluted EPS 4.52 2.93 7.44 4.97 5.66 12.92 12.54 14.59 6.36 6.52 6.70 6.86 7.05 7.26 Convertible Securities
Net Debt/EBITDA 4.9x Conversion Conversion New
EITDA/Interest Expense 7.4x Issue Amount Price Ratio Shares
[EBITDA-Capex]/Interest Expense 5.0x Depreciation and Amortization 273.0 360.0 433.0 450.0 571.0 429.0 436.0 578.0 575.6 584.1 594.0 605.6 618.7 633.7 Issue 1 0.0 0.0
EBIT/Interest Expense 5.1x % Revenue 3.80% 4.44% 4.63% 4.72% 5.92% 5.78% 6.39% 6.39% 6.39% 6.39% 6.39% 6.39% 6.39% 6.39% Issue 2 0.0 0.0
Capital Expenditures 457.0 465.0 483.0 593.0 652.0 426.0 375.0 601.0 598.5 607.3 617.7 629.6 643.4 658.9 Issue 3 0.0 0.0
% Revenue 6.37% 5.74% 5.17% 6.22% 6.76% 5.74% 5.50% 6.64% 6.64% 6.64% 6.64% 6.64% 6.64% 6.64% Issue 4 0.0 0.0
Revenue EBITDA EPS Issue 5 0.0 0.0
Historical Total 0.0
CAGR (4-Year) 7.7% 11.5% 5.8%
CAGR (2-Year) 1.6% (7.5%) (12.8%) Notes and Assumptions Balance Sheet Raw Data and Details Dec. 31, 2014 Dec. 31, 2015 Sep. 30, 2016
2012 A 12.9% (9.2%) (35.2%) 1. Revenue Growth Rate NA 12.87% 15.40% 1.89% 1.27% St. Dev. (Revenue Growth) 7.33% (6.63%) 1.47% 1.70% 1.94% 2.18% 2.42% 2014 A 2015 A 3Q16
2013 A 15.4% 98.8% 153.9% 2. Average Revenue Growth (Last 5 Years) 7.86% 9,008.0 9,140.0 0.24% Slope to the Risk-Free Rate Current assets
2014 A 1.9% (28.9%) (33.2%) 3. COGS (% Revenue) 78.1% 78.3% 70.3% 76.7% 73.3% St. Dev. (COGS %) 3.55% 73.42% 73.42% 73.42% 73.42% 73.42% 73.42% Cash and cash equivalents 214.0 293.0 207.0
2015 A 1.3% 20.5% 13.9% 4. Operating Expenses (% Revenue) 8.9% 10.4% 9.0% 10.3% 10.5% St. Dev. (Op. Ex. %) 0.72% 9.92% 9.92% 9.92% 9.92% 9.92% 9.92% Trade receivables, net 936.0 792.0 905.0
5. Other Expenses (% Revenue) (0.95%) 1.57% 0.84% 0.63% 1.81% St. Dev. (Other Ex. %) 0.57% 1.10% 1.10% 1.10% 1.10% 1.10% 1.10% Miscellaneous receivables 264.0 246.0 258.0
Estimated 6. Net Interest (% Revenue) 1.06% 1.76% 1.93% 1.96% 2.73% St. Dev. (Net Interest %) 0.43% 2.20% 2.20% 2.20% 2.20% 2.20% 2.20% Inventories 1,509.0 1,479.0 1,471.0
2016 E (6.6%) 0.7% 12.4% 7. NCI (% Revenue) 0.01% 0.09% 0.07% 0.06% 0.06% St. Dev. (NCI %) 0.01% 0.06% 0.06% 0.06% 0.06% 0.06% 0.06% Other current assets 250.0 68.0 59.0
CAGR (2-Year) (2.7%) 1.1% 7.3% 8. Preferred Dividends (% Revenue) 0.00% 0.00% 0.00% 0.00% 0.00% St. Dev. (Preferred Div. %) 0.00% 0.00% 0.00% 0.00% 0.00% 0.00% 0.00% Total current assets 3,173.0 2,878.0 2,900.0
CAGR (4-Year) (0.4%) 1.5% 4.9% 9. Gross Profit Margin (%) 21.86% 21.75% 29.69% 23.31% 26.74% 26.58% 26.58% 26.58% 26.58% 26.58% 26.58% Properties
Long Term(27) 2.4% 2.4% 2.9% 10. EBIT Margin (%) 13.89% 9.79% 19.88% 12.38% 14.43% 15.56% 15.56% 15.56% 15.56% 15.56% 15.56% Properties and equipment at cost 11,026.0 11,234.0 11,564.0
Fully Diluted Shares Outstanding
LTM Return on Investment Ratios
LTM Credit Statistics
Cash Flow Statement Data
Growth Rates
Estimates
EMN Fiscal Year Ended December 31,
NYSE
31-Dec
NA
NA
1.51
40.00%
Market Data
Adjusted Income Statement
Trading Multiples
Eastman Chemical Company (NYSE:EMN)
General Information Reported Income Statement Balance Sheet Data
Eastman Chemical Company Extended Historical Period Projection Period
25. Comparable Companies Analysis
Comparables Input Page — Values in Millions, USD except per-share data Fiscal Year Ended December 31,
Company(1) Prior Current 2014 A 2015 A 2/28/17
Ticker(2) Stub Stub LTM Cash and Cash Equivalents 5,654.0 8,577.0 7,032.0
Exchange 2011 A 2012 A 2013 A 2014 A 2015 A 3Q15 3Q16 2/28/17 2016 E 2017 E 2018 E 2019 E 2020 E 2021 E Receivables, Net 9,372.0 7,846.0 9,108.0
Fiscal Year Ended Revenue 59,985.0 56,786.0 57,080.0 58,167.0 48,778.0 37,316.0 35,138.0 46,600.0 48,158.0 50,500.0 52,647.1 54,563.5 56,215.9 57,574.7 Inventories 8,101.0 6,871.0 8,013.0
Moody's Rating COGS 51,525.0 48,270.0 48,055.0 47,900.0 38,255.0 29,346.0 27,454.0 36,363.0 38,185.0 40,595.9 42,321.9 43,862.4 45,190.8 46,283.1 Prepaid and Other Current Assets 1,128.0 1,181.0 625.0
S&P Rating Gross Profit 8,460.0 8,516.0 9,025.0 10,267.0 10,523.0 7,970.0 7,684.0 10,237.0 9,973.0 9,904.1 10,325.2 10,701.0 11,025.1 11,291.6 Total Current Assets 24,255.0 24,475.0 24,778.0
Predicted Beta Operating Expenses 4,434.0 4,569.0 4,771.0 4,753.0 4,569.0 3,408.0 3,552.0 4,713.0 4,888.0 4,359.3 4,544.6 4,710.0 4,852.7 4,970.0
Marginal Tax Rate Other Expenses / (Income) (876.0) 1,054.0 (3,610.0) (683.0) (4,851.0) (1,880.0) (1,044.0) (4,015.0) (79.0) (2,936.4) (3,061.2) (3,172.6) (3,268.7) (3,347.7) Property, Plant & Equipment, Net 22,252.0 21,812.0 26,877.0
EBIT 4,902.0 2,893.0 7,864.0 6,197.0 10,805.0 6,442.0 5,176.0 9,539.0 5,164.0 8,481.2 8,841.8 9,163.6 9,441.1 9,669.3 Goodwill and Intangible Assets 22,180.0 21,739.0 28,969.0
Net Interest 1,301.0 1,228.0 1,060.0 932.0 875.0 660.0 565.0 780.0 751.0 884.3 921.9 955.4 984.4 1,008.2 Total Assets 68,687.0 68,026.0 80,624.0
Current Share Price(3) 2/28/17 $62.26 EBT 3,601.0 1,665.0 6,804.0 5,265.0 9,930.0 5,782.0 4,611.0 8,759.0 4,413.0 7,596.9 7,919.9 8,208.2 8,456.8 8,661.2
% 52-week High(5) 96.7% Income Tax Expense 817.0 565.0 1,988.0 1,426.0 2,147.0 1,630.0 291.0 808.0 9.0 1,467.0 1,529.3 1,585.0 1,633.0 1,672.5 Payables, Net 7,331.0 6,318.0 7,413.0
52-week High(4) 2/28/17 64.36 Noncontrolling Interest 42.0 (82.0) 29.0 67.0 98.0 79.0 54.0 73.0 86.0 101.5 105.8 109.6 112.9 115.7 Accrued Liabilities 2,839.0 3,212.0 3,534.0
52-week Low 2/28/17 47.51 Preferred Dividends 340.0 340.0 340.0 340.0 340.0 255.0 255.0 340.0 340.0 340.0 340.0 340.0 340.0 340.0 Other Current Liabilities 1,029.0 1,144.0 1,075.0
Dividend Per Share (MRQ) Net Income 2,402.0 842.0 4,447.0 3,432.0 7,345.0 3,818.0 4,011.0 7,538.0 3,978.0 5,688.5 5,944.8 6,173.5 6,370.8 6,533.0 Total Current Liabilities 11,199.0 10,674.0 12,022.0
Basic Shares Outstanding 1,213.3 Effective Tax Rate 22.69% 33.93% 29.22% 27.08% 21.62% 28.19% 6.31% 9.22% 19.31% 19.31% 19.31% 19.31% 19.31% 19.31%
Fully Diluted Shares Outstanding 1,213.3 Total Debt 19,123.0 16,756.0 21,056.0
Market Capitalization(6) 75,540.8 Weighted Avg. Diluted Shares 1,171.7 1,202.9 1,208.4 1,195.8 1,194.3 3,534.1 3,464.5 1,196.5 1,130.1 1,213.3 1,207.2 1,201.2 1,195.2 1,189.2 Other Long-Term Liabilities 14,809.0 14,413.0 17,197.0
Equity Value(7) 75,540.8 Diluted EPS 2.05 0.70 3.68 2.87 6.15 1.08 1.16 6.30 3.52 4.69 4.92 5.14 5.33 5.49 Total Liabilities 45,131.0 41,843.0 50,275.0
Plus: Total Debt 21,056.0 Percent Change in Shares Outstanding NA 2.66% 0.46% (1.04%) (0.13%) * Approximately 0.18% (5.38%) 7.36% (0.50%) (0.50%) (0.50%) (0.50%)
Plus: Preferred Equity 4,000.0 Noncontrolling Interest 931.0 809.0 1,314.0
Plus: Noncontrolling Interest 1,314.0 Preferred Equity 4,000.0 4,000.0 4,000.0
Less: Cash and Cash Equivalents (7,032.0) Reported Gross Profit 8,460.0 8,516.0 9,025.0 10,267.0 10,523.0 7,970.0 7,684.0 10,237.0 9,973.0 9,904.1 10,325.2 10,701.0 11,025.1 11,291.6 Shareholders' Equity 18,625.0 21,374.0 25,035.0
Enterprise Value(8) 94,878.8 Non-Recurring Items in COGS 0.0 Total Liabilities and Equity 68,687.0 68,026.0 80,624.0
Adj. Gross Profit 8,460.0 8,516.0 9,025.0 10,267.0 10,523.0 7,970.0 7,684.0 10,237.0 9,973.0 9,904.1 10,325.2 10,701.0 11,025.1 11,291.6 Balance Yes Yes Yes
% Margin 14.1% 15.0% 15.8% 17.7% 21.6% 21.4% 21.9% 22.0% 20.7% 19.6% 19.6% 19.6% 19.6% 19.6%
(9-20, 23-26) Historical LTM
2015 A 2/28/17 2016 E 2017 E Reported EBIT 4,902.0 2,893.0 7,864.0 6,197.0 10,805.0 6,442.0 5,176.0 9,539.0 5,164.0 8,481.2 8,841.8 9,163.6 9,441.1 9,669.3
EV/Revenue 1.9 x 2.0 x 2.0 x 1.9 x Non-Recurring Items in COGS 0.0 0.0 0.0 0.0 0.0 0.0 0.0 0.0 0.0 0.0 0.0 0.0 0.0 0.0 Basic Shares Outstanding 1,213.3
Metric 48,778.0 46,600.0 48,158.0 50,500.0 Other Non-Recurring Items 0.0 Plus: Shares from In-the-Money Options 0.0
EV/EBITDA 7.1 x 7.8 x 11.8 x 8.3 x Adjusted EBIT 4,902.0 2,893.0 7,864.0 6,197.0 10,805.0 6,442.0 5,176.0 9,539.0 5,164.0 8,481.2 8,841.8 9,163.6 9,441.1 9,669.3 Less: Shares Repurchased 0.0
Metric 13,326.0 12,206.0 8,026.0 11,482.4 % Margin 8.2% 5.1% 13.8% 10.7% 22.2% 17.3% 14.7% 20.5% 10.7% 16.8% 16.8% 16.8% 16.8% 16.8% Net New Shares from Options 0.0
EV/EBIT 8.8 x 9.9 x 18.4 x 11.2 x Plus: Shares from Convertible Securities 0.0
Metric 10,805.0 9,539.0 5,164.0 8,481.2 Depreciation & Amortization 2,883.0 2,698.0 2,681.0 2,747.0 2,521.0 1,921.0 2,067.0 2,667.0 2,862.0 3,001.2 3,128.8 3,242.7 3,340.9 3,421.6 Fully Diluted Shares Outstanding 1,213.3
P/E 10.1 x 4.4 x 17.7 x 13.3 x Adjusted EBITDA 7,785.0 5,591.0 10,545.0 8,944.0 13,326.0 8,363.0 7,243.0 12,206.0 8,026.0 11,482.4 11,970.6 12,406.3 12,782.0 13,091.0
Metric 6.2 14.3 3.5 4.7 % Margin 13.0% 9.8% 18.5% 15.4% 27.3% 22.4% 20.6% 26.2% 16.7% 22.7% 22.7% 22.7% 22.7% 22.7% Options/Warrants
Number of Exercise In-the-Money
Reported Net Income 2,402.0 842.0 4,447.0 3,432.0 7,345.0 3,818.0 4,011.0 7,538.0 3,978.0 5,688.5 5,944.8 6,173.5 6,370.8 6,533.0 Tranche Shares Price Shares Proceeds
Return on Invested Capital 27.81% Non-Recurring Items in COGS 0.0 0.0 0.0 0.0 0.0 0.0 0.0 0.0 Tranche 1 0.0 0.0
Return on Equity 73.59% Other Non-Recurring Items 0.0 0.0 0.0 0.0 0.0 0.0 0.0 0.0 0.0 0.0 0.0 0.0 0.0 0.0 Tranche 2 0.0 0.0
Return on Assets 22.98% Non-Operating Non-Rec. Items 6,442.0 5,176.0 9,539.0 Tranche 3 0.0 0.0
Implied Annual Dividend Per Share 0.00% Tax Adjustment 0.0 0.0 0.0 0.0 0.0 0.0 0.0 0.0 0.0 0.0 0.0 0.0 0.0 Tranche 4 0.0 0.0
Adjusted Net Income 2,402.0 842.0 4,447.0 3,432.0 7,345.0 10,260.0 9,187.0 17,077.0 3,978.0 5,688.5 5,944.8 6,173.5 6,370.8 6,533.0 Tranche 5 0.0 0.0
% Margin 4.0% 1.5% 7.8% 5.9% 15.1% 27.5% 26.1% 36.6% 8.3% 11.3% 11.3% 11.3% 11.3% 11.3% Total 0.0 0.0 0.0
Debt/Total Capitalization 45.68%
Total Debt/EBITDA(22) 1.7x Adjusted Diluted EPS 2.05 0.70 3.68 2.87 6.15 2.90 2.65 14.27 3.52 4.69 4.92 5.14 5.33 5.49 Convertible Securities
Net Debt/EBITDA 1.5x Conversion Conversion New
EITDA/Interest Expense 15.6x Issue Amount Price Ratio Shares
[EBITDA-Capex]/Interest Expense 10.8x Depreciation and Amortization 2,883.0 2,698.0 2,681.0 2,747.0 2,521.0 1,921.0 2,067.0 2,667.0 2,862.0 3,001.2 3,128.8 3,242.7 3,340.9 3,421.6 Issue 1 0.0 0.0
EBIT/Interest Expense 12.2x % Revenue 4.81% 4.75% 4.70% 4.72% 5.17% 5.15% 5.88% 5.72% 5.94% 5.94% 5.94% 5.94% 5.94% 5.94% Issue 2 0.0 0.0
Capital Expenditures 2,687.0 2,614.0 2,302.0 3,572.0 3,703.0 2,817.0 2,877.0 3,763.0 3,804.0 3,989.0 4,158.6 4,310.0 4,440.5 4,547.8 Issue 3 0.0 0.0
% Revenue 4.48% 4.60% 4.03% 6.14% 7.59% 7.55% 8.19% 8.08% 7.90% 7.90% 7.90% 7.90% 7.90% 7.90% Issue 4 0.0 0.0
Revenue EBITDA EPS Issue 5 0.0 0.0
Historical Total 0.0
CAGR (4-Year) (5.0%) 14.4% 31.6%
CAGR (2-Year) (7.6%) 12.4% 29.3% Notes and Assumptions Balance Sheet Raw Data and Details Dec. 31, 2014 Dec. 31, 2015 Sep. 30, 2016
2012 A (5.3%) (28.2%) (65.9%) 1. Revenue Growth Rate NA (5.33%) 0.52% 1.90% (16.14%) St. Dev. (Revenue Growth) 8.21% (1.27%) 4.86% 4.25% 3.64% 3.03% 2.42% 2014 A 2015 A 3Q16
2013 A 0.5% 88.6% 425.7% 2. Average Revenue Growth (Last 5 Years) (4.76%) 48,158.0 50,500.0 (0.61%) Slope to the Risk-Free Rate Consolidated Balance Sheets
2014 A 1.9% (15.2%) (22.0%) 3. COGS (% Revenue) 85.9% 85.0% 84.2% 82.3% 78.4% St. Dev. (COGS %) 2.93% 80.39% 80.39% 80.39% 80.39% 80.39% 80.39% Current Assets
2015 A (16.1%) 49.0% 114.3% 4. Operating Expenses (% Revenue) 7.4% 8.0% 8.4% 8.2% 9.4% St. Dev. (Op. Ex. %) 0.60% 8.63% 8.63% 8.63% 8.63% 8.63% 8.63% Cash and cash equivalents 5,654.0 8,577.0 7,032.0
5. Other Expenses (% Revenue) (1.46%) 1.86% (6.32%) (1.17%) (9.95%) St. Dev. (Other Ex. %) 5.26% (5.81%) (5.81%) (5.81%) (5.81%) (5.81%) (5.81%) Accounts and notes receivable:
Estimated 6. Net Interest (% Revenue) 2.17% 2.16% 1.86% 1.60% 1.79% St. Dev. (Net Interest %) 0.23% 1.75% 1.75% 1.75% 1.75% 1.75% 1.75% Trade 4,685.0 4,078.0 4,746.0
2016 E (1.3%) (39.8%) (42.8%) 7. NCI (% Revenue) 0.07% (0.14%) 0.05% 0.12% 0.20% St. Dev. (NCI %) 0.15% 0.20% 0.20% 0.20% 0.20% 0.20% 0.20% Other 4,687.0 3,768.0 4,362.0
CAGR (2-Year) 1.7% (7.2%) (12.7%) 8. Preferred Dividends (% Revenue) 0.57% 0.60% 0.60% 0.58% 0.70% St. Dev. (Preferred Div. %) 0.05% 0.71% 0.67% 0.65% 0.62% 0.60% 0.59% Inventories 8,101.0 6,871.0 8,013.0
CAGR (4-Year) 2.8% (1.8%) (4.4%) 9. Gross Profit Margin (%) 14.10% 15.00% 15.81% 17.65% 21.57% 20.71% 19.61% 19.61% 19.61% 19.61% 19.61% Deferred income tax assets - current 812.0 827.0 0.0
Long Term(27) 2.4% 2.4% 3.1% 10. EBIT Margin (%) 8.17% 5.09% 13.78% 10.65% 22.15% 10.72% 16.79% 16.79% 16.79% 16.79% 16.79% Other current assets 316.0 354.0 625.0
Fully Diluted Shares Outstanding
LTM Return on Investment Ratios
LTM Credit Statistics
Balance Sheet Data
The Dow Chemical Company (NYSE:DOW)
Projection PeriodThe Dow Chemical Company
DOW
General Information
Extended Historical Period
Reported Income Statement
Growth Rates
Estimates
Cash Flow Statement Data
Adjusted Income Statement
Fiscal Year Ended December 31,
Market Data
Trading Multiples
NA
1.12
40.00%
NA
NYSE
31-Dec
26. Comparable Companies Analysis
Comparables Input Page — Values in Millions, USD except per-share data Fiscal Year Ended December 31,
Company(1) Prior Current 2014 A 2015 A 2/28/17
Ticker(2) Stub Stub LTM Cash and Cash Equivalents 6,910.0 5,300.0 4,452.0
Exchange 2011 A 2012 A 2013 A 2014 A 2015 A 3Q15 3Q16 2/28/17 2016 E 2017 E 2018 E 2019 E 2020 E 2021 E Receivables, Net 5,238.0 4,643.0 7,073.0
Fiscal Year Ended Revenue 33,681.0 34,812.0 28,998.0 28,406.0 25,130.0 22,640.0 19,383.0 21,873.0 24,594.0 25,800.0 26,904.7 27,889.5 28,737.0 29,431.6 Inventories 6,787.0 6,140.0 5,168.0
Moody's Rating COGS 21,264.0 21,538.0 17,642.0 17,023.0 15,112.0 13,917.0 11,322.0 12,517.0 14,469.0 15,557.5 16,223.7 16,817.5 17,328.6 17,747.4 Prepaid and Other Current Assets 7,147.0 1,672.0 1,605.0
S&P Rating Gross Profit 12,417.0 13,274.0 11,356.0 11,383.0 10,018.0 8,723.0 8,061.0 9,356.0 10,125.0 10,242.5 10,681.1 11,072.0 11,408.5 11,684.2 Total Current Assets 26,082.0 17,755.0 18,298.0
Predicted Beta Operating Expenses 5,270.0 5,650.0 7,379.0 6,849.0 6,513.0 5,184.0 4,615.0 5,944.0 5,960.0 6,490.8 6,768.8 7,016.5 7,229.7 7,404.5
Marginal Tax Rate Other Expenses / (Income) 2,454.0 3,764.0 (1,693.0) (647.0) 508.0 139.0 263.0 632.0 526.0 516.0 538.1 557.8 574.7 588.6 Property, Plant & Equipment, Net 10,008.0 9,784.0 9,654.0
EBIT 4,693.0 3,860.0 5,670.0 5,181.0 2,997.0 3,400.0 3,183.0 2,780.0 3,639.0 3,235.6 3,374.2 3,497.7 3,604.0 3,691.1 Goodwill and Intangible Assets 14,400.0 13,627.0 14,529.0
Net Interest 447.0 464.0 448.0 377.0 342.0 293.0 278.0 327.0 370.0 364.0 379.6 393.5 405.5 415.3 Total Assets 50,490.0 41,166.0 42,481.0
Current Share Price(3) 2/28/17 $78.54 EBT 4,246.0 3,396.0 5,222.0 4,804.0 2,655.0 3,107.0 2,905.0 2,453.0 3,269.0 2,871.6 2,994.6 3,104.2 3,198.5 3,275.8
% 52-week High(5) 97.4% Income Tax Expense 647.0 616.0 360.0 1,168.0 696.0 892.0 643.0 447.0 744.0 658.1 686.3 711.4 733.0 750.7 Payables, Net 3,786.0 3,398.0 2,627.0
52-week High(4) 2/28/17 80.66 Noncontrolling Interest 40.0 25.0 14.0 11.0 6.0 9.0 14.0 11.0 12.0 11.0 11.0 11.0 11.0 11.0 Accrued Liabilities 5,596.0 5,580.0 3,132.0
52-week Low 2/28/17 60.81 Preferred Dividends 10.0 10.0 10.0 10.0 10.0 0.0 0.0 10.0 10.0 10.0 10.0 10.0 10.0 10.0 Other Current Liabilities 3,001.0 210.0 109.0
Dividend Per Share (MRQ) Net Income 3,549.0 2,745.0 4,838.0 3,615.0 1,943.0 2,206.0 2,248.0 1,985.0 2,503.0 2,192.5 2,287.3 2,371.8 2,444.5 2,504.1 Total Current Liabilities 12,383.0 9,188.0 5,868.0
Basic Shares Outstanding 864.6 Effective Tax Rate 15.24% 18.14% 6.89% 24.31% 26.21% 28.71% 22.13% 18.22% 22.92% 22.92% 22.92% 22.92% 22.92% 22.92%
Fully Diluted Shares Outstanding 864.6 Total Debt 10,655.0 8,807.0 11,356.0
Market Capitalization(6) 67,903.6 Weighted Avg. Diluted Shares 944.0 946.7 935.9 924.7 904.2 903.8 879.3 866.8 881.8 864.6 860.3 855.9 851.7 847.4 Other Long-Term Liabilities 14,074.0 12,971.0 15,303.0
Equity Value(7) 67,903.6 Diluted EPS 3.76 2.90 5.17 3.91 2.15 2.44 2.56 2.29 2.84 2.54 2.66 2.77 2.87 2.95 Total Liabilities 37,112.0 30,966.0 32,527.0
Plus: Total Debt 11,356.0 Percent Change in Shares Outstanding NA 0.29% (1.14%) (1.19%) (2.23%) * Approximately (4.13%) (2.48%) (1.95%) (0.50%) (0.50%) (0.50%) (0.50%)
Plus: Preferred Equity 237.0 Noncontrolling Interest 58.0 207.0 203.0
Plus: Noncontrolling Interest 203.0 Preferred Equity 237.0 237.0 237.0
Less: Cash and Cash Equivalents (4,452.0) Reported Gross Profit 12,417.0 13,274.0 11,356.0 11,383.0 10,018.0 8,723.0 8,061.0 9,356.0 10,125.0 10,242.5 10,681.1 11,072.0 11,408.5 11,684.2 Shareholders' Equity 13,083.0 9,756.0 9,514.0
Enterprise Value(8) 75,247.6 Non-Recurring Items in COGS 0.0 Total Liabilities and Equity 50,490.0 41,166.0 42,481.0
Adj. Gross Profit 12,417.0 13,274.0 11,356.0 11,383.0 10,018.0 8,723.0 8,061.0 9,356.0 10,125.0 10,242.5 10,681.1 11,072.0 11,408.5 11,684.2 Balance Yes Yes Yes
% Margin 36.9% 38.1% 39.2% 40.1% 39.9% 38.5% 41.6% 42.8% 41.2% 39.7% 39.7% 39.7% 39.7% 39.7%
(9-20, 23-26) Historical LTM
2015 A 2/28/17 2016 E 2017 E Reported EBIT 4,693.0 3,860.0 5,670.0 5,181.0 2,997.0 3,400.0 3,183.0 2,780.0 3,639.0 3,235.6 3,374.2 3,497.7 3,604.0 3,691.1
EV/Revenue 3.0 x 3.4 x 3.1 x 2.9 x Non-Recurring Items in COGS 0.0 0.0 0.0 0.0 0.0 0.0 0.0 0.0 0.0 0.0 0.0 0.0 0.0 0.0 Basic Shares Outstanding 864.6
Metric 25,130.0 21,873.0 24,594.0 25,800.0 Other Non-Recurring Items 0.0 Plus: Shares from In-the-Money Options 0.0
EV/EBITDA 16.9 x 18.5 x 15.4 x 16.5 x Adjusted EBIT 4,693.0 3,860.0 5,670.0 5,181.0 2,997.0 3,400.0 3,183.0 2,780.0 3,639.0 3,235.6 3,374.2 3,497.7 3,604.0 3,691.1 Less: Shares Repurchased 0.0
Metric 4,463.0 4,062.0 4,897.0 4,555.3 % Margin 13.9% 11.1% 19.6% 18.2% 11.9% 15.0% 16.4% 12.7% 14.8% 12.5% 12.5% 12.5% 12.5% 12.5% Net New Shares from Options 0.0
EV/EBIT 25.1 x 27.1 x 20.7 x 23.3 x Plus: Shares from Convertible Securities 0.0
Metric 2,997.0 2,780.0 3,639.0 3,235.6 Depreciation & Amortization 1,560.0 1,713.0 1,603.0 1,617.0 1,466.0 1,163.0 979.0 1,282.0 1,258.0 1,319.7 1,376.2 1,426.6 1,469.9 1,505.4 Fully Diluted Shares Outstanding 864.6
P/E 36.5 x 14.3 x 27.7 x 31.0 x Adjusted EBITDA 6,253.0 5,573.0 7,273.0 6,798.0 4,463.0 4,563.0 4,162.0 4,062.0 4,897.0 4,555.3 4,750.4 4,924.3 5,073.9 5,196.5
Metric 2.1 5.5 2.8 2.5 % Margin 18.6% 16.0% 25.1% 23.9% 17.8% 20.2% 21.5% 18.6% 19.9% 17.7% 17.7% 17.7% 17.7% 17.7% Options/Warrants
Number of Exercise In-the-Money
Reported Net Income 3,549.0 2,745.0 4,838.0 3,615.0 1,943.0 2,206.0 2,248.0 1,985.0 2,503.0 2,192.5 2,287.3 2,371.8 2,444.5 2,504.1 Tranche Shares Price Shares Proceeds
Return on Invested Capital 18.73% Non-Recurring Items in COGS 0.0 0.0 0.0 0.0 0.0 0.0 0.0 0.0 Tranche 1 0.0 0.0
Return on Equity 49.46% Other Non-Recurring Items 0.0 0.0 0.0 0.0 0.0 0.0 0.0 0.0 0.0 0.0 0.0 0.0 0.0 0.0 Tranche 2 0.0 0.0
Return on Assets 11.39% Non-Operating Non-Rec. Items 3,400.0 3,183.0 2,780.0 Tranche 3 0.0 0.0
Implied Annual Dividend Per Share 0.00% Tax Adjustment 0.0 0.0 0.0 0.0 0.0 0.0 0.0 0.0 0.0 0.0 0.0 0.0 0.0 Tranche 4 0.0 0.0
Adjusted Net Income 3,549.0 2,745.0 4,838.0 3,615.0 1,943.0 5,606.0 5,431.0 4,765.0 2,503.0 2,192.5 2,287.3 2,371.8 2,444.5 2,504.1 Tranche 5 0.0 0.0
% Margin 10.5% 7.9% 16.7% 12.7% 7.7% 24.8% 28.0% 21.8% 10.2% 8.5% 8.5% 8.5% 8.5% 8.5% Total 0.0 0.0 0.0
Debt/Total Capitalization 54.41%
Total Debt/EBITDA(22) 2.8x Adjusted Diluted EPS 3.76 2.90 5.17 3.91 2.15 6.20 6.18 5.50 2.84 2.54 2.66 2.77 2.87 2.95 Convertible Securities
Net Debt/EBITDA 2.5x Conversion Conversion New
EITDA/Interest Expense 12.4x Issue Amount Price Ratio Shares
[EBITDA-Capex]/Interest Expense 9.1x Depreciation and Amortization 1,560.0 1,713.0 1,603.0 1,617.0 1,466.0 1,163.0 979.0 1,282.0 1,258.0 1,319.7 1,376.2 1,426.6 1,469.9 1,505.4 Issue 1 0.0 0.0
EBIT/Interest Expense 8.5x % Revenue 4.63% 4.92% 5.53% 5.69% 5.83% 5.14% 5.05% 5.86% 5.12% 5.12% 5.12% 5.12% 5.12% 5.12% Issue 2 0.0 0.0
Capital Expenditures 1,843.0 1,793.0 1,882.0 2,020.0 1,629.0 1,291.0 759.0 1,097.0 1,019.0 1,069.0 1,114.7 1,155.5 1,190.7 1,219.4 Issue 3 0.0 0.0
% Revenue 5.47% 5.15% 6.49% 7.11% 6.48% 5.70% 3.92% 5.02% 4.14% 4.14% 4.14% 4.14% 4.14% 4.14% Issue 4 0.0 0.0
Revenue EBITDA EPS Issue 5 0.0 0.0
Historical Total 0.0
CAGR (4-Year) (7.1%) (8.1%) (13.0%)
CAGR (2-Year) (6.9%) (21.7%) (35.5%) Notes and Assumptions Balance Sheet Raw Data and Details Dec. 31, 2014 Dec. 31, 2015 Sep. 30, 2016
2012 A 3.4% (10.9%) (22.9%) 1. Revenue Growth Rate NA 3.36% (16.70%) (2.04%) (11.53%) St. Dev. (Revenue Growth) 9.06% (2.13%) 4.90% 4.28% 3.66% 3.04% 2.42% 2014 A 2015 A 3Q16
2013 A (16.7%) 30.5% 78.3% 2. Average Revenue Growth (Last 5 Years) (6.73%) 24,594.0 25,800.0 (0.62%) Slope to the Risk-Free Rate Consolidated Balance Sheets
2014 A (2.0%) (6.5%) (24.4%) 3. COGS (% Revenue) 63.1% 61.9% 60.8% 59.9% 60.1% St. Dev. (COGS %) 0.88% 60.30% 60.30% 60.30% 60.30% 60.30% 60.30% Assets
2015 A (11.5%) (34.3%) (45.0%) 4. Operating Expenses (% Revenue) 15.6% 16.2% 25.4% 24.1% 25.9% St. Dev. (Op. Ex. %) 4.53% 25.16% 25.16% 25.16% 25.16% 25.16% 25.16% Cash and cash equivalents 6,910.0 5,300.0 4,452.0
5. Other Expenses (% Revenue) 7.29% 10.81% (5.84%) (2.28%) 2.02% St. Dev. (Other Ex. %) 7.18% 2.00% 2.00% 2.00% 2.00% 2.00% 2.00% Marketable securities 124.0 906.0 1,080.0
Estimated 6. Net Interest (% Revenue) 1.33% 1.33% 1.54% 1.33% 1.36% St. Dev. (Net Interest %) 0.10% 1.41% 1.41% 1.41% 1.41% 1.41% 1.41% Accounts and notes receivable, net 5,238.0 4,643.0 7,073.0
2016 E (2.1%) 9.7% 32.1% 7. NCI (% Revenue) 0.12% 0.07% 0.05% 0.04% 0.02% St. Dev. (NCI %) 0.02% 0.05% 0.04% 0.04% 0.04% 0.04% 0.04% Inventories 6,787.0 6,140.0 5,168.0
CAGR (2-Year) 1.3% 1.0% 8.6% 8. Preferred Dividends (% Revenue) 0.03% 0.03% 0.03% 0.04% 0.04% St. Dev. (Preferred Div. %) 0.00% 0.04% 0.04% 0.04% 0.04% 0.03% 0.03% Prepaid expenses 264.0 248.0 525.0
CAGR (4-Year) 2.6% 2.5% 6.6% 9. Gross Profit Margin (%) 36.87% 38.13% 39.16% 40.07% 39.86% 41.17% 39.70% 39.70% 39.70% 39.70% 39.70% Deferred Income Taxes 532.0 518.0 0.0
Long Term(27) 2.4% 2.4% 3.0% 10. EBIT Margin (%) 13.93% 11.09% 19.55% 18.24% 11.93% 14.80% 12.54% 12.54% 12.54% 12.54% 12.54% Assets of discontinued operations 6,227.0 0.0 0.0
Fully Diluted Shares Outstanding
LTM Return on Investment Ratios
LTM Credit Statistics
Cash Flow Statement Data
Growth Rates
Estimates
DD Fiscal Year Ended December 31,
NYSE
31-Dec
NA
NA
1.68
40.00%
Market Data
Adjusted Income Statement
Trading Multiples
E. I. Du Pont de Nemours and Company (NYSE:DD)
General Information Reported Income Statement Balance Sheet Data
E. I. Du Pont de Nemours and Company Extended Historical Period Projection Period