Download as PDF, PPTX


![VALIDATION OF RESULTS
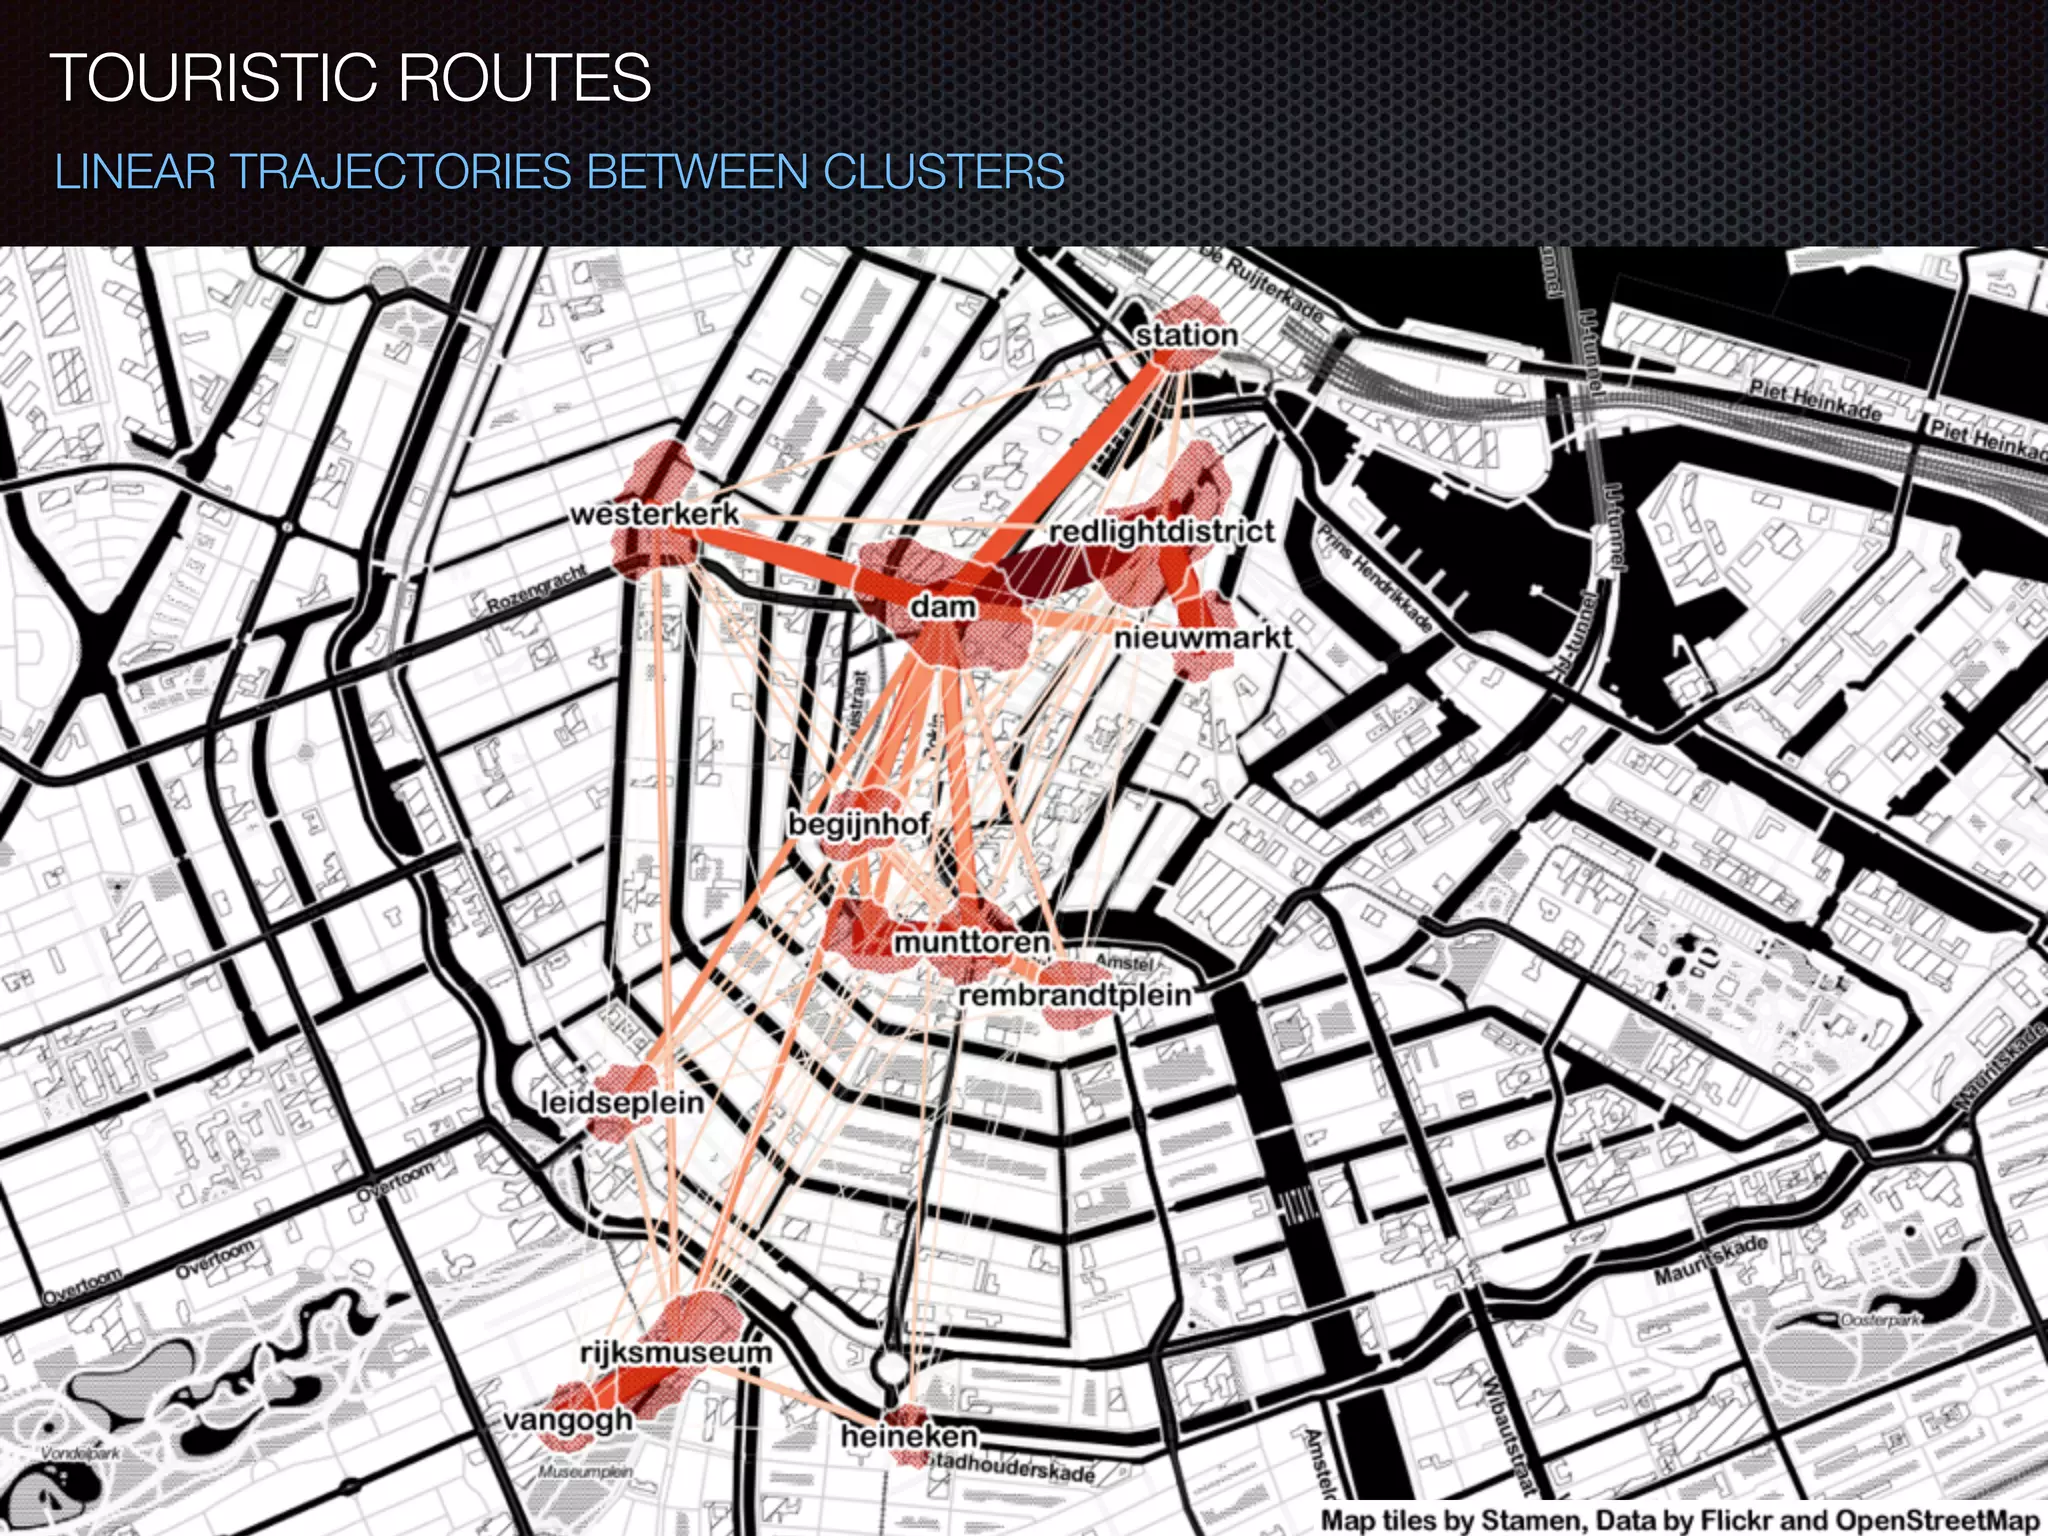
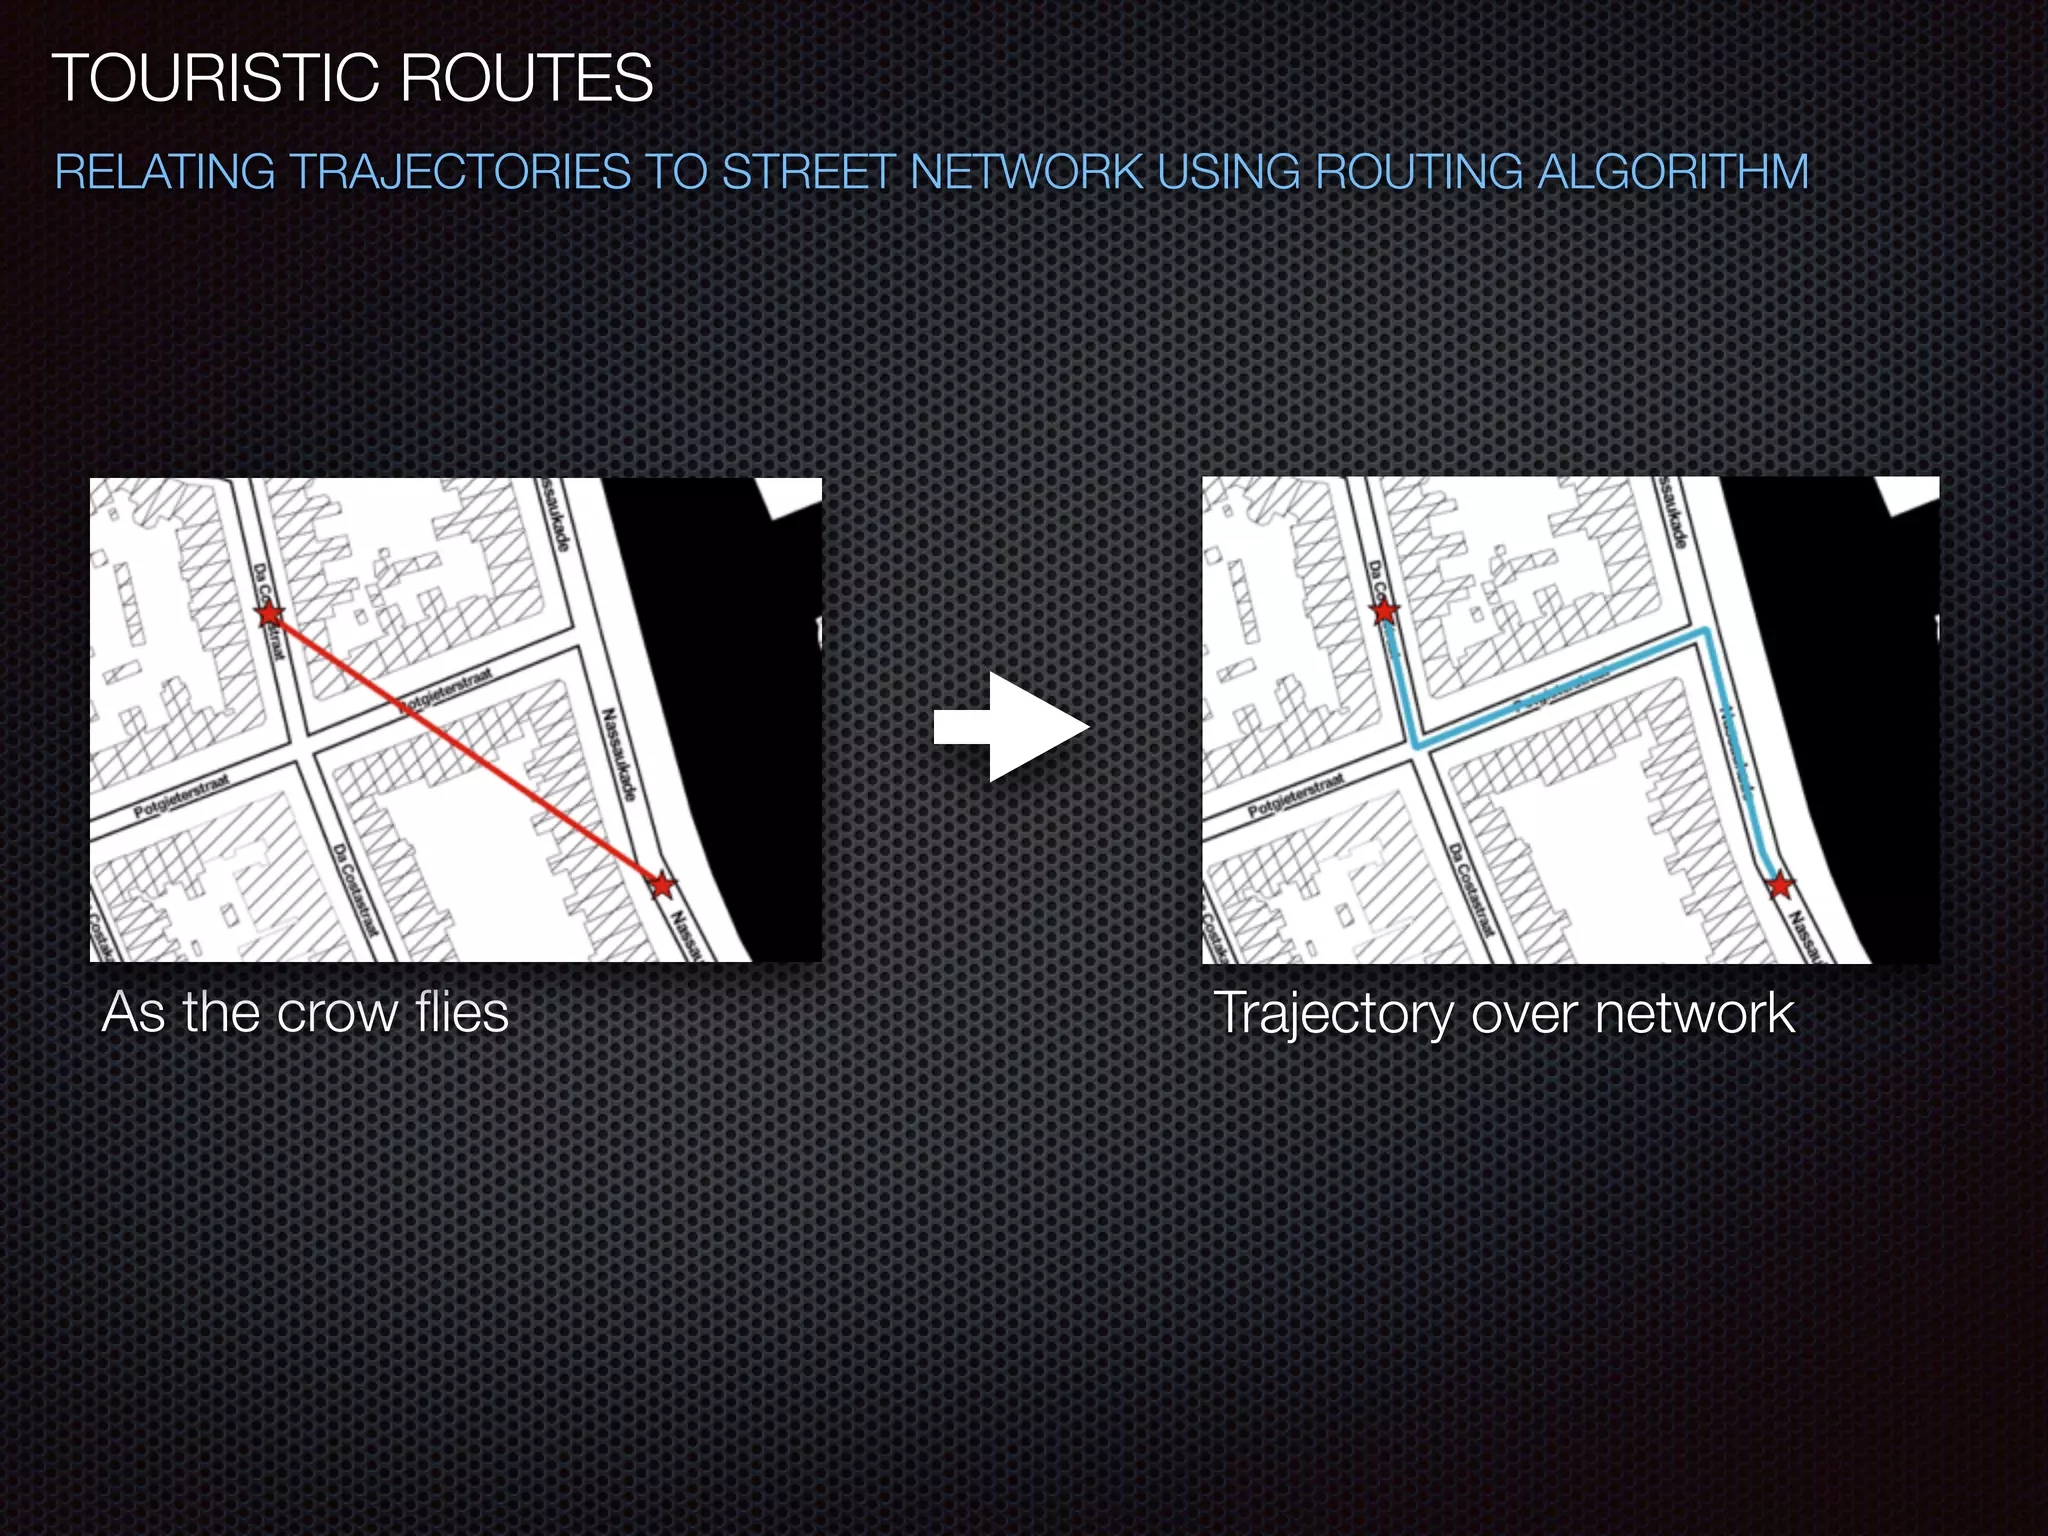
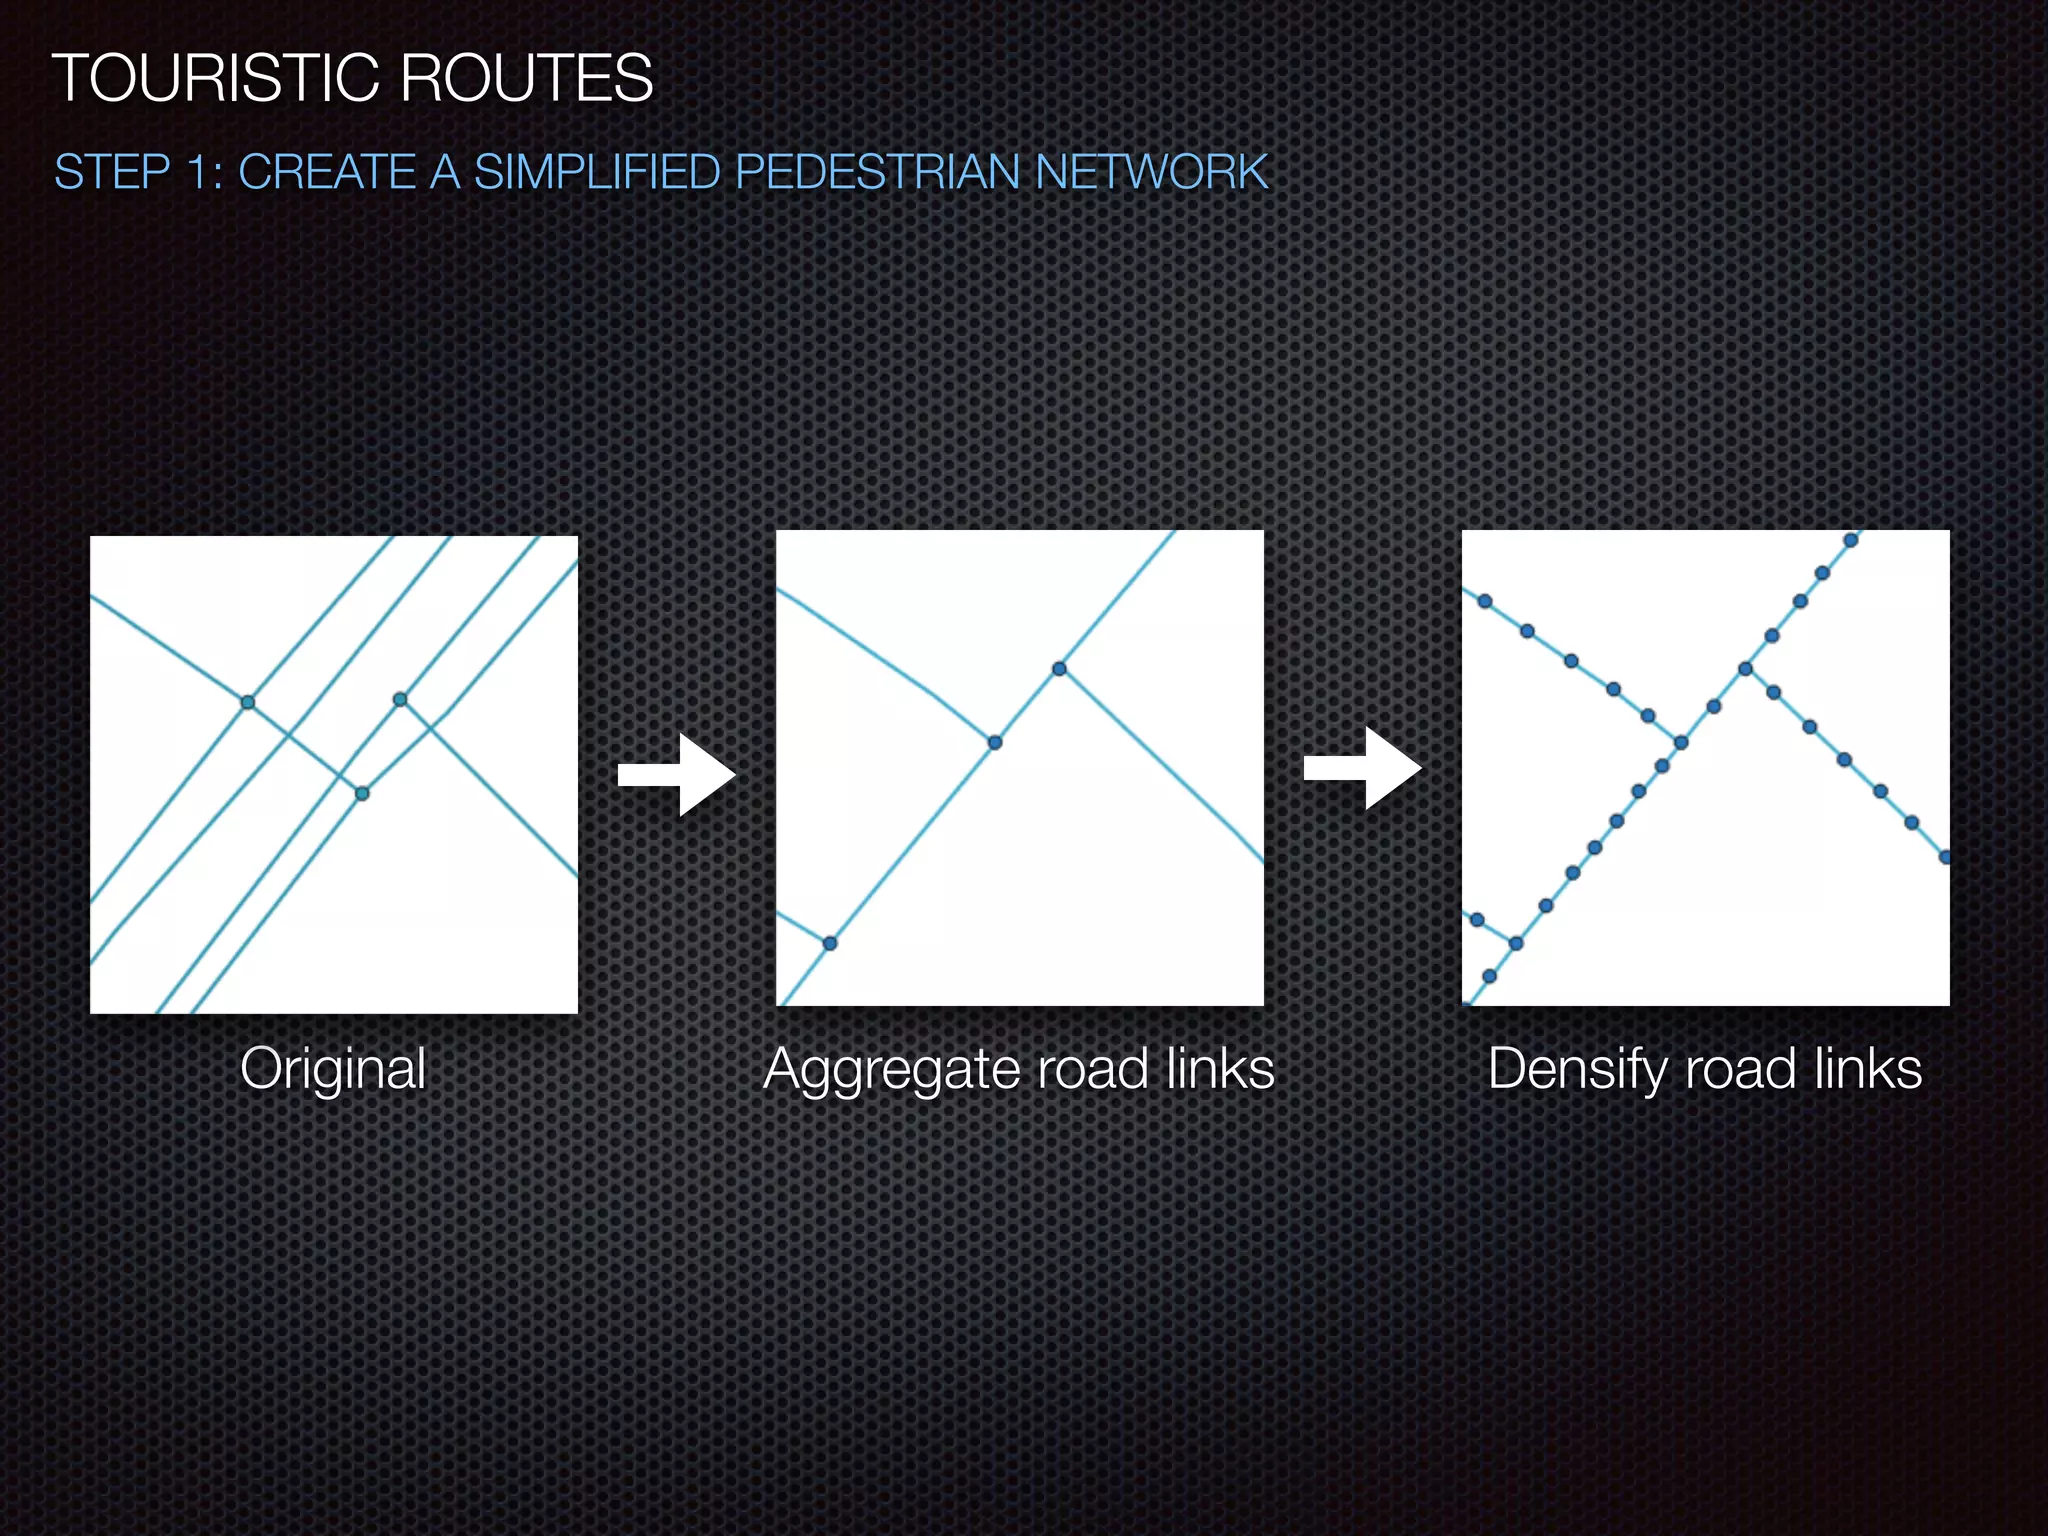
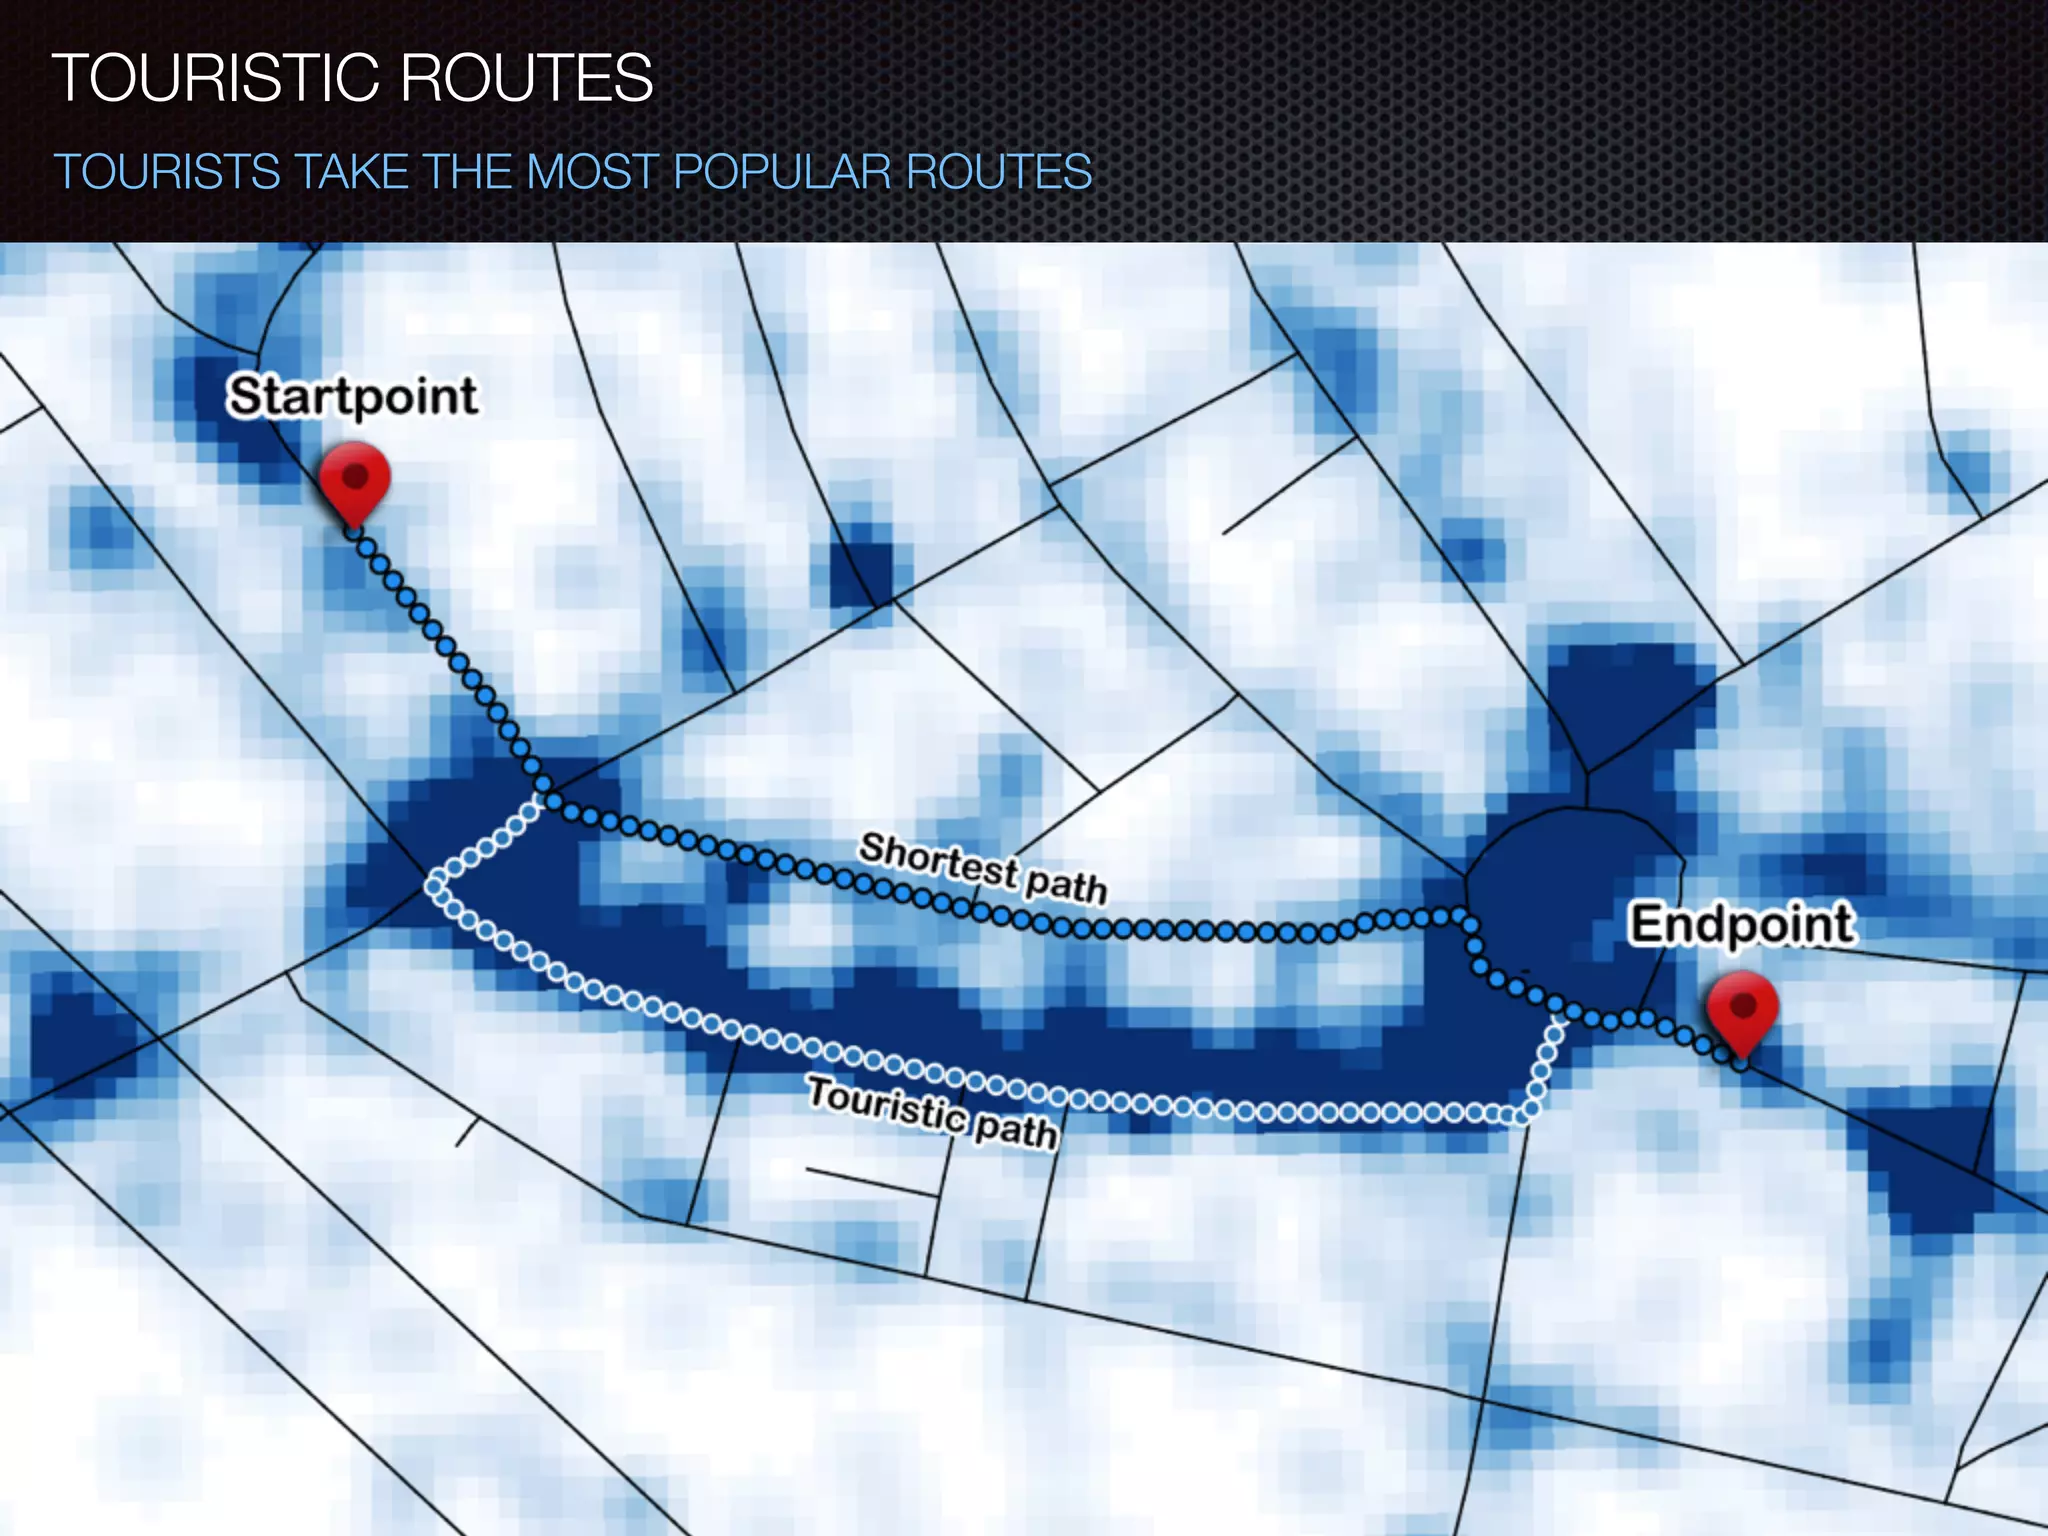
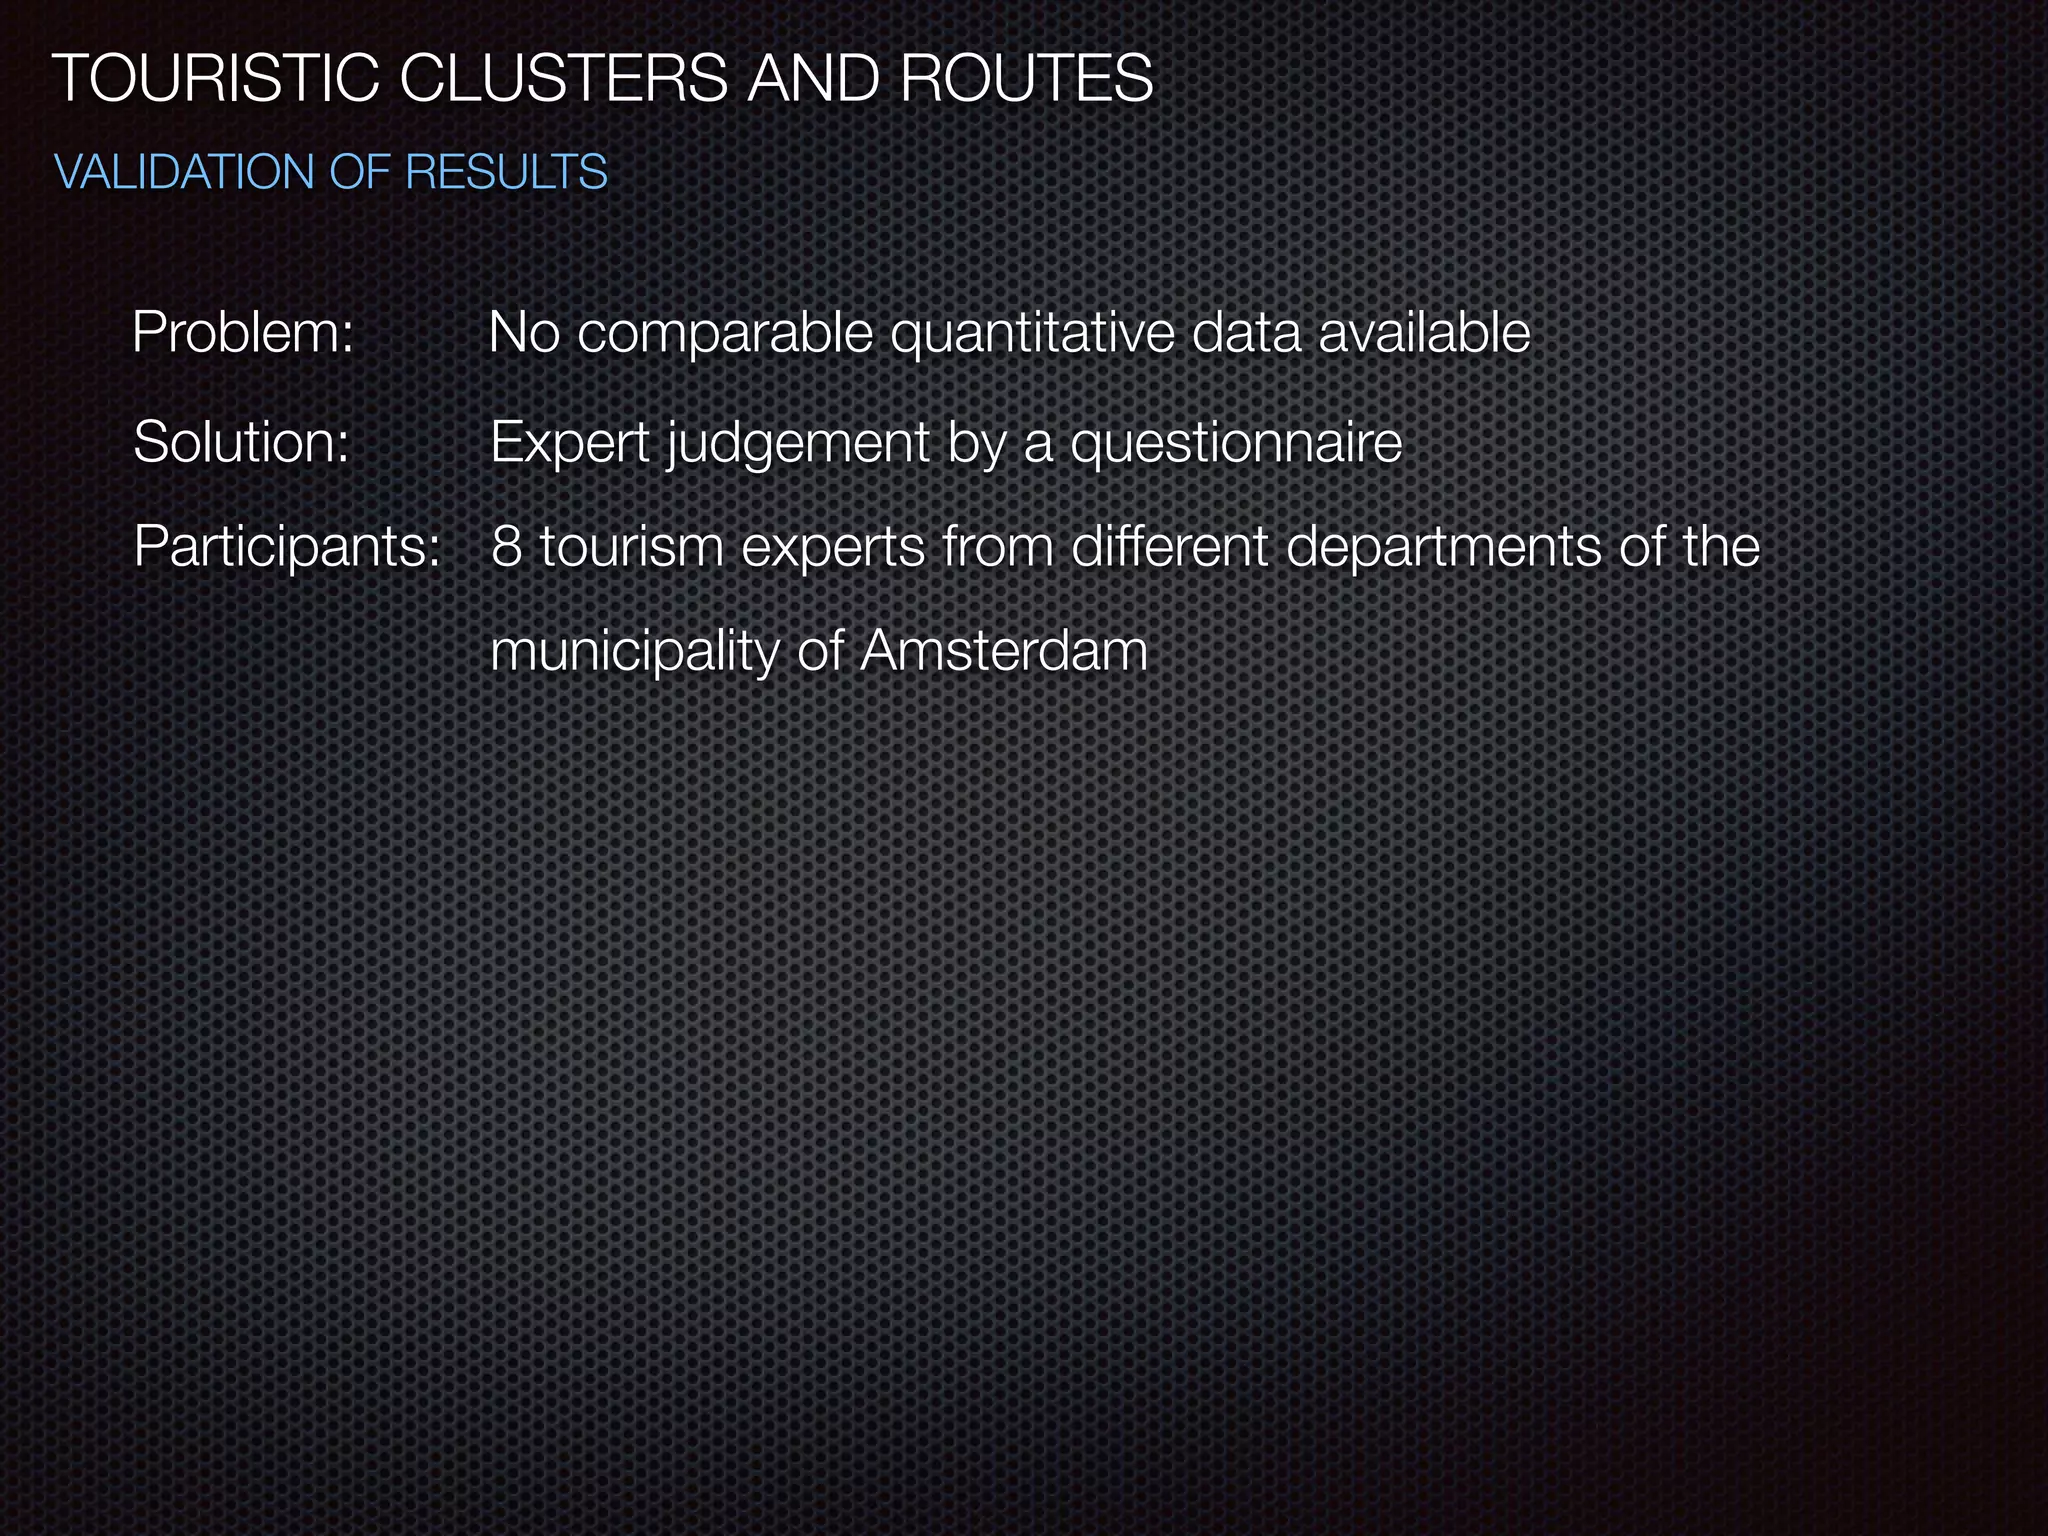
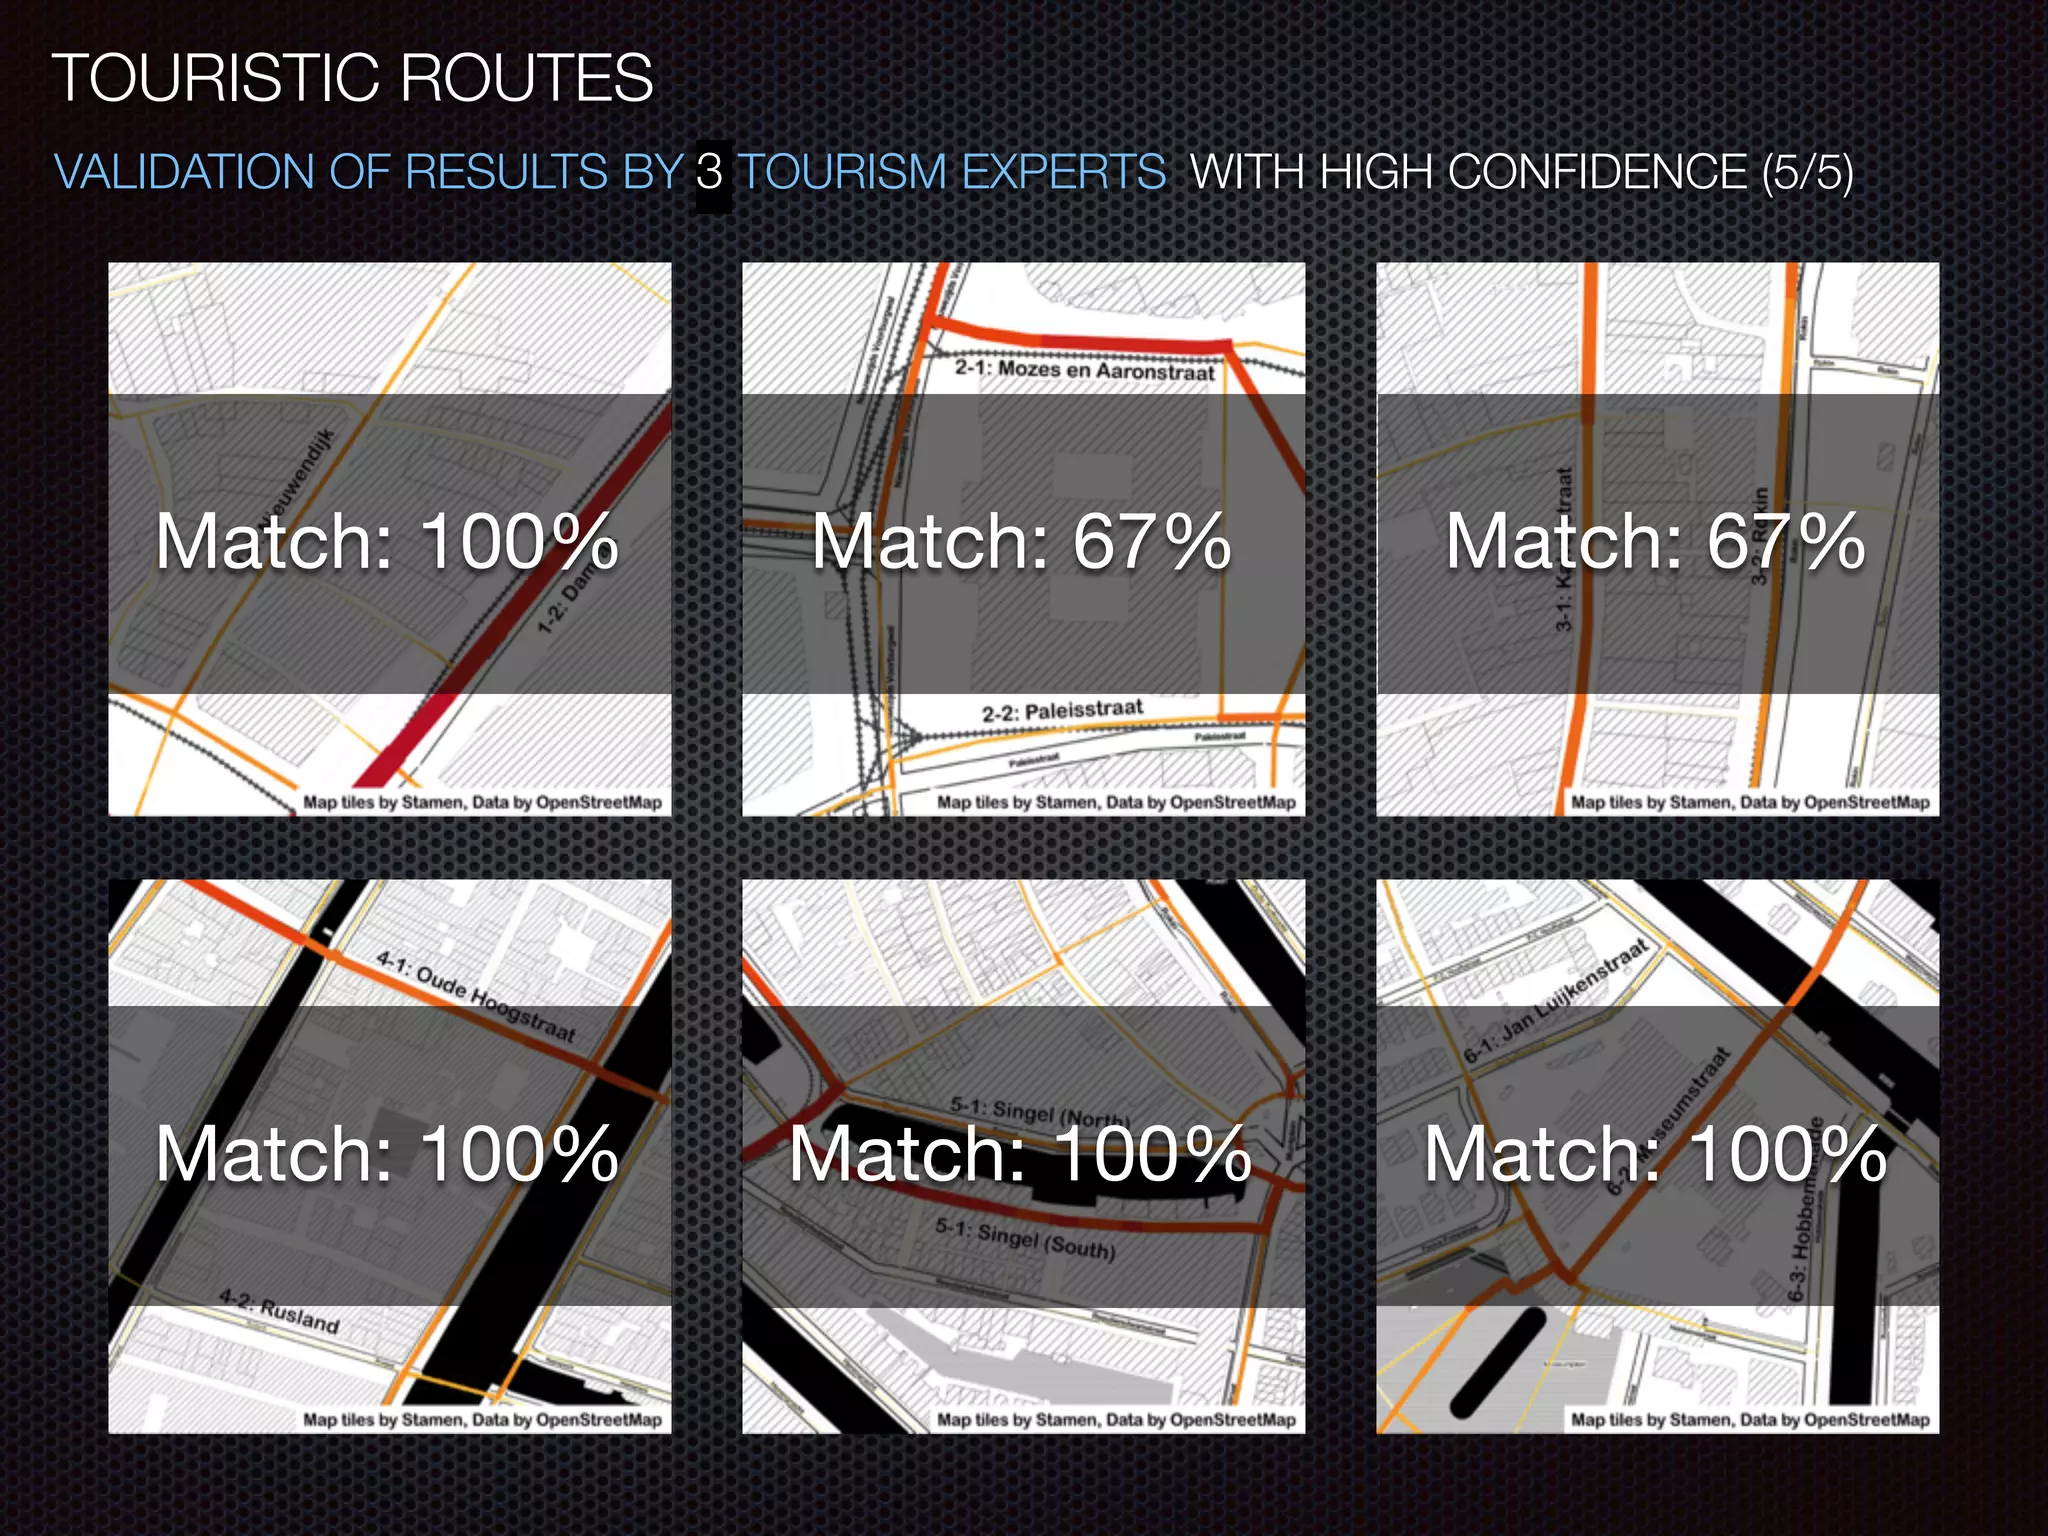
TOURISTIC CLUSTERS AND ROUTES
Expert # Profession
Validity
results [1-5]
Usefulness
results [1-5]
1 Policy Advisor Traffic & Public Space 4 5
2 Data Analyst, Information en Statistics 4 4
3 Senior Advisor Traffic Management 4 4
4 Researcher, Information en Statistics 3 4
5 Senior Advisor Traffic Research 5 4
6 Urban Planner 5 5
7 Urban Planner 4 5
8 Urban Designer 4 5
4.1 4.5
How well do the study outcomes resemble the real world?
Are the study outcomes useful for you or for your organization?
*
**
* **](https://image.slidesharecdn.com/colloquiumpdf-150417042952-conversion-gate01/75/Revealing-spatial-and-temporal-patterns-from-Flickr-photography-a-case-study-with-tourists-in-Amsterdam-50-2048.jpg)
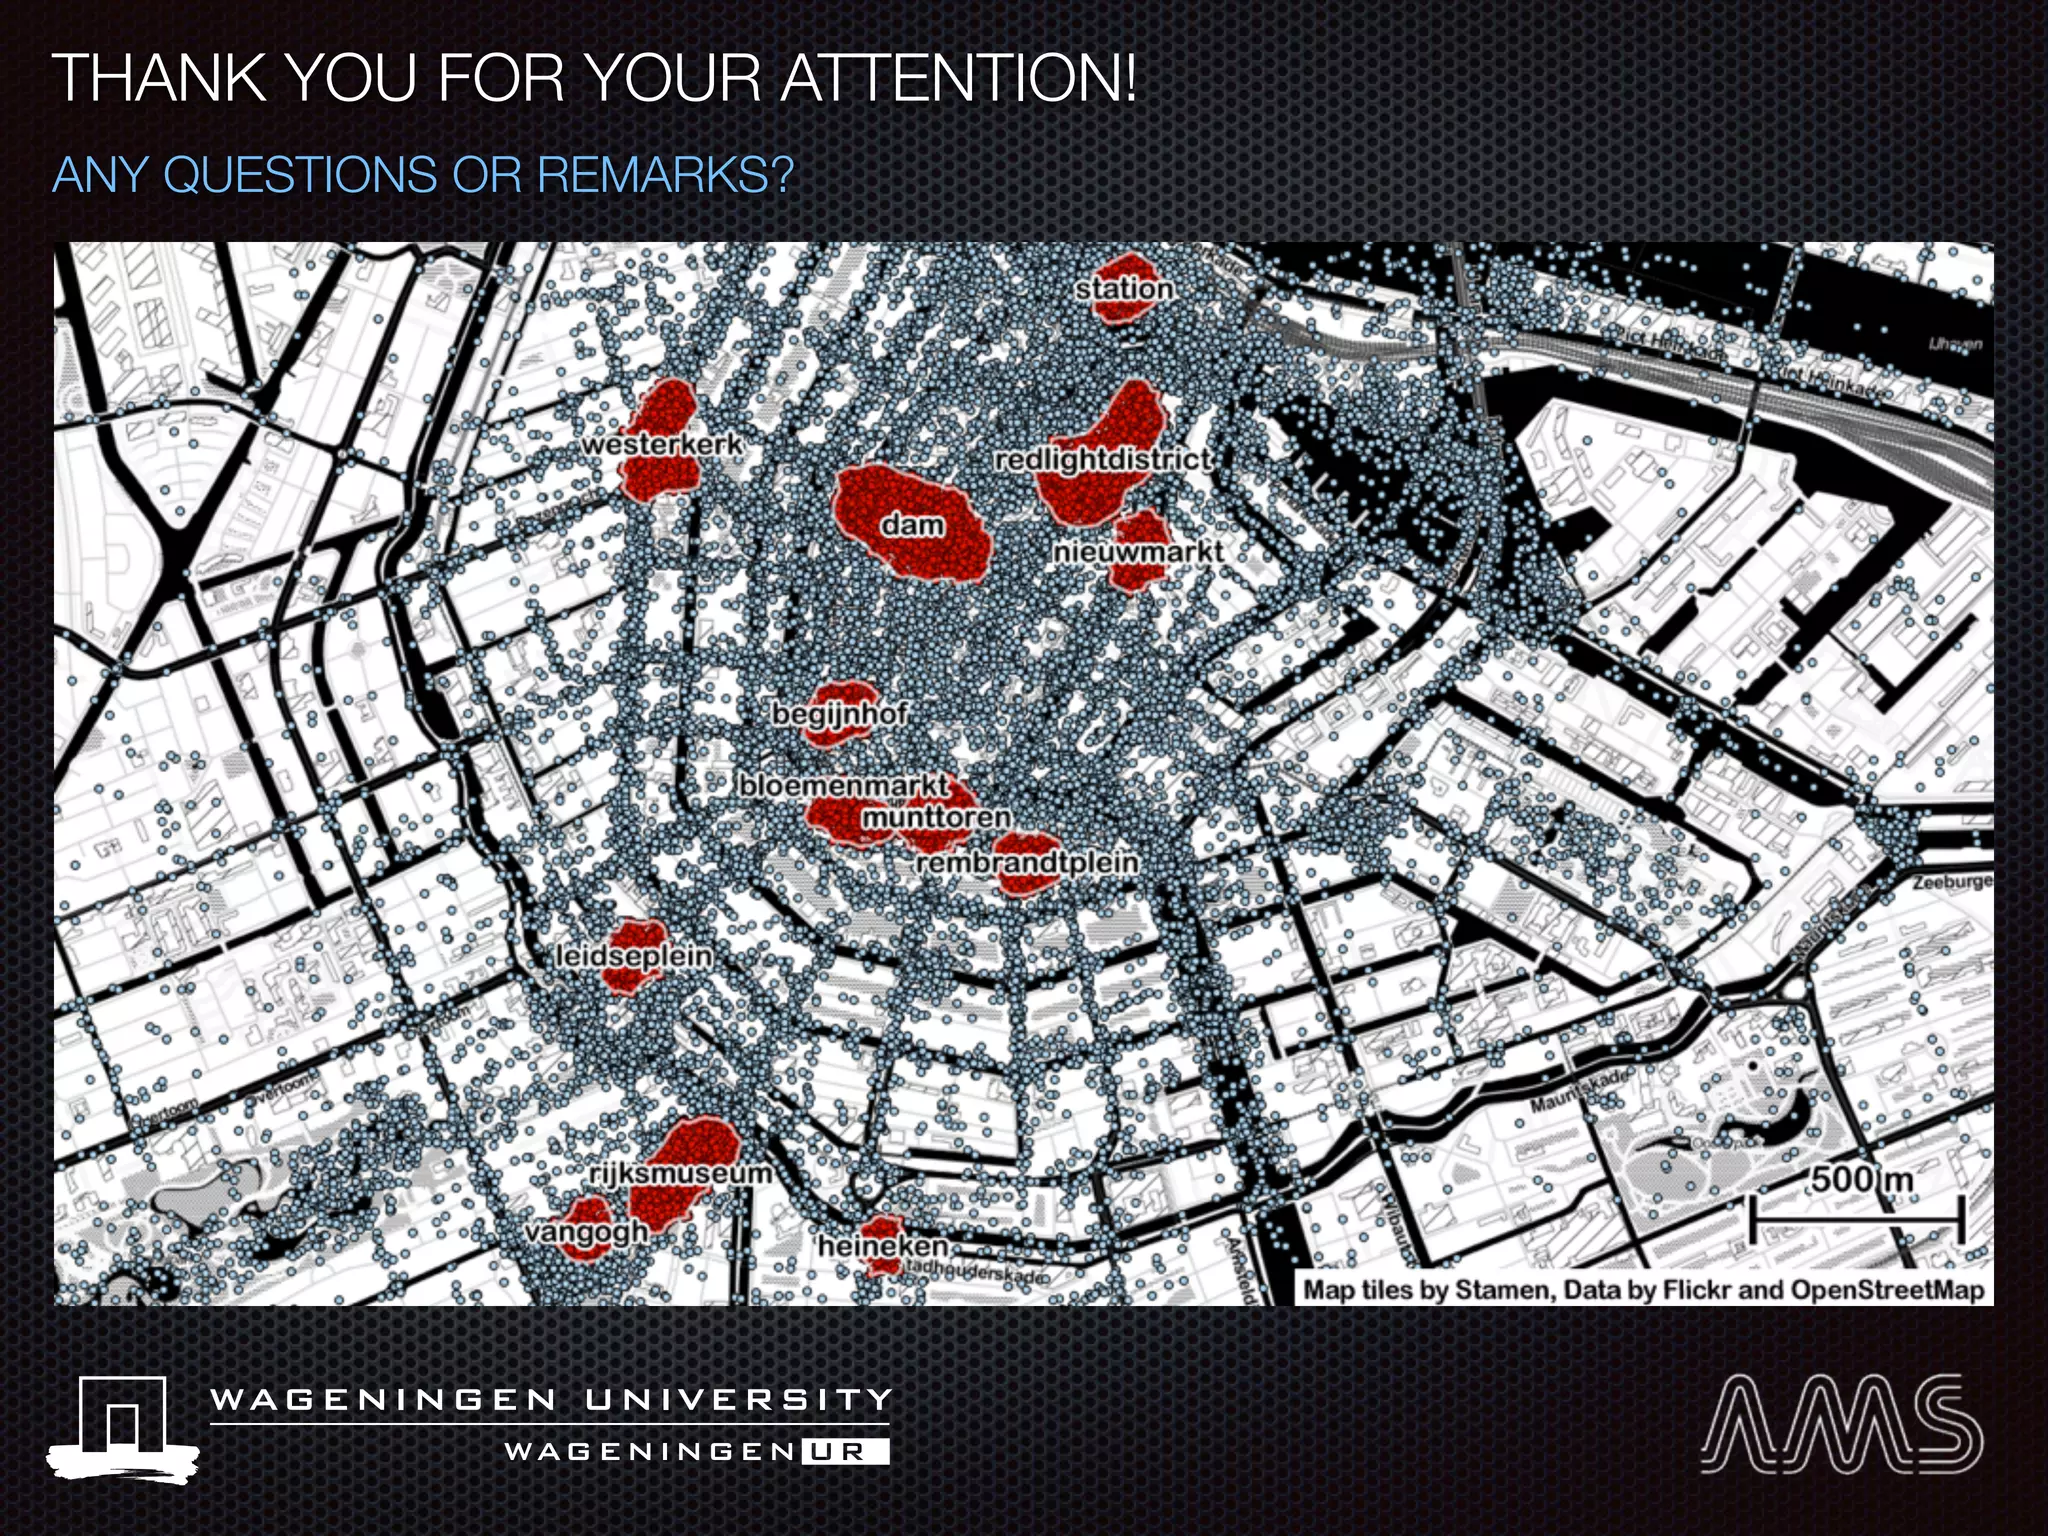

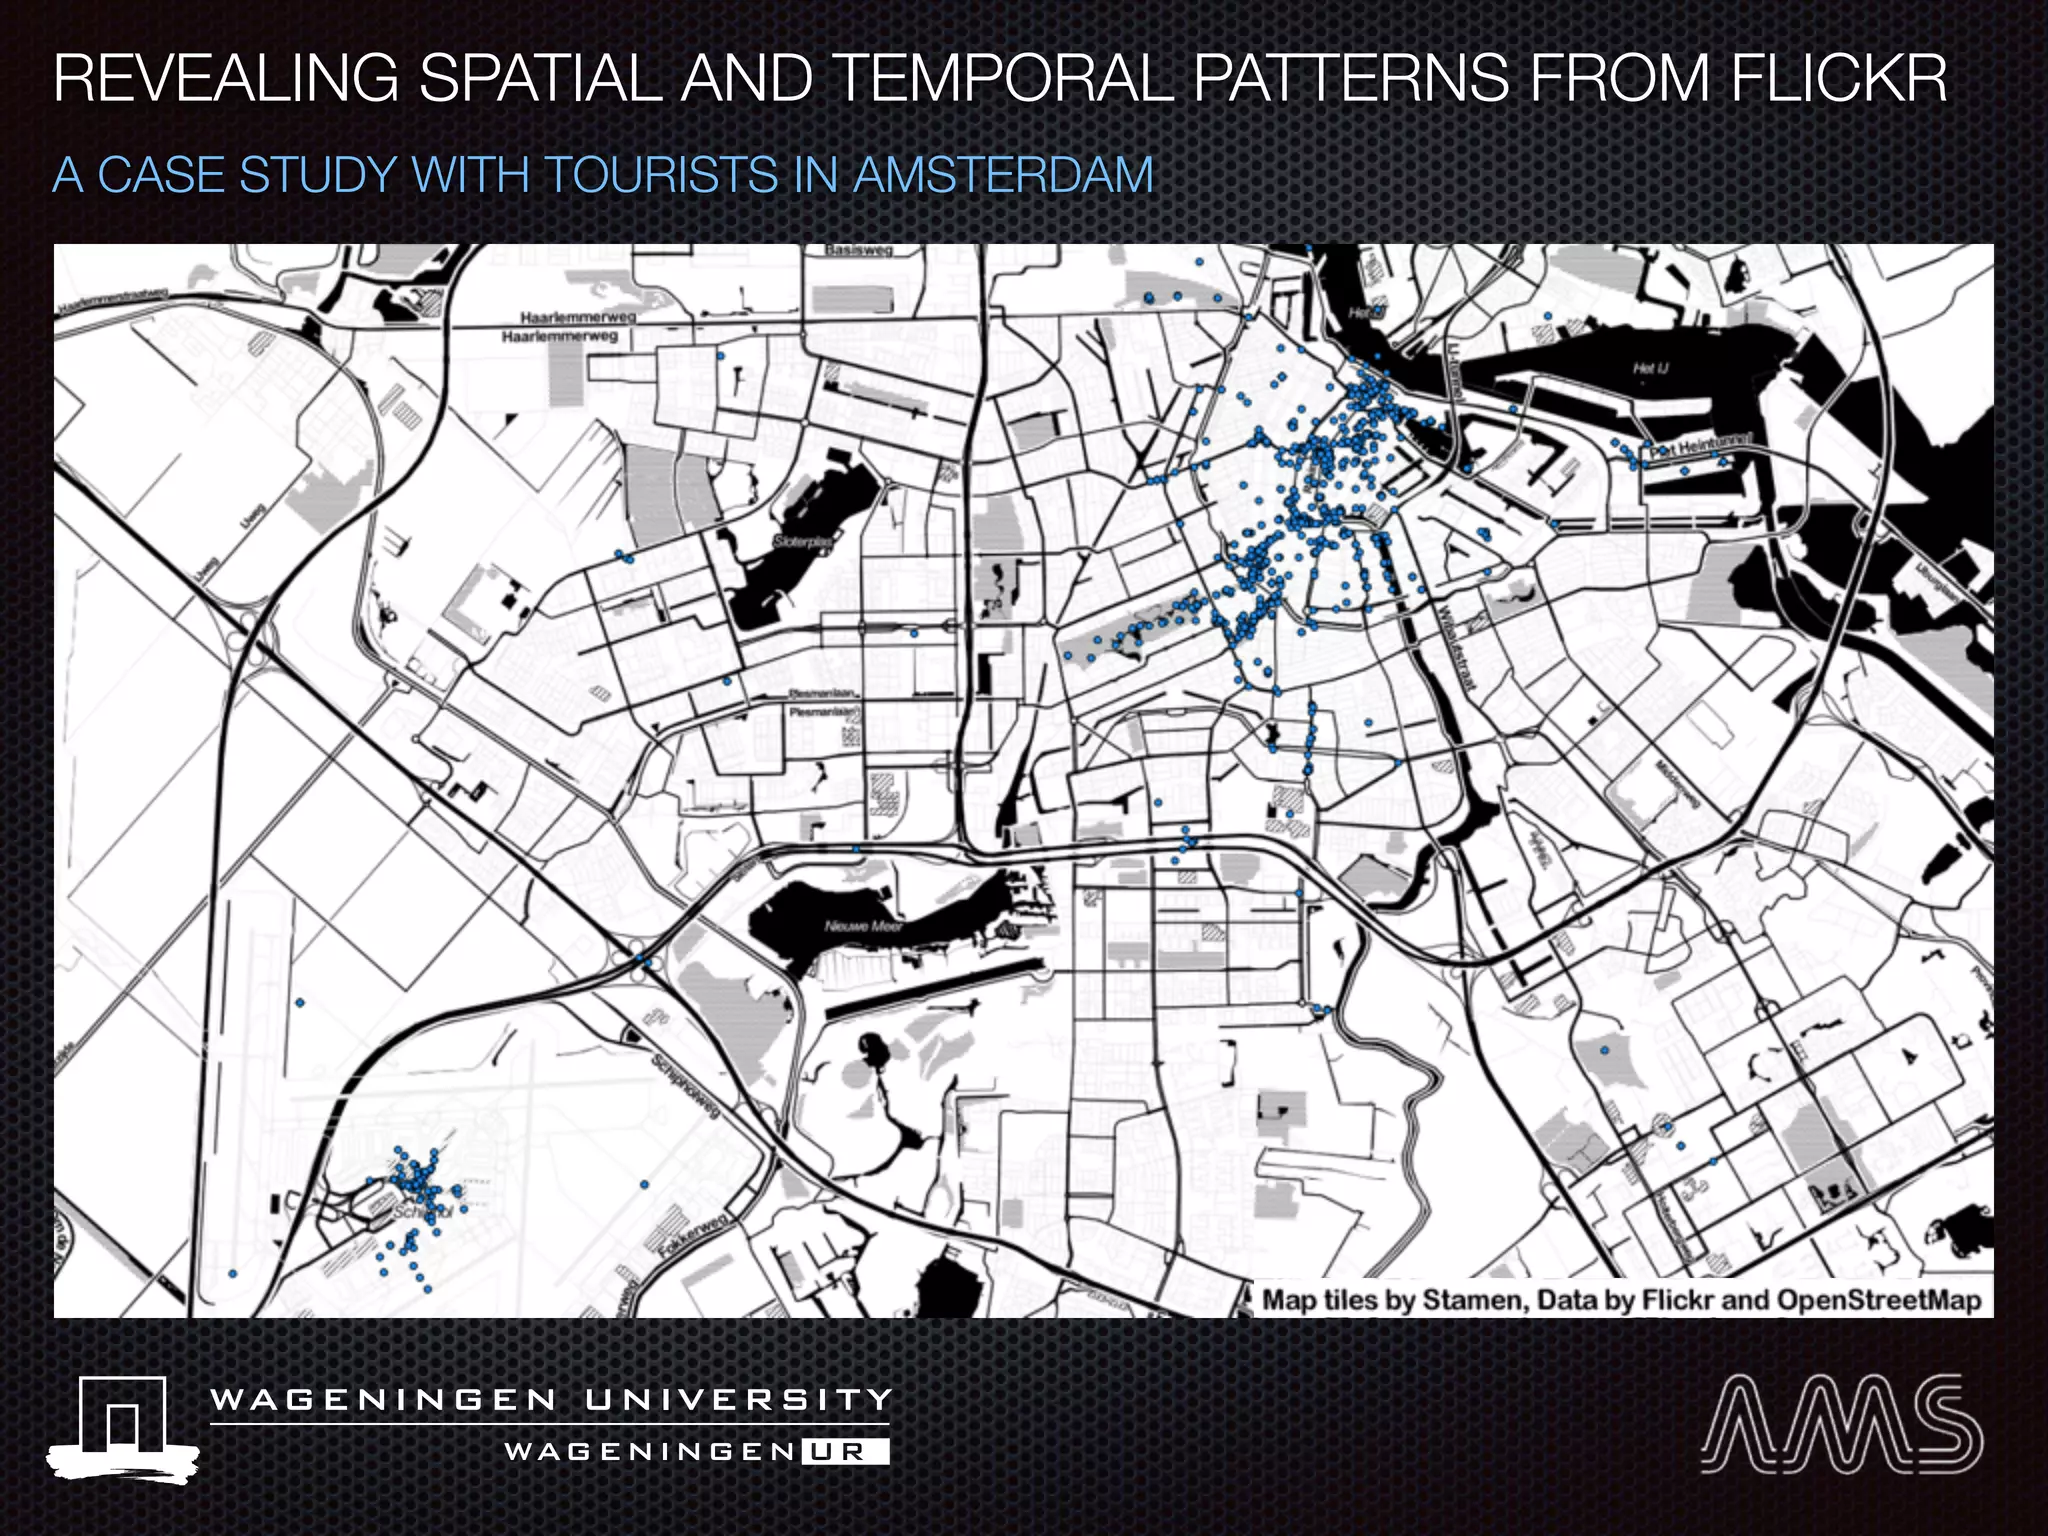
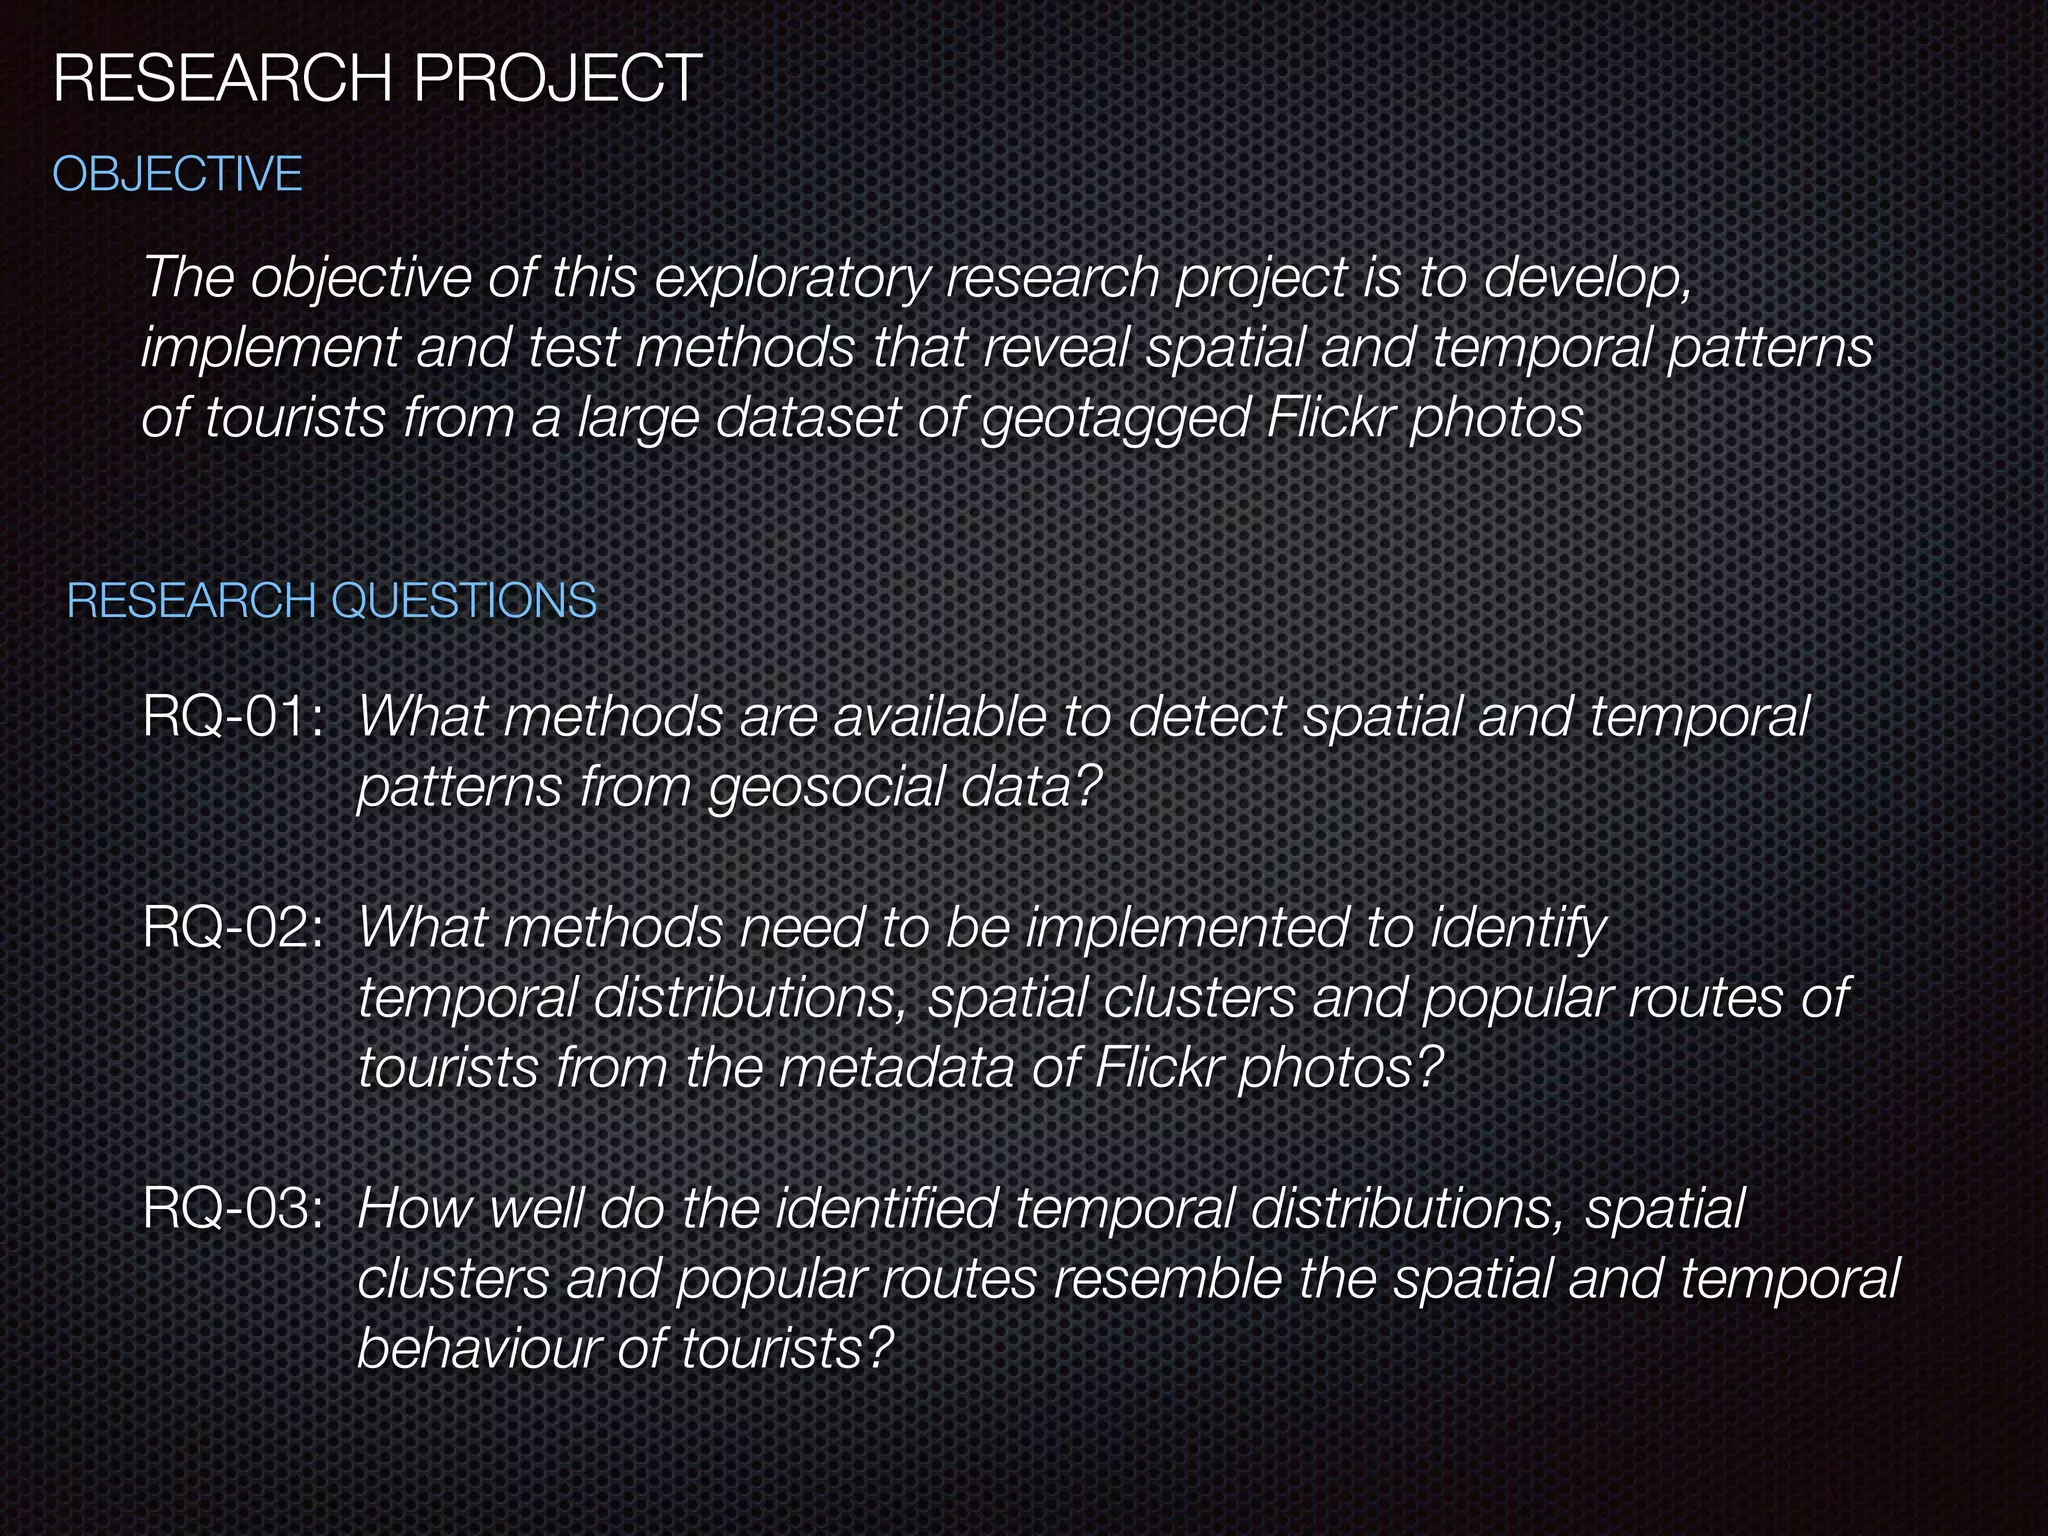
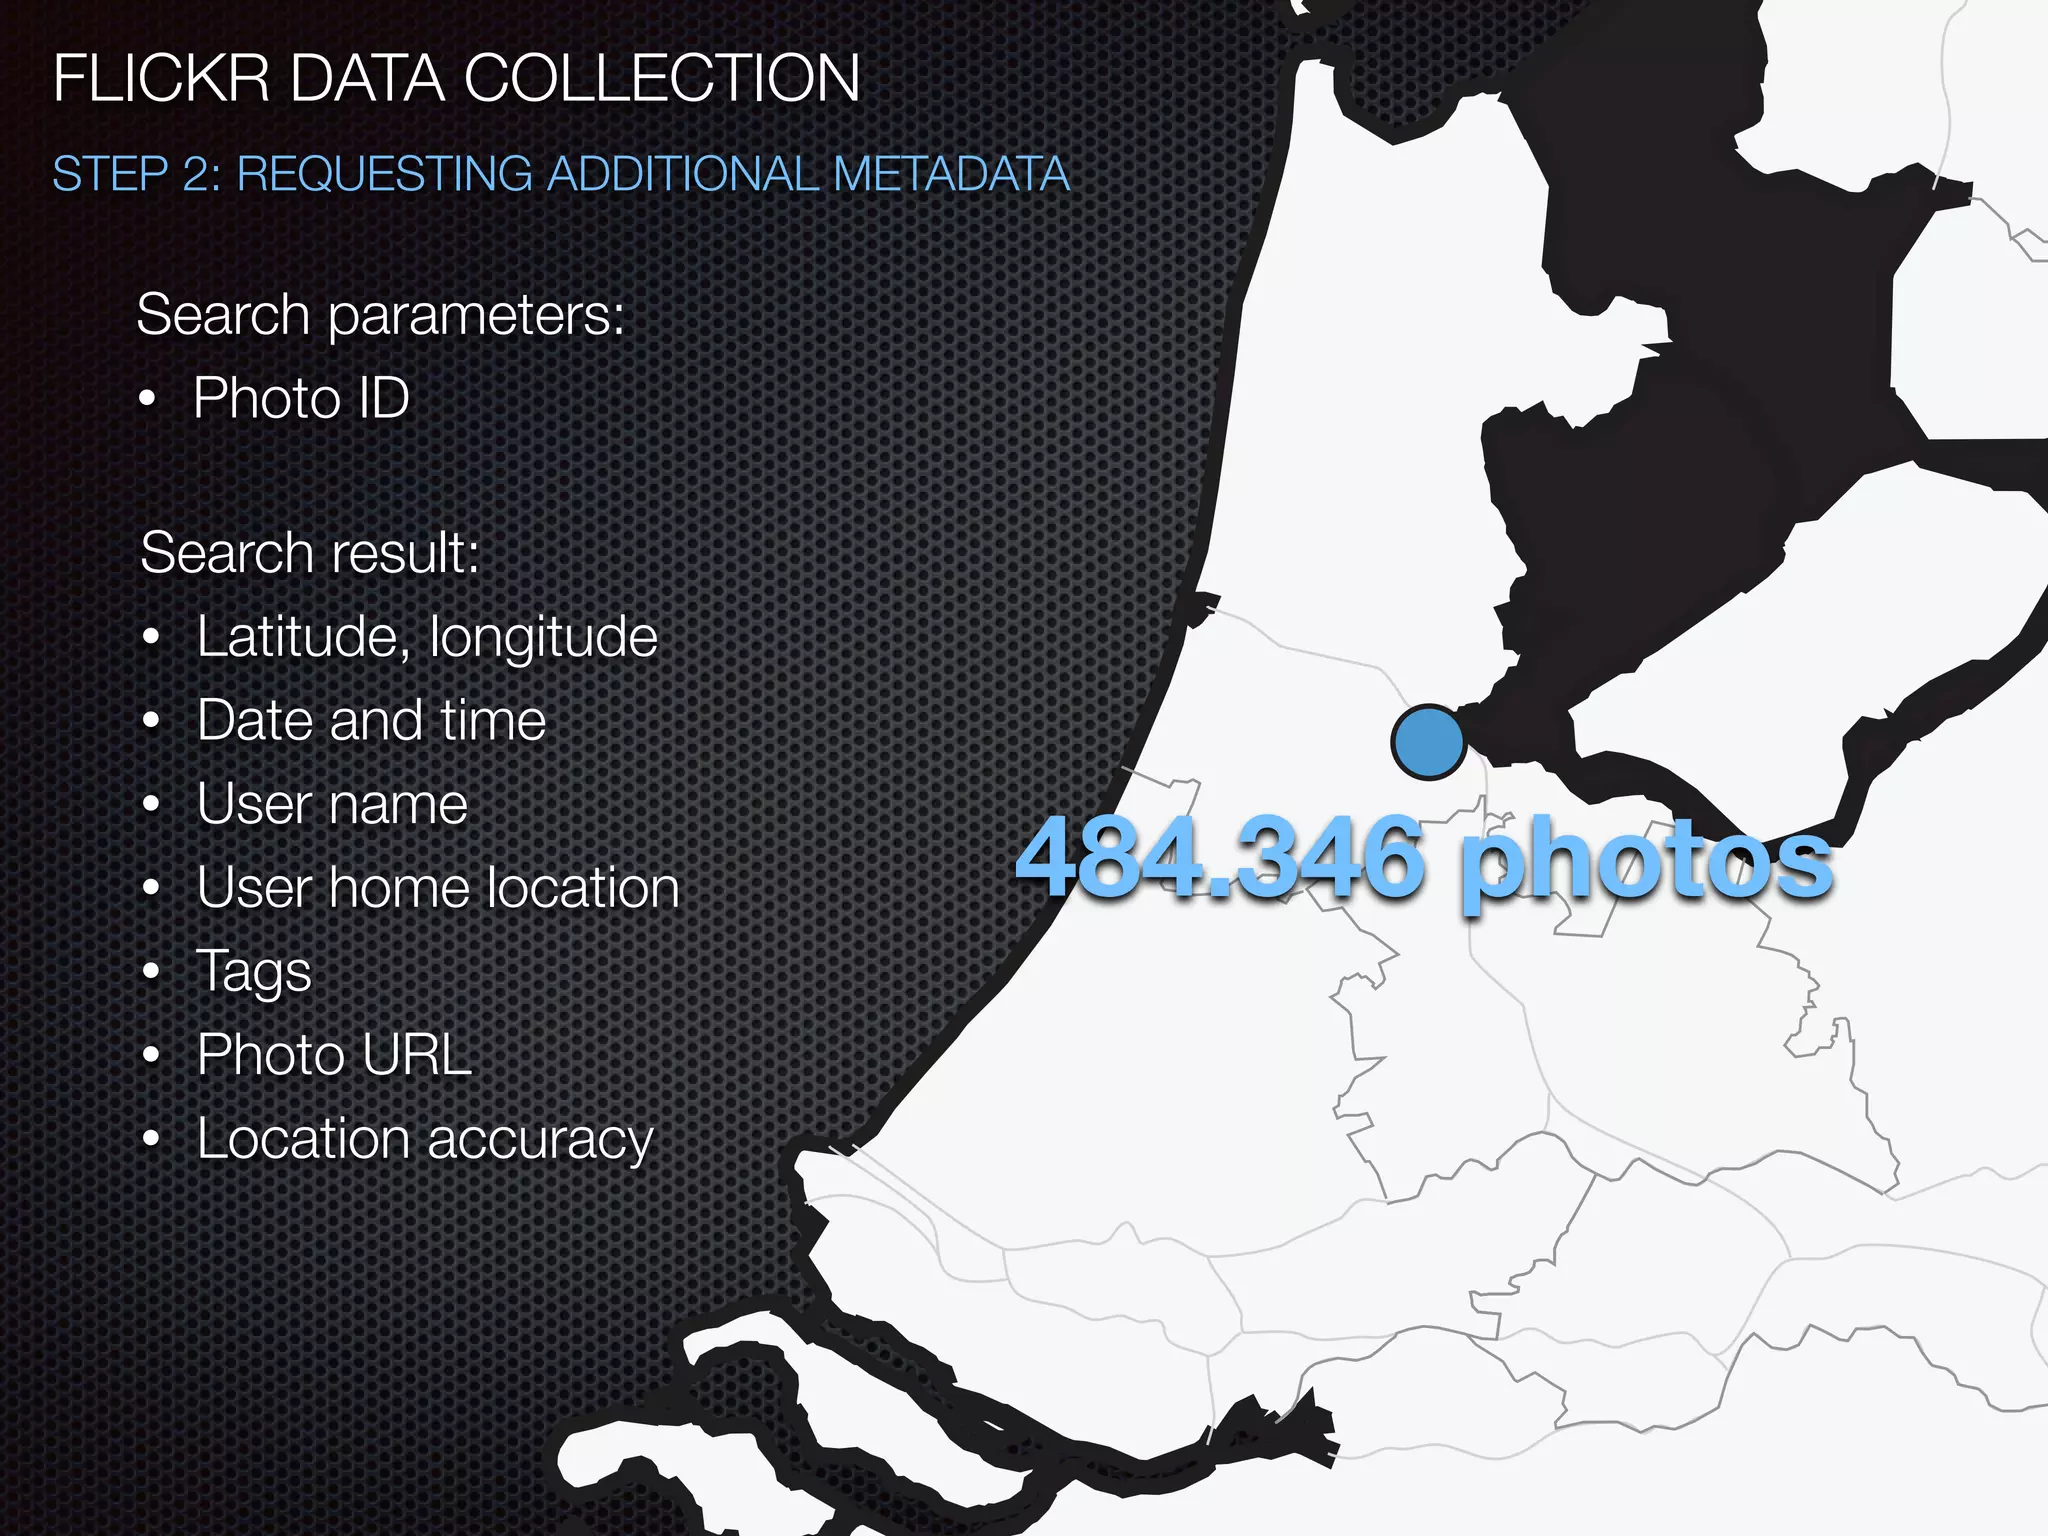
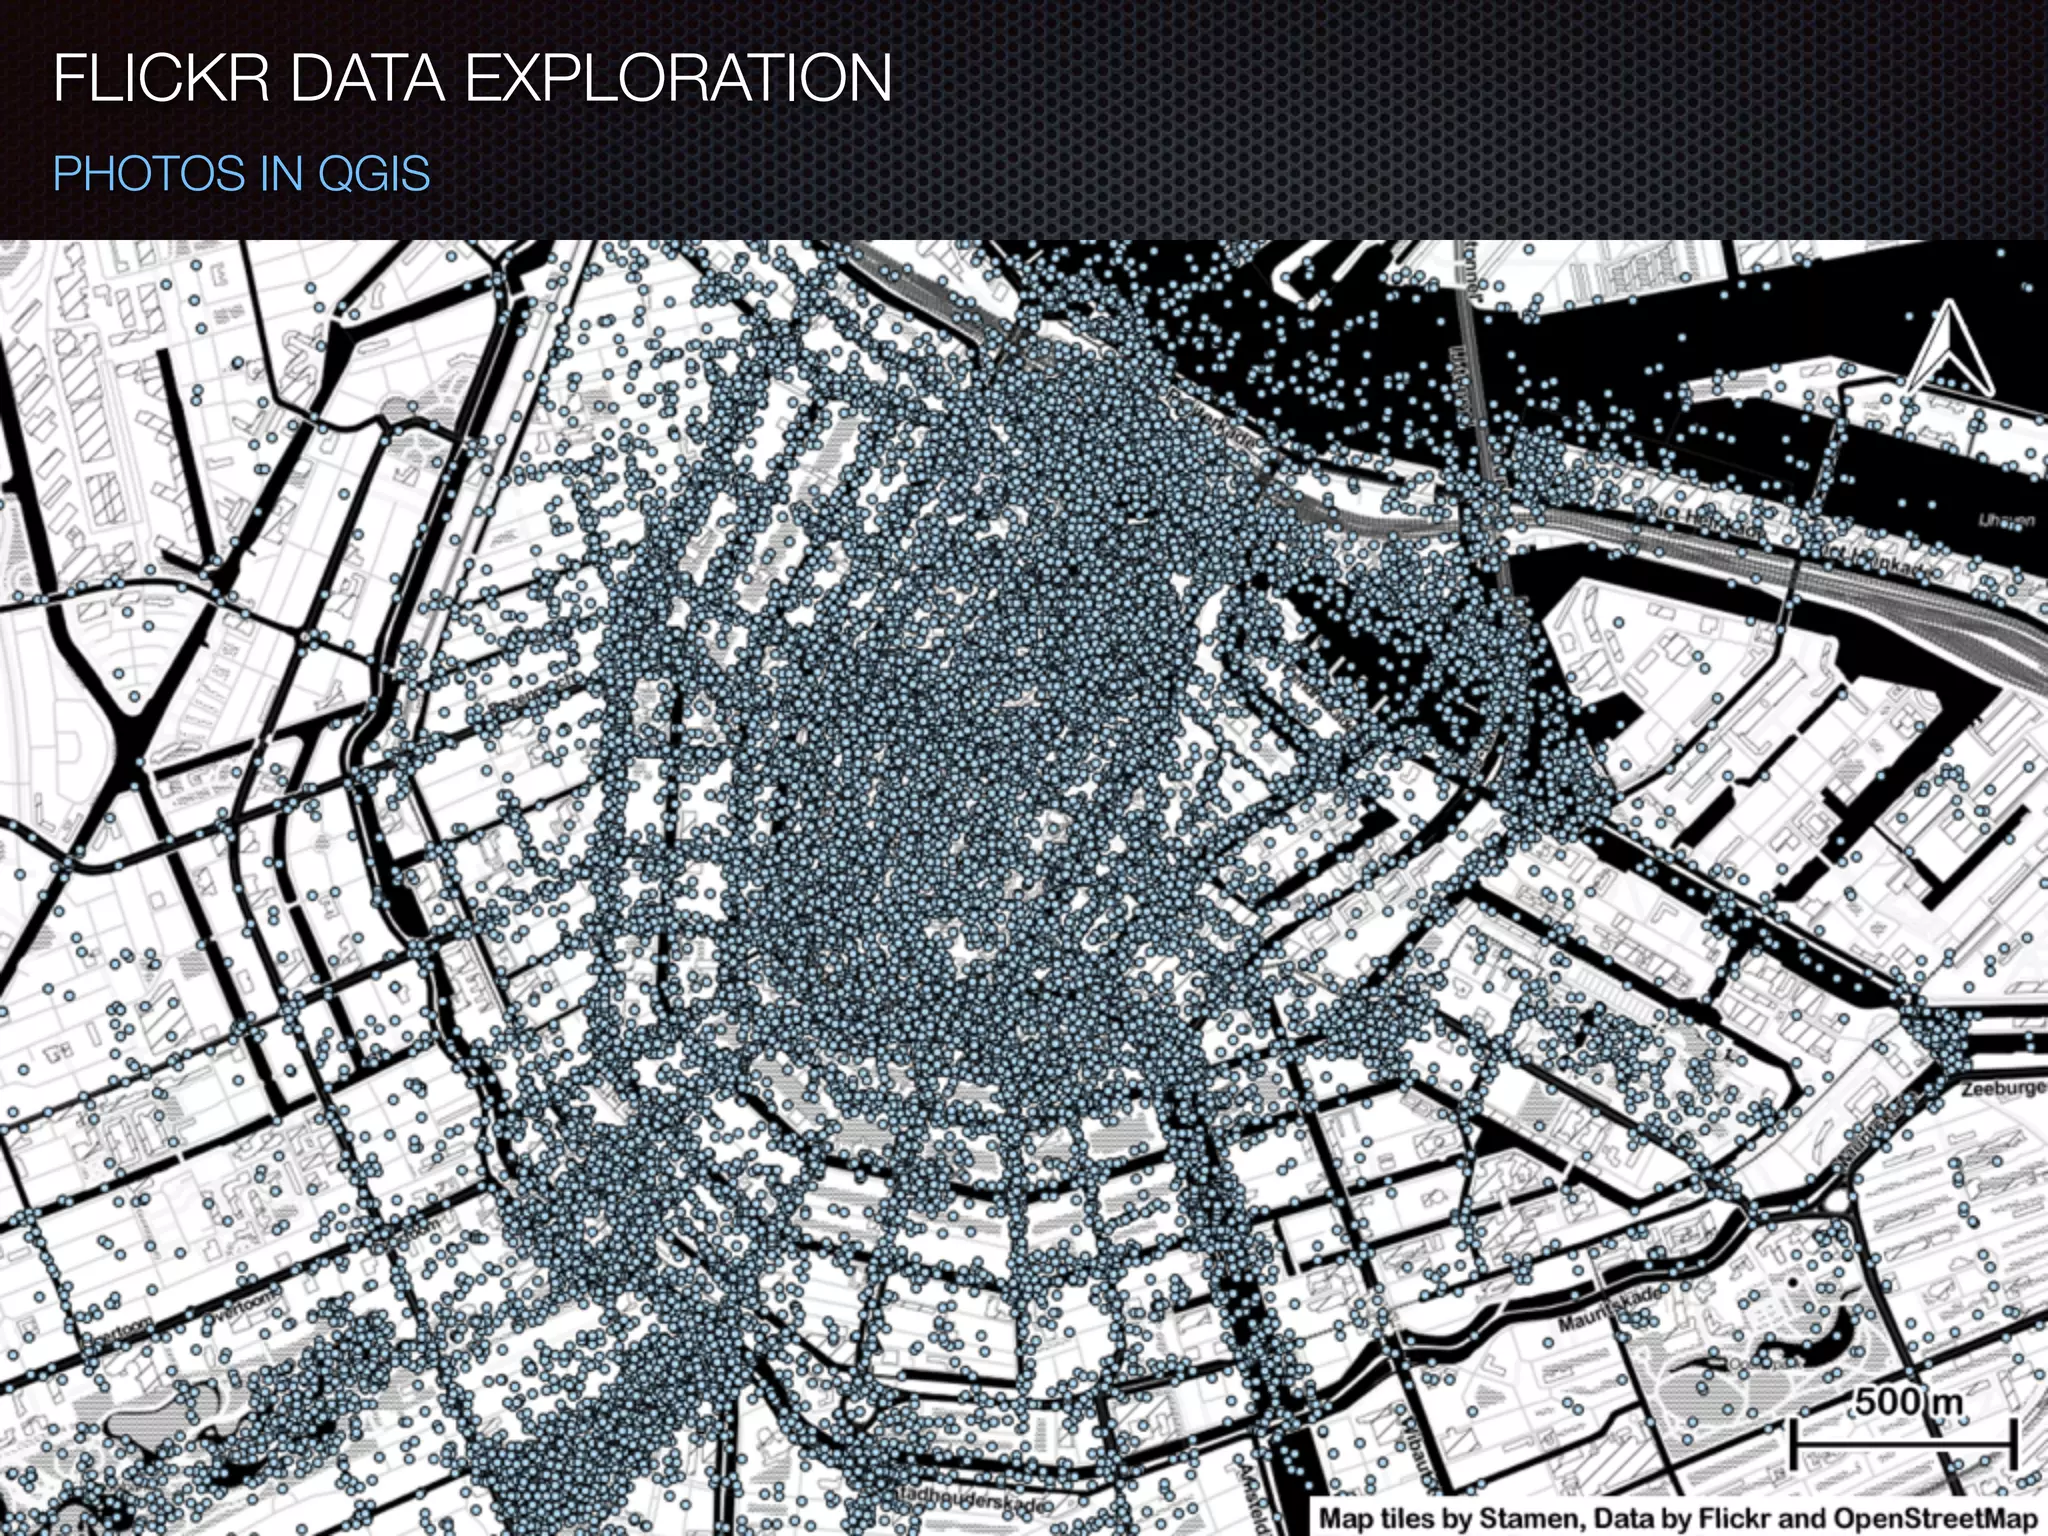
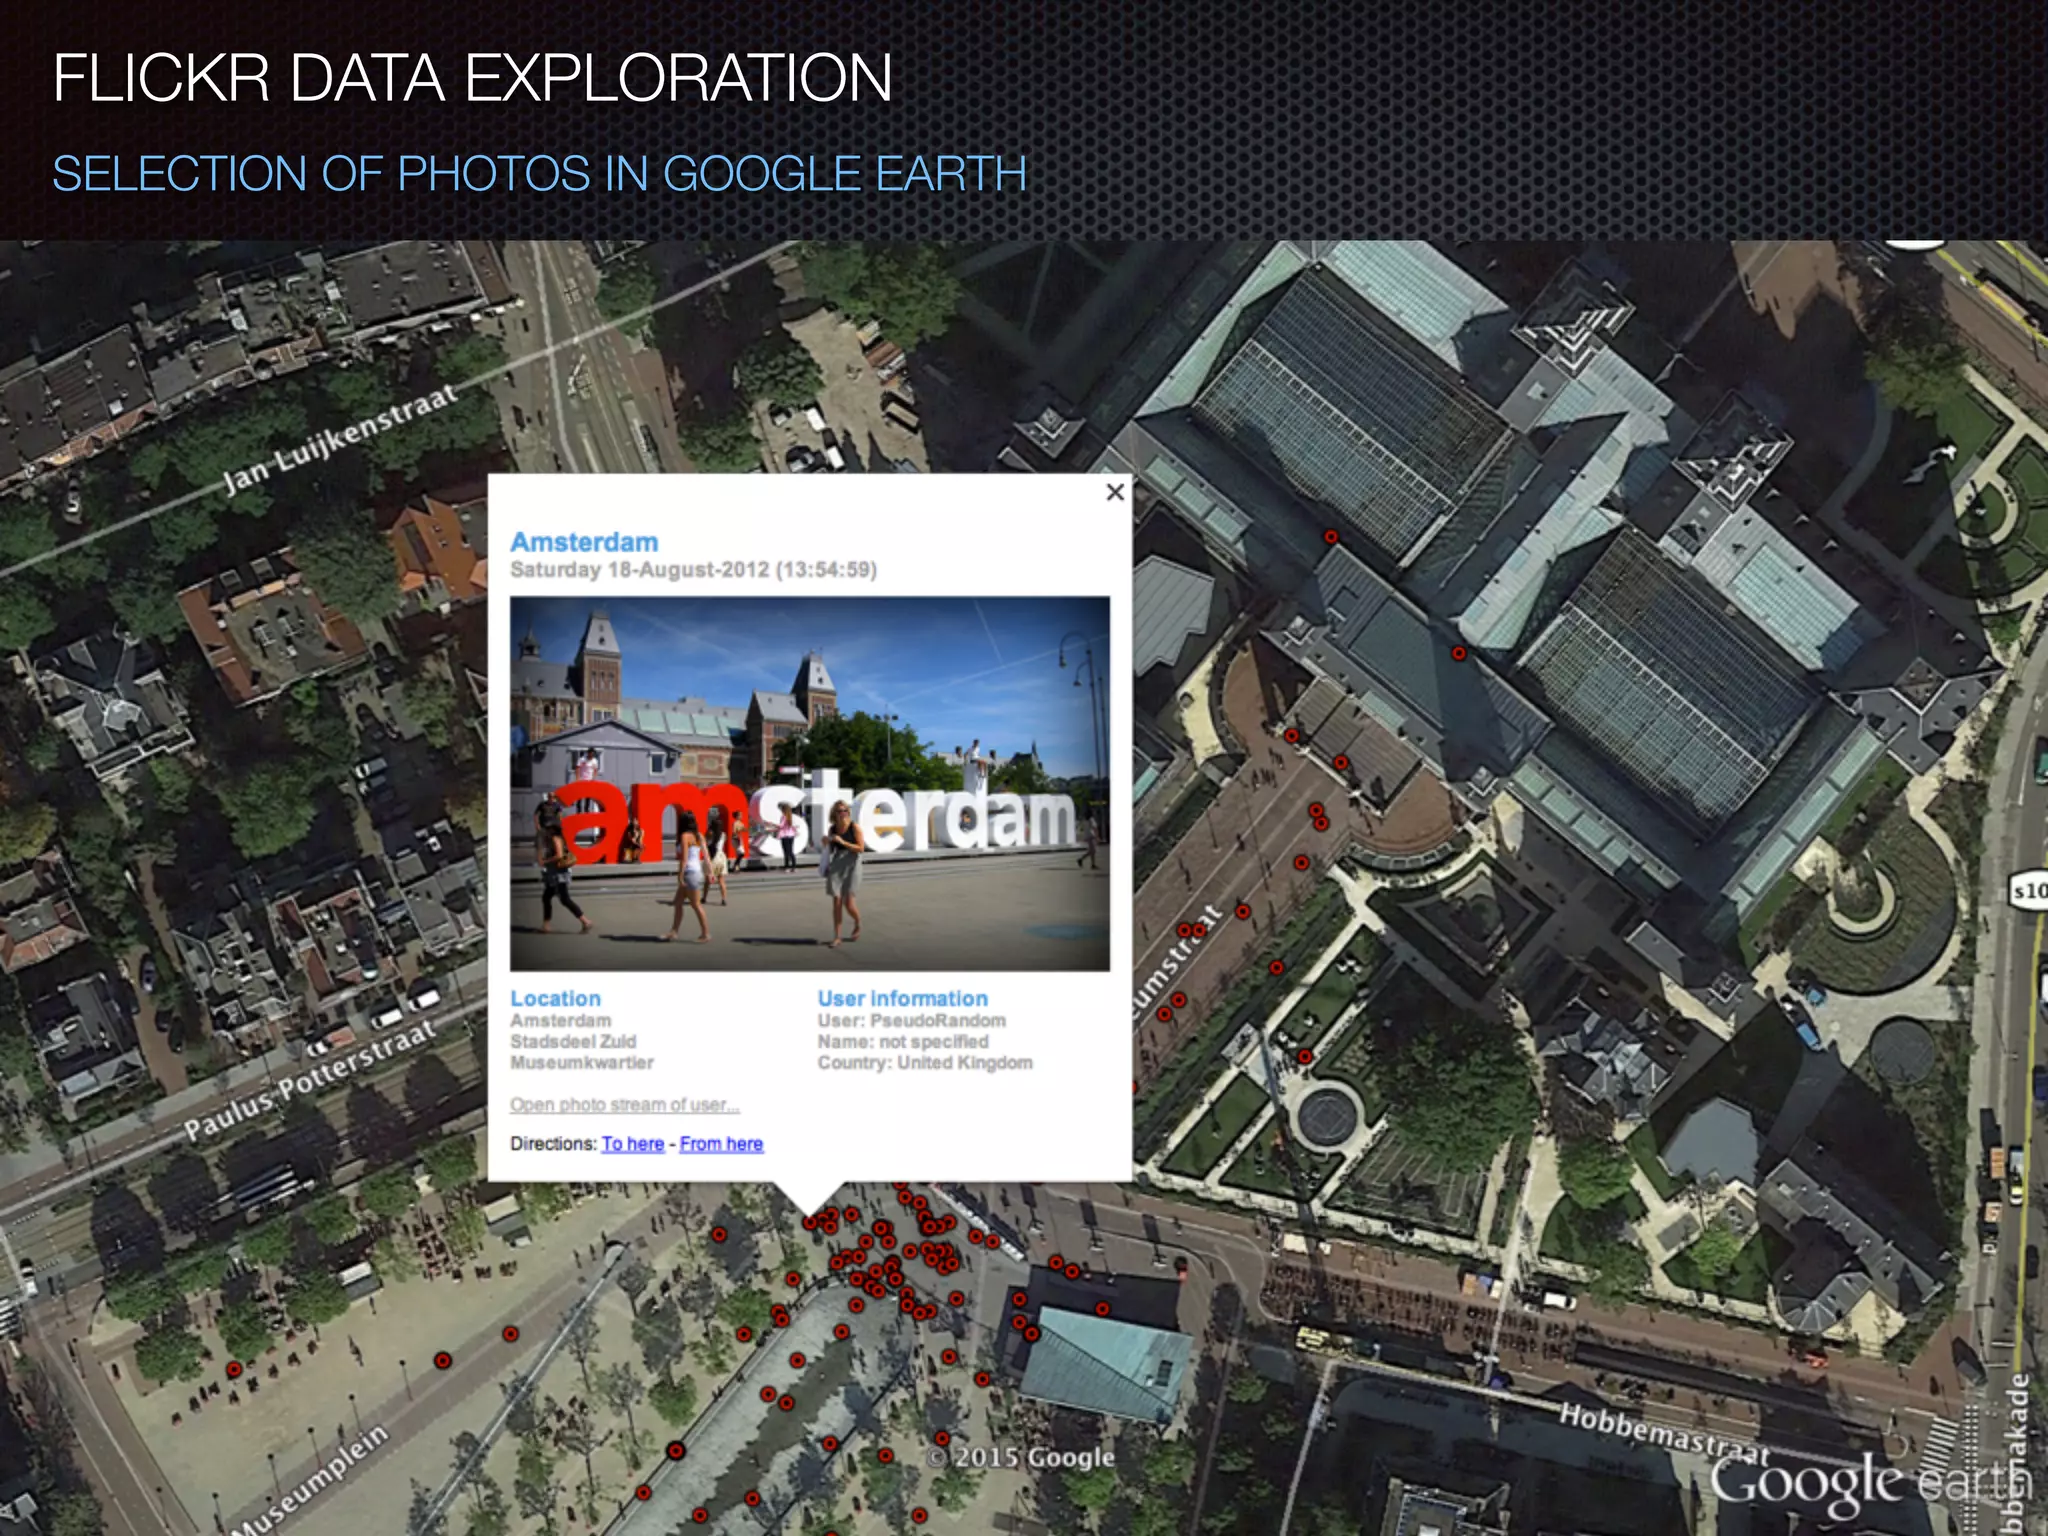
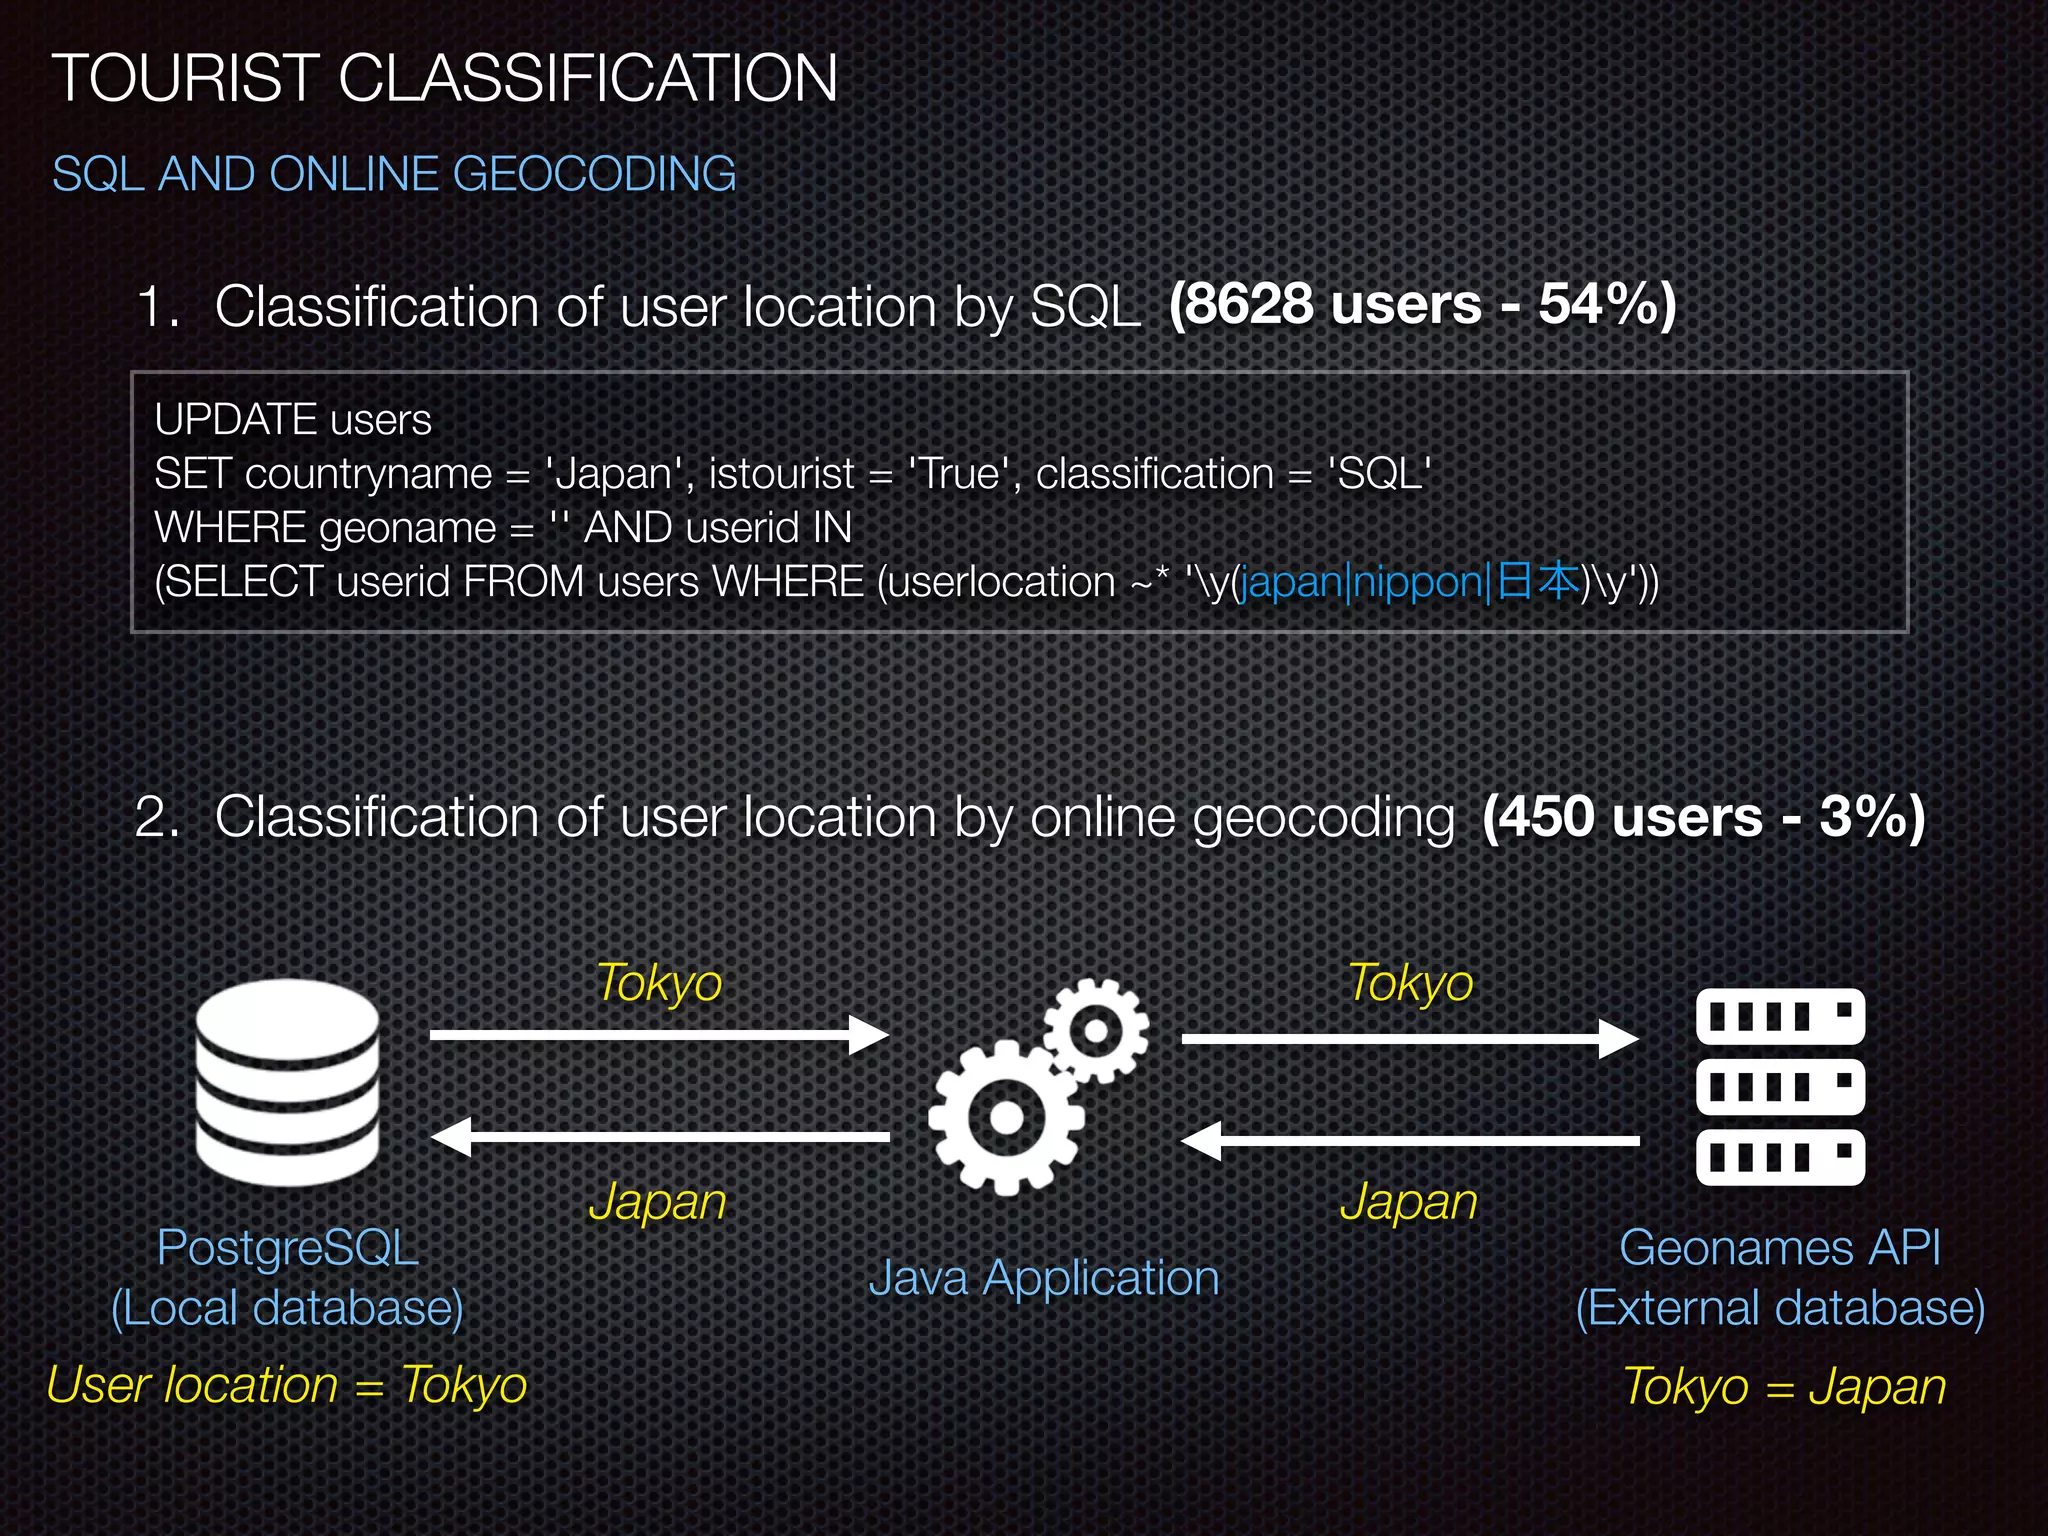
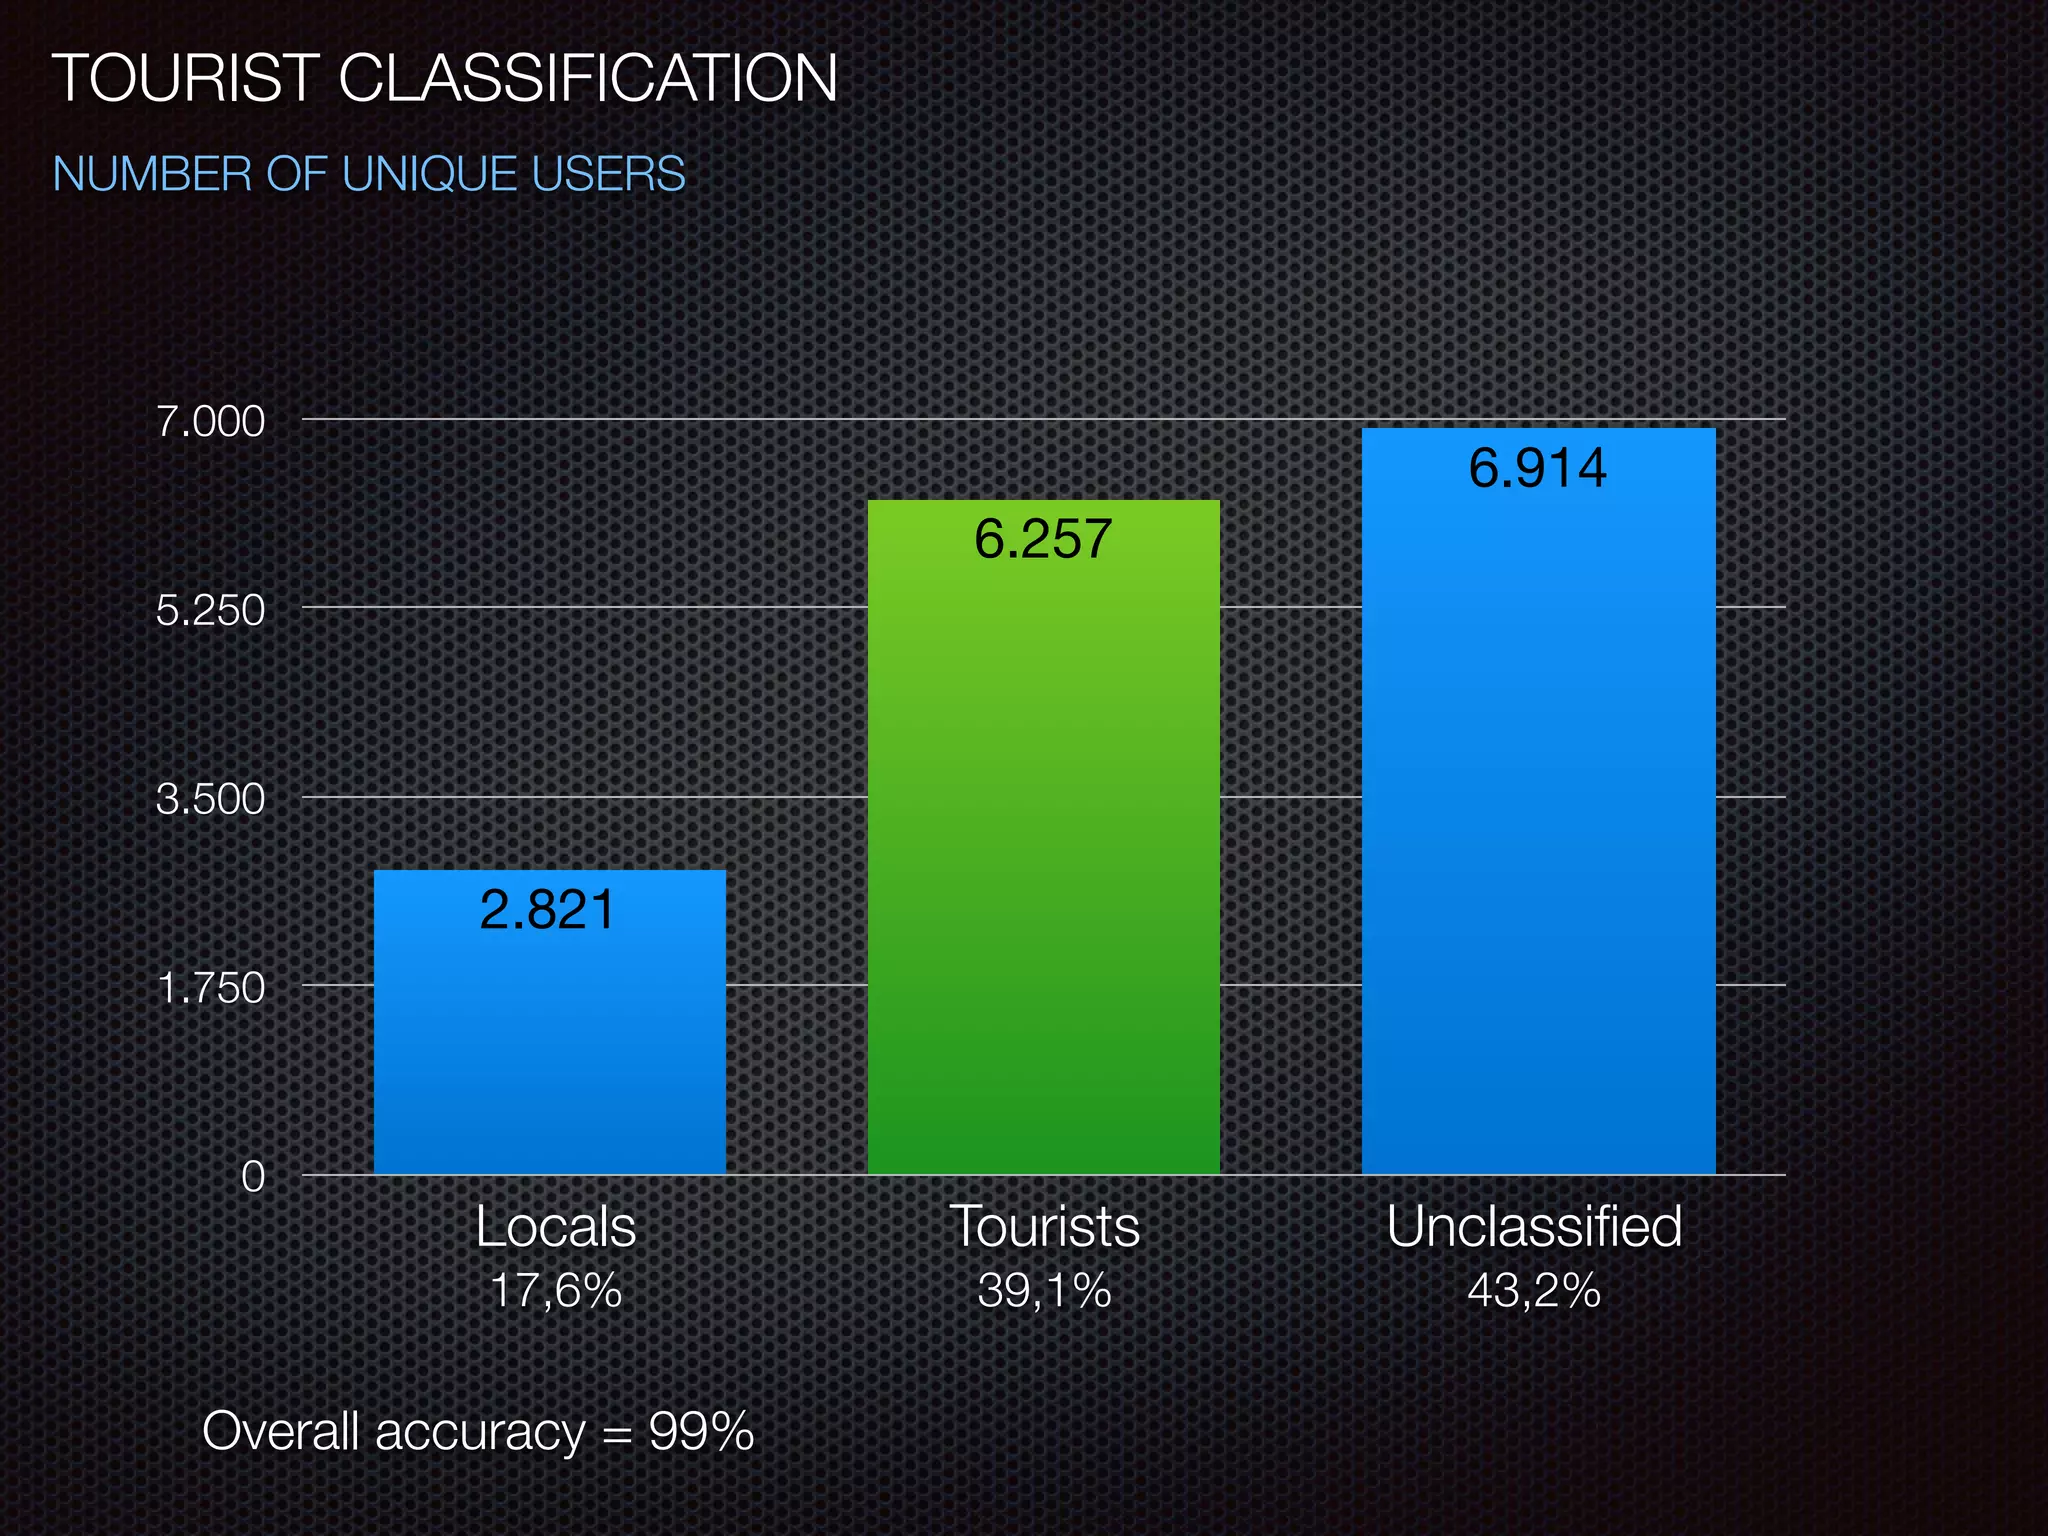
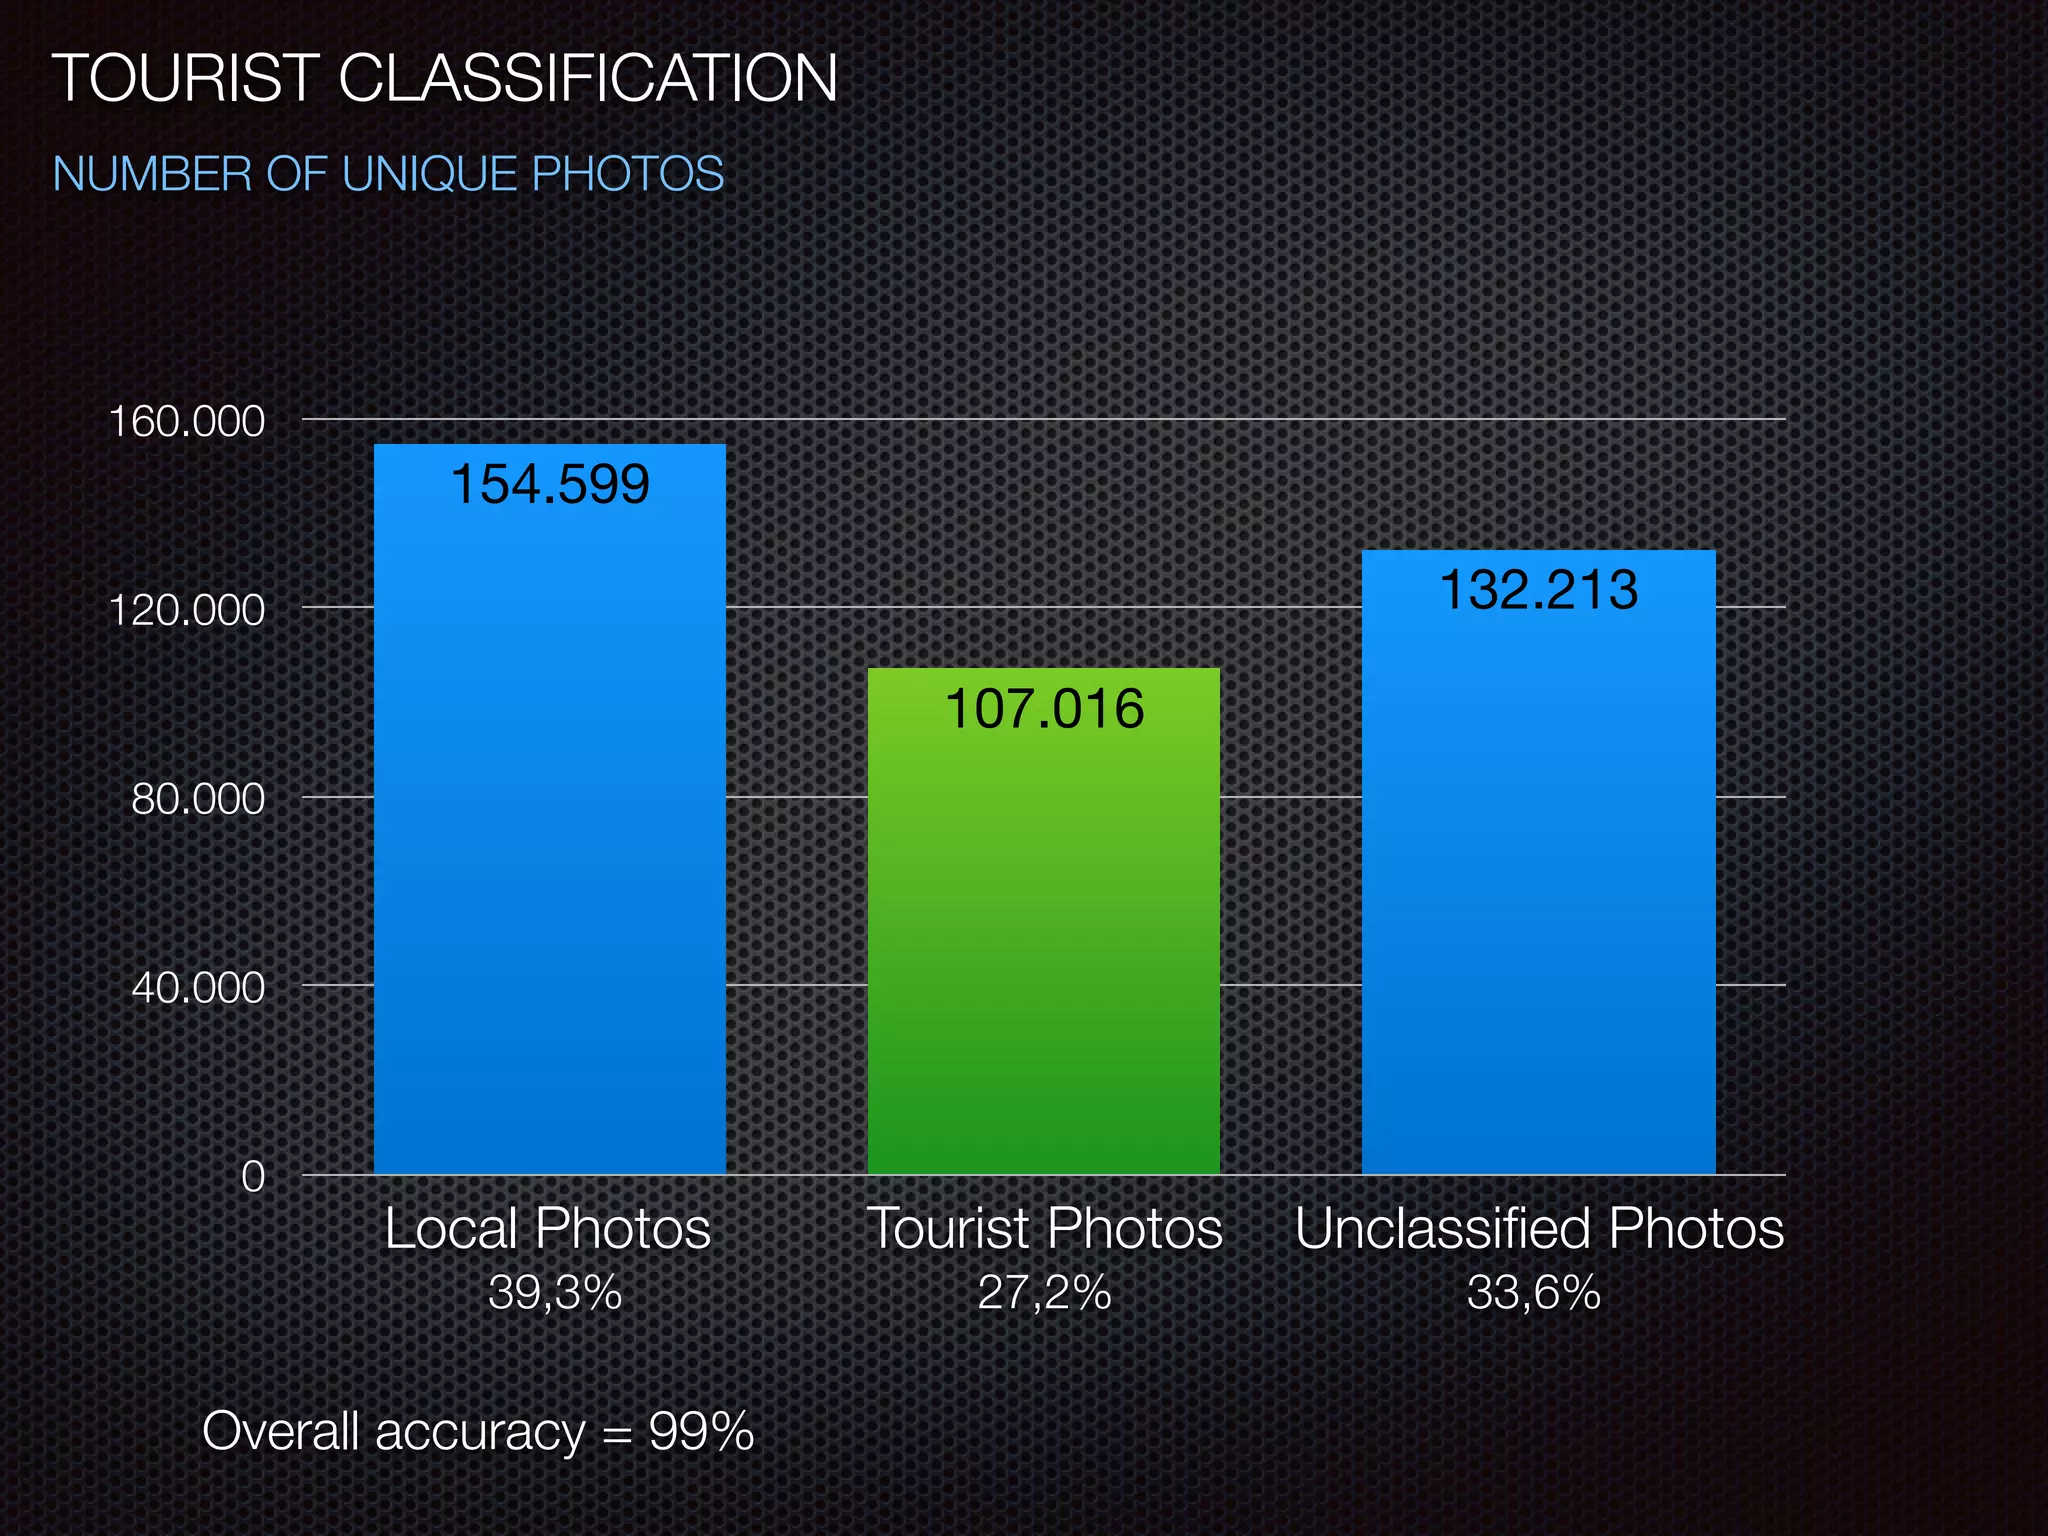
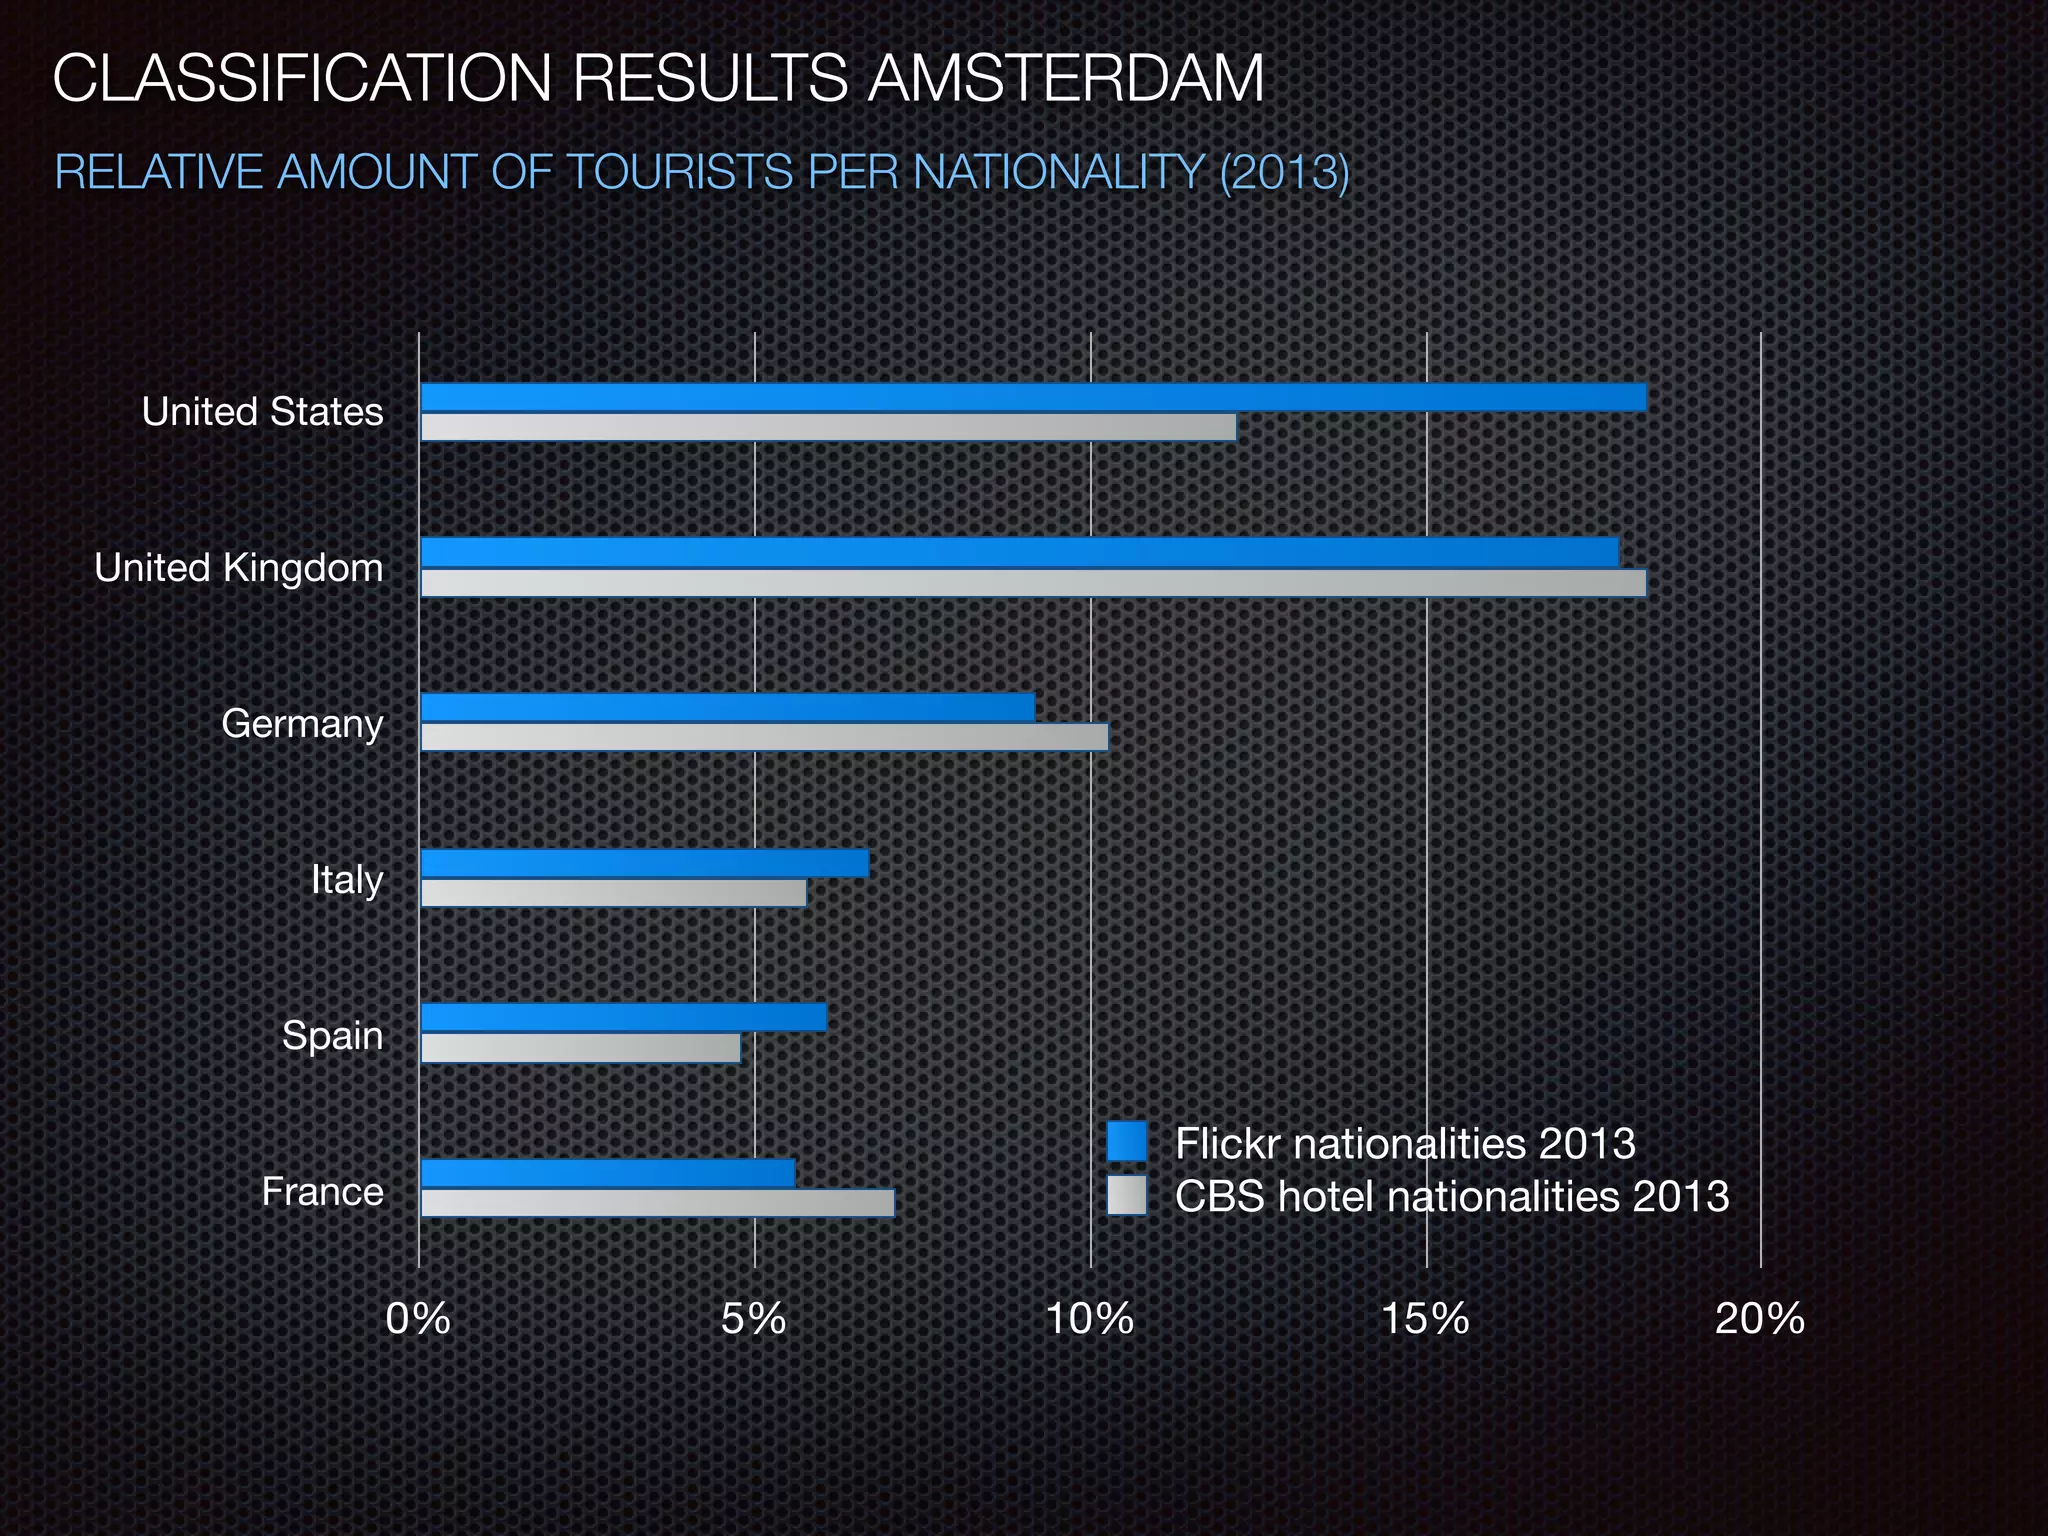
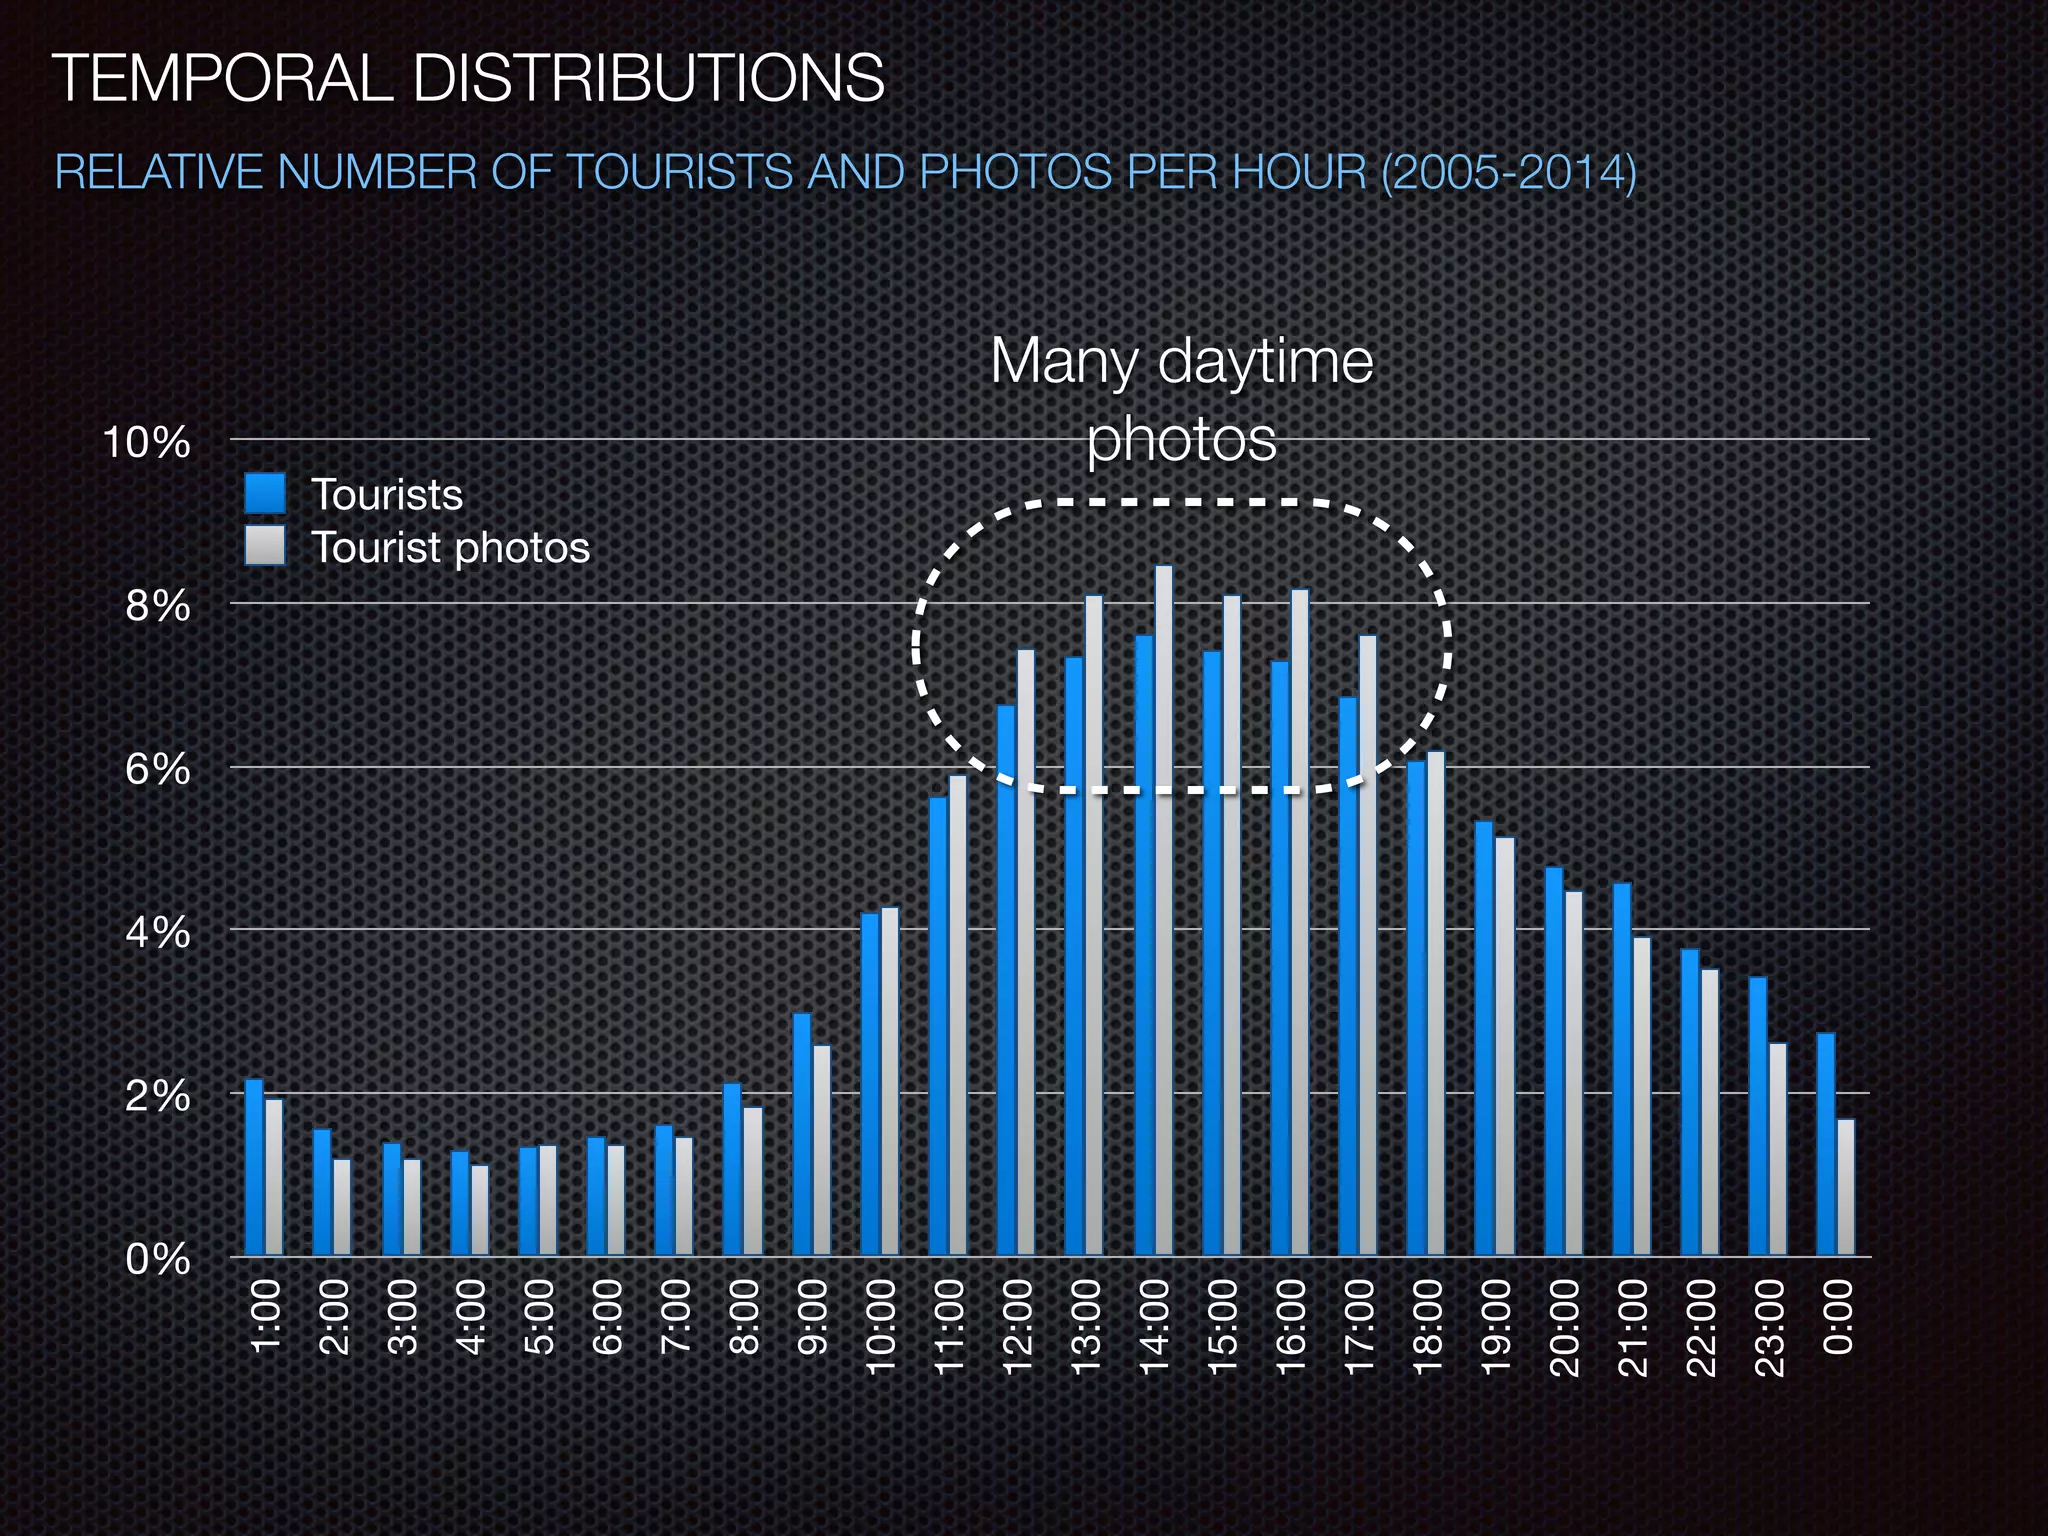
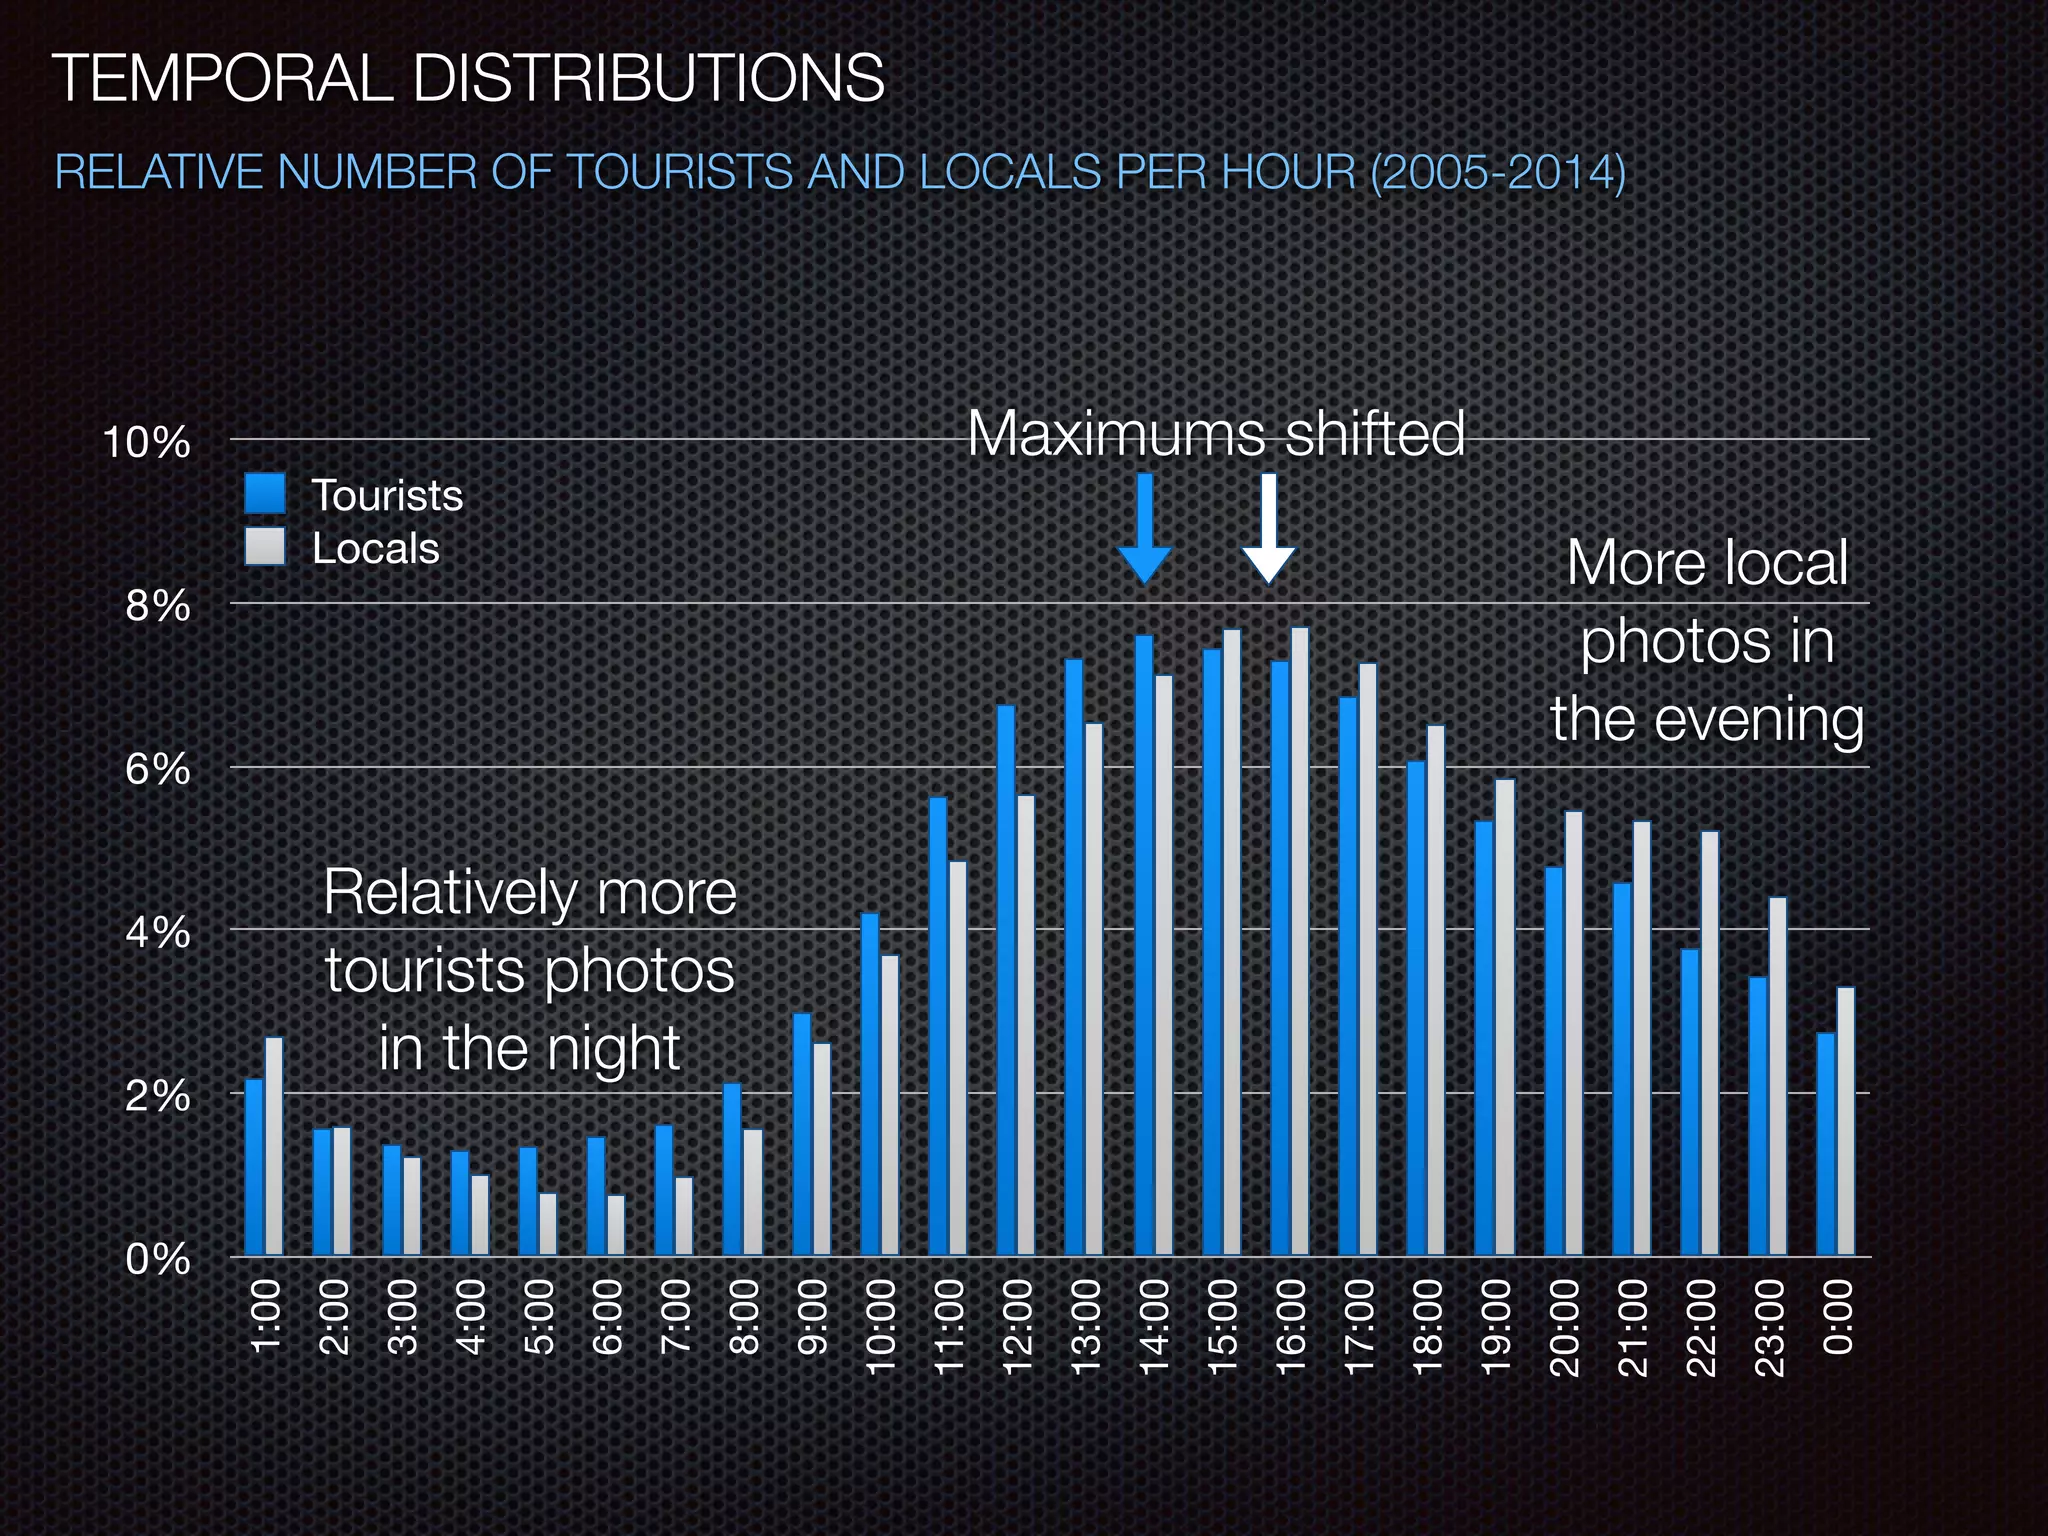
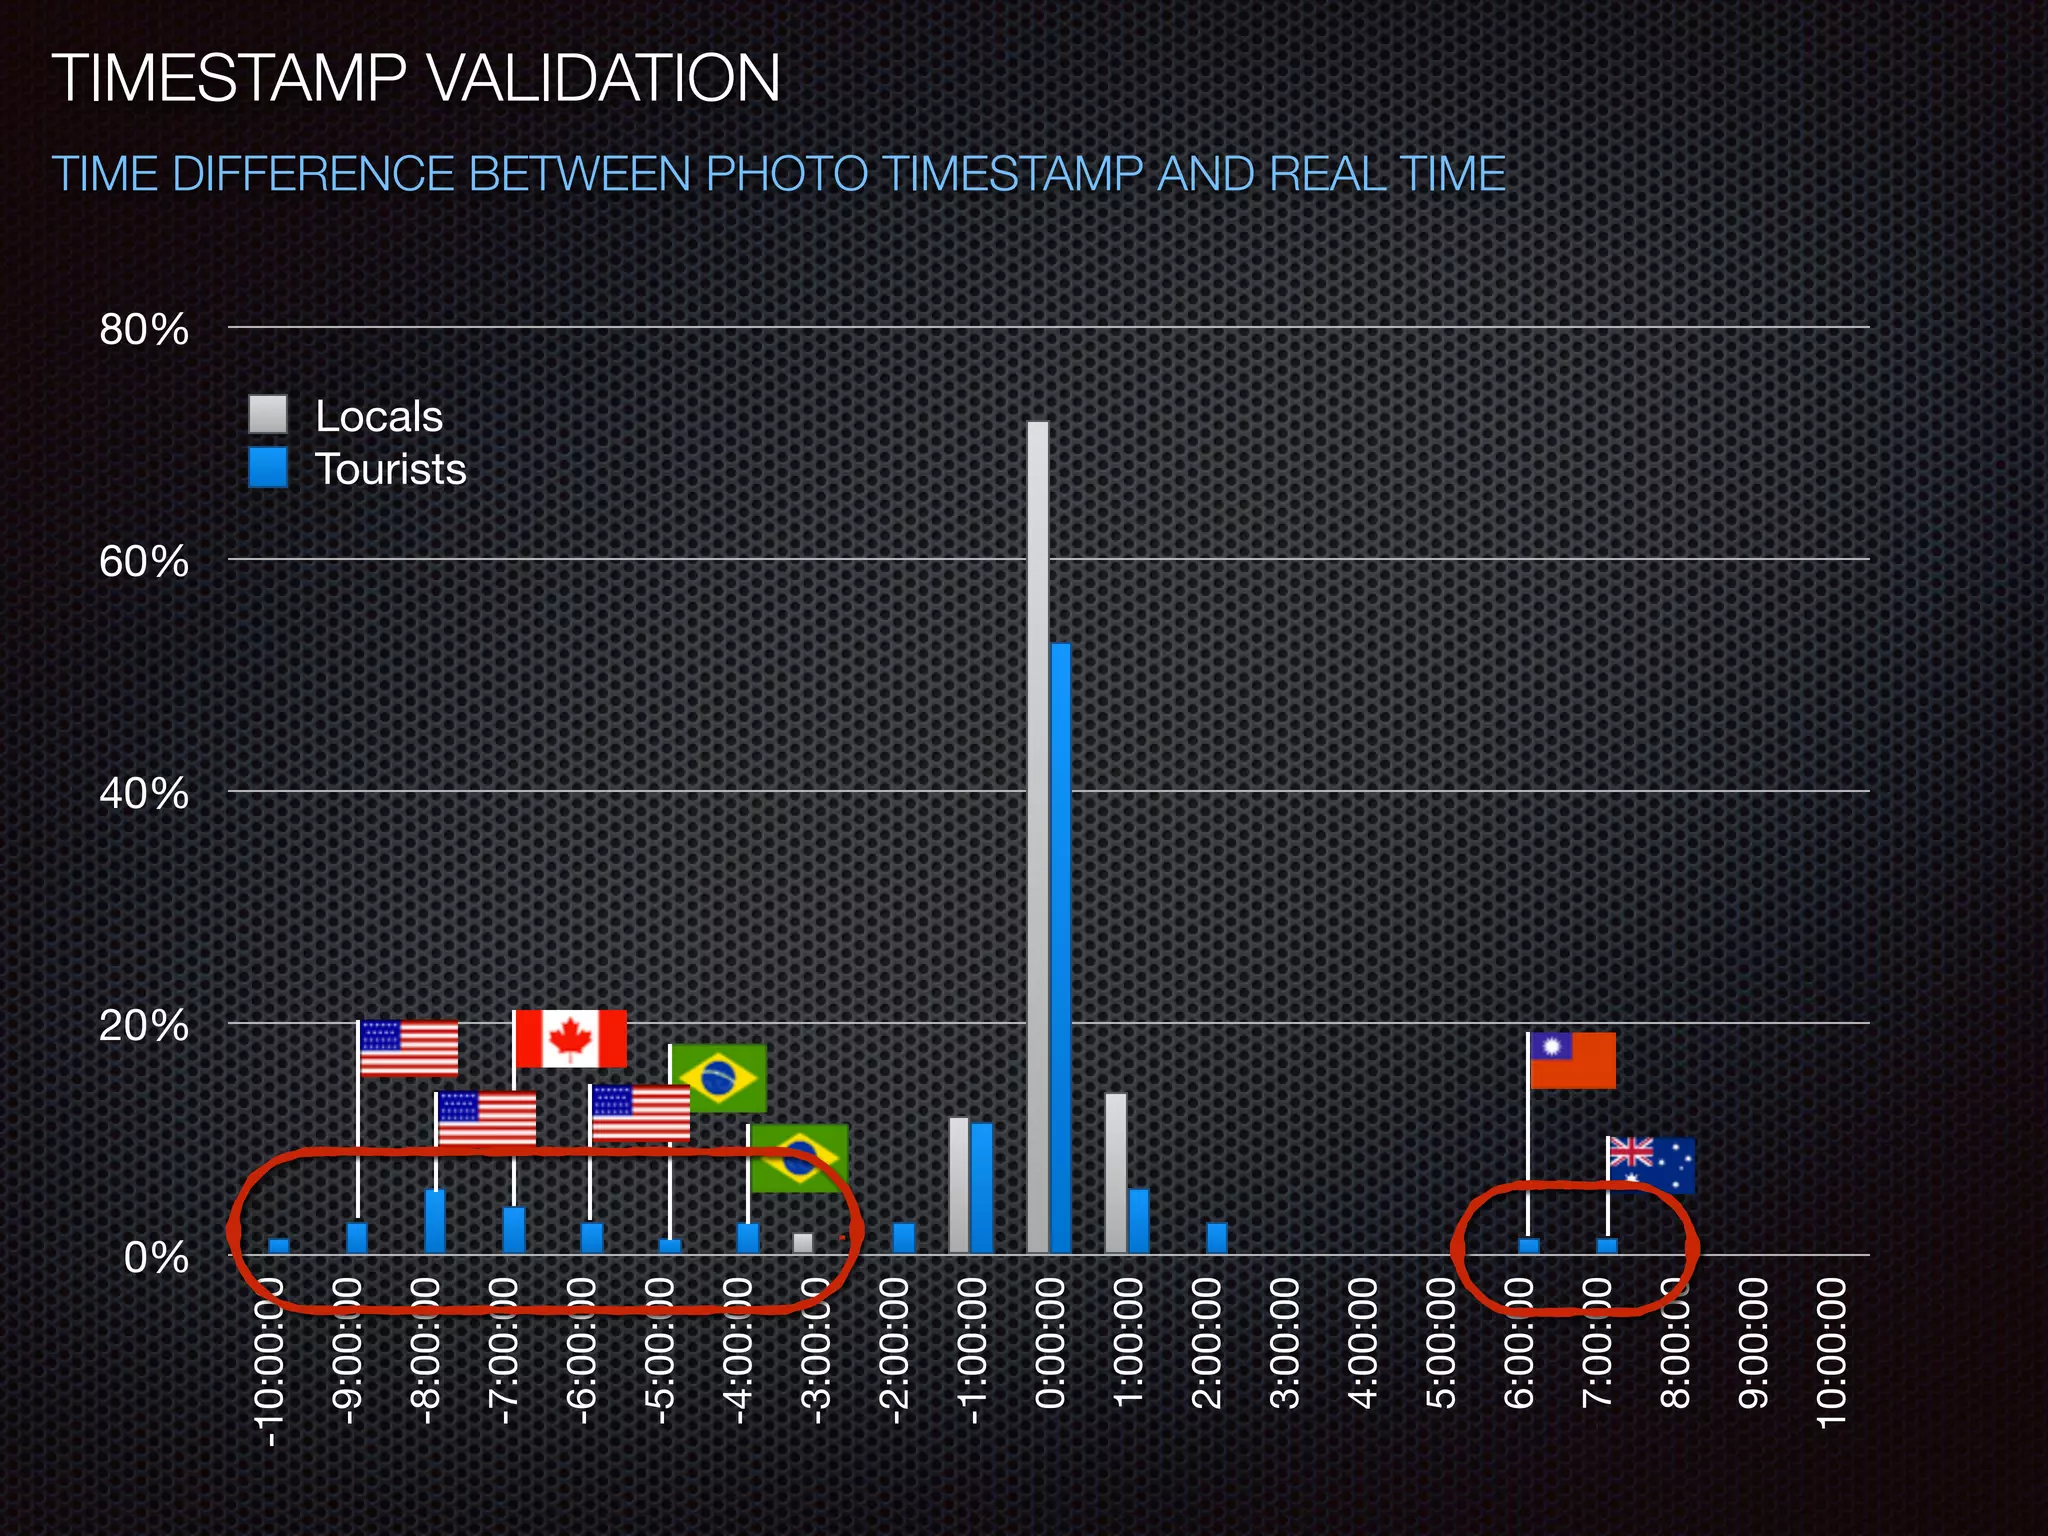
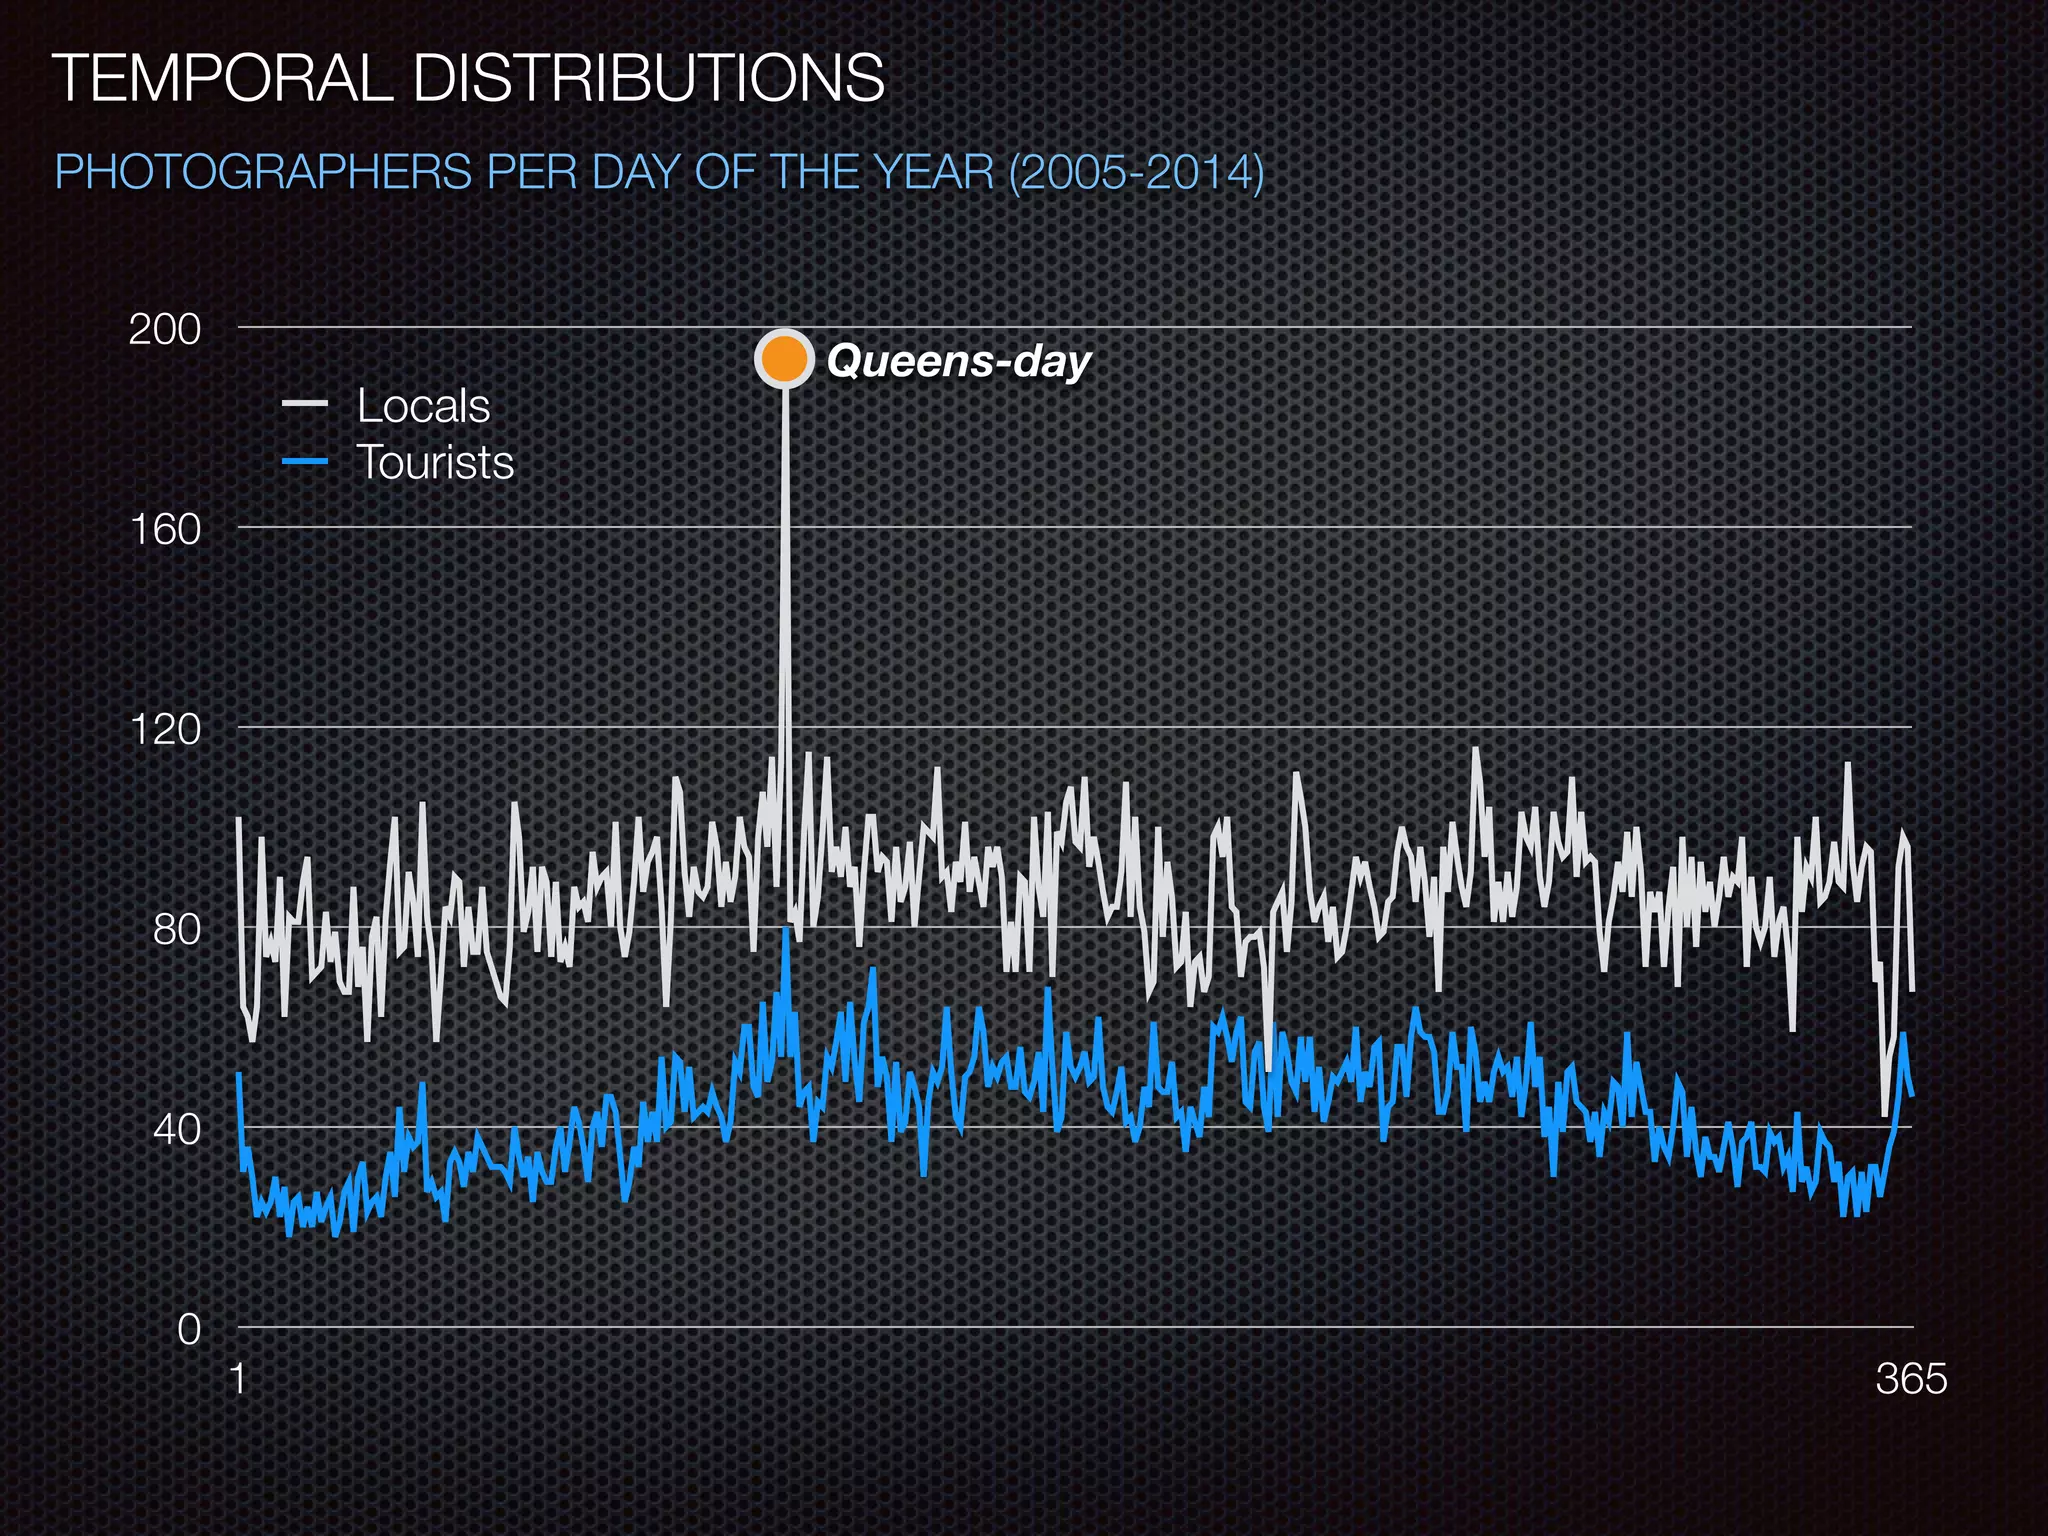
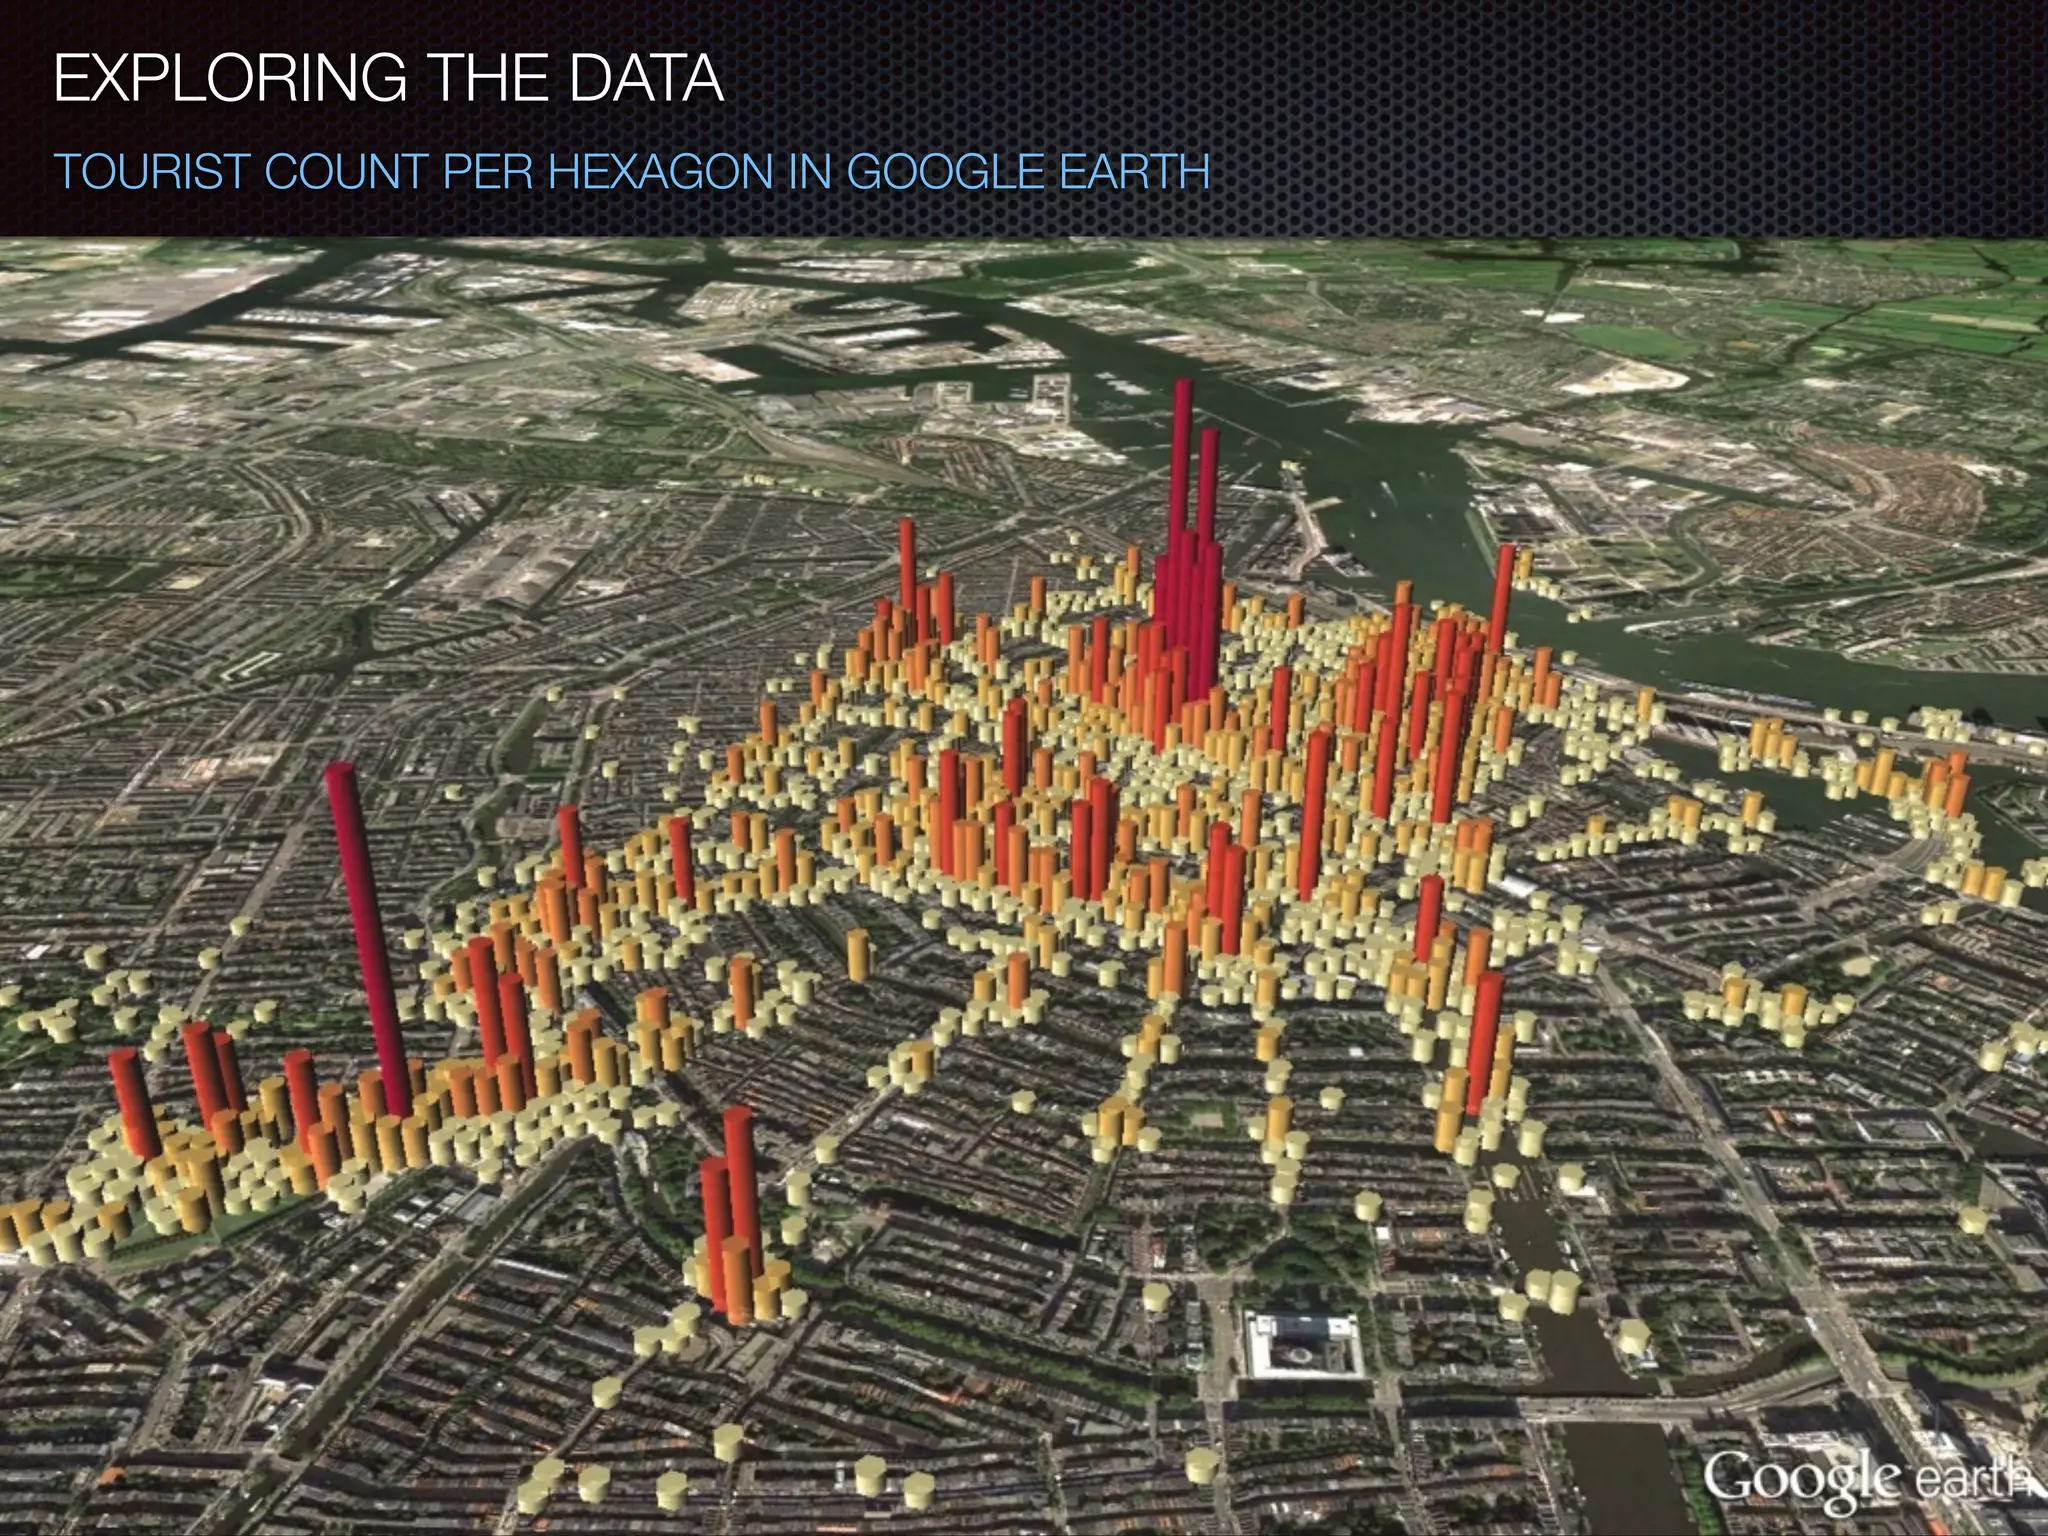
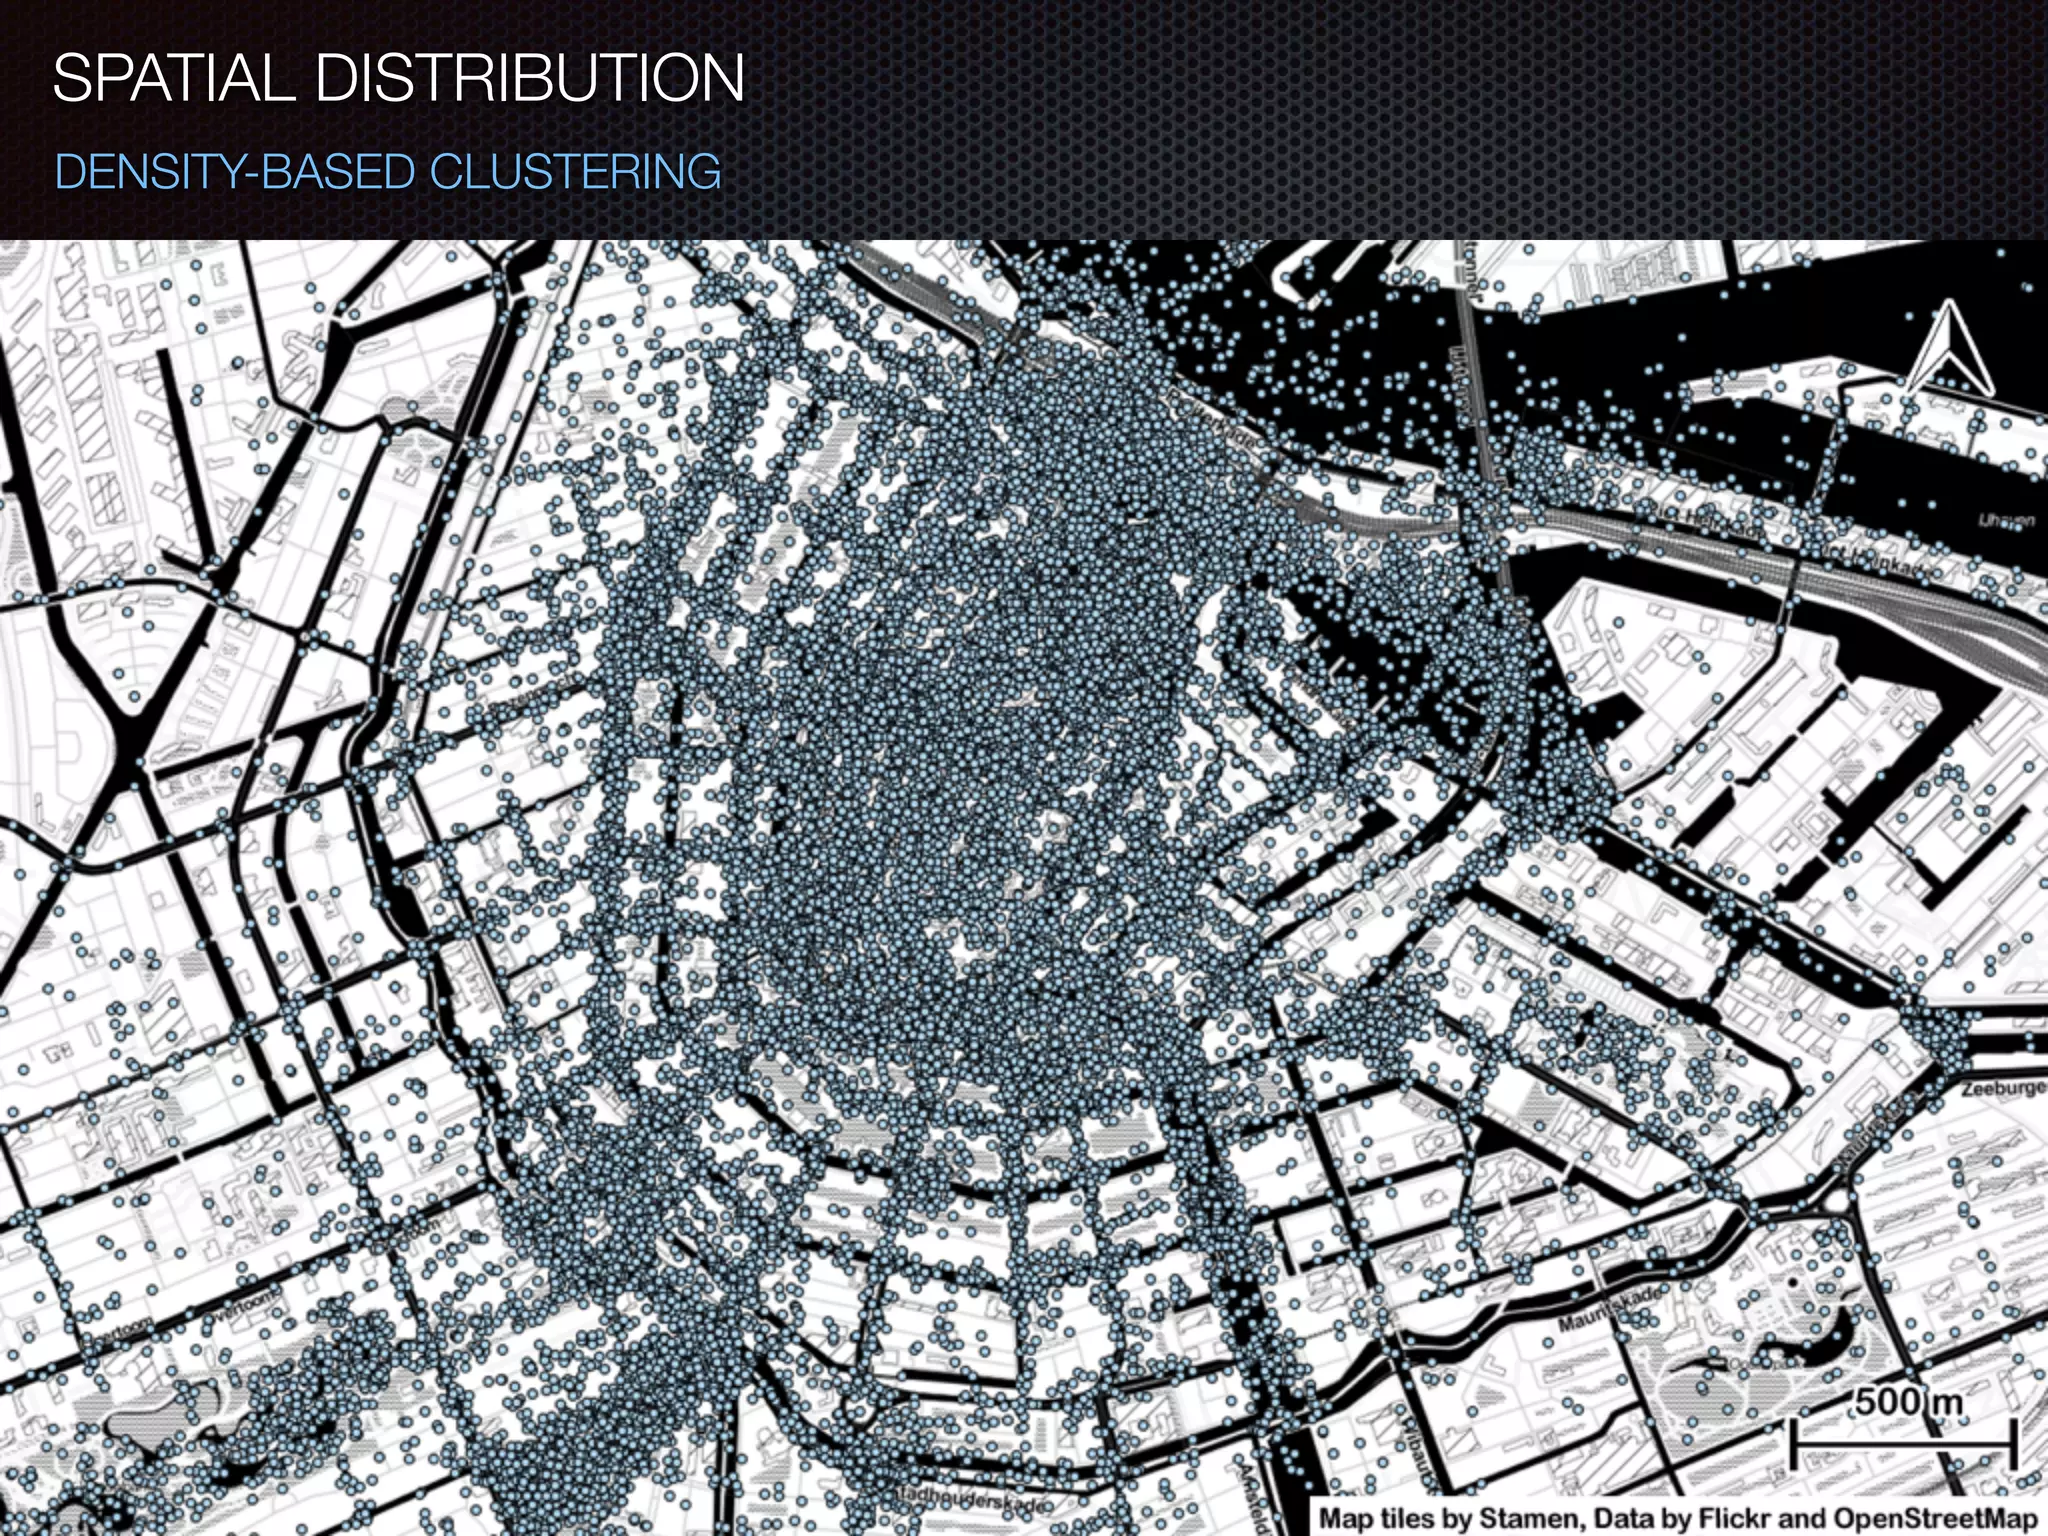
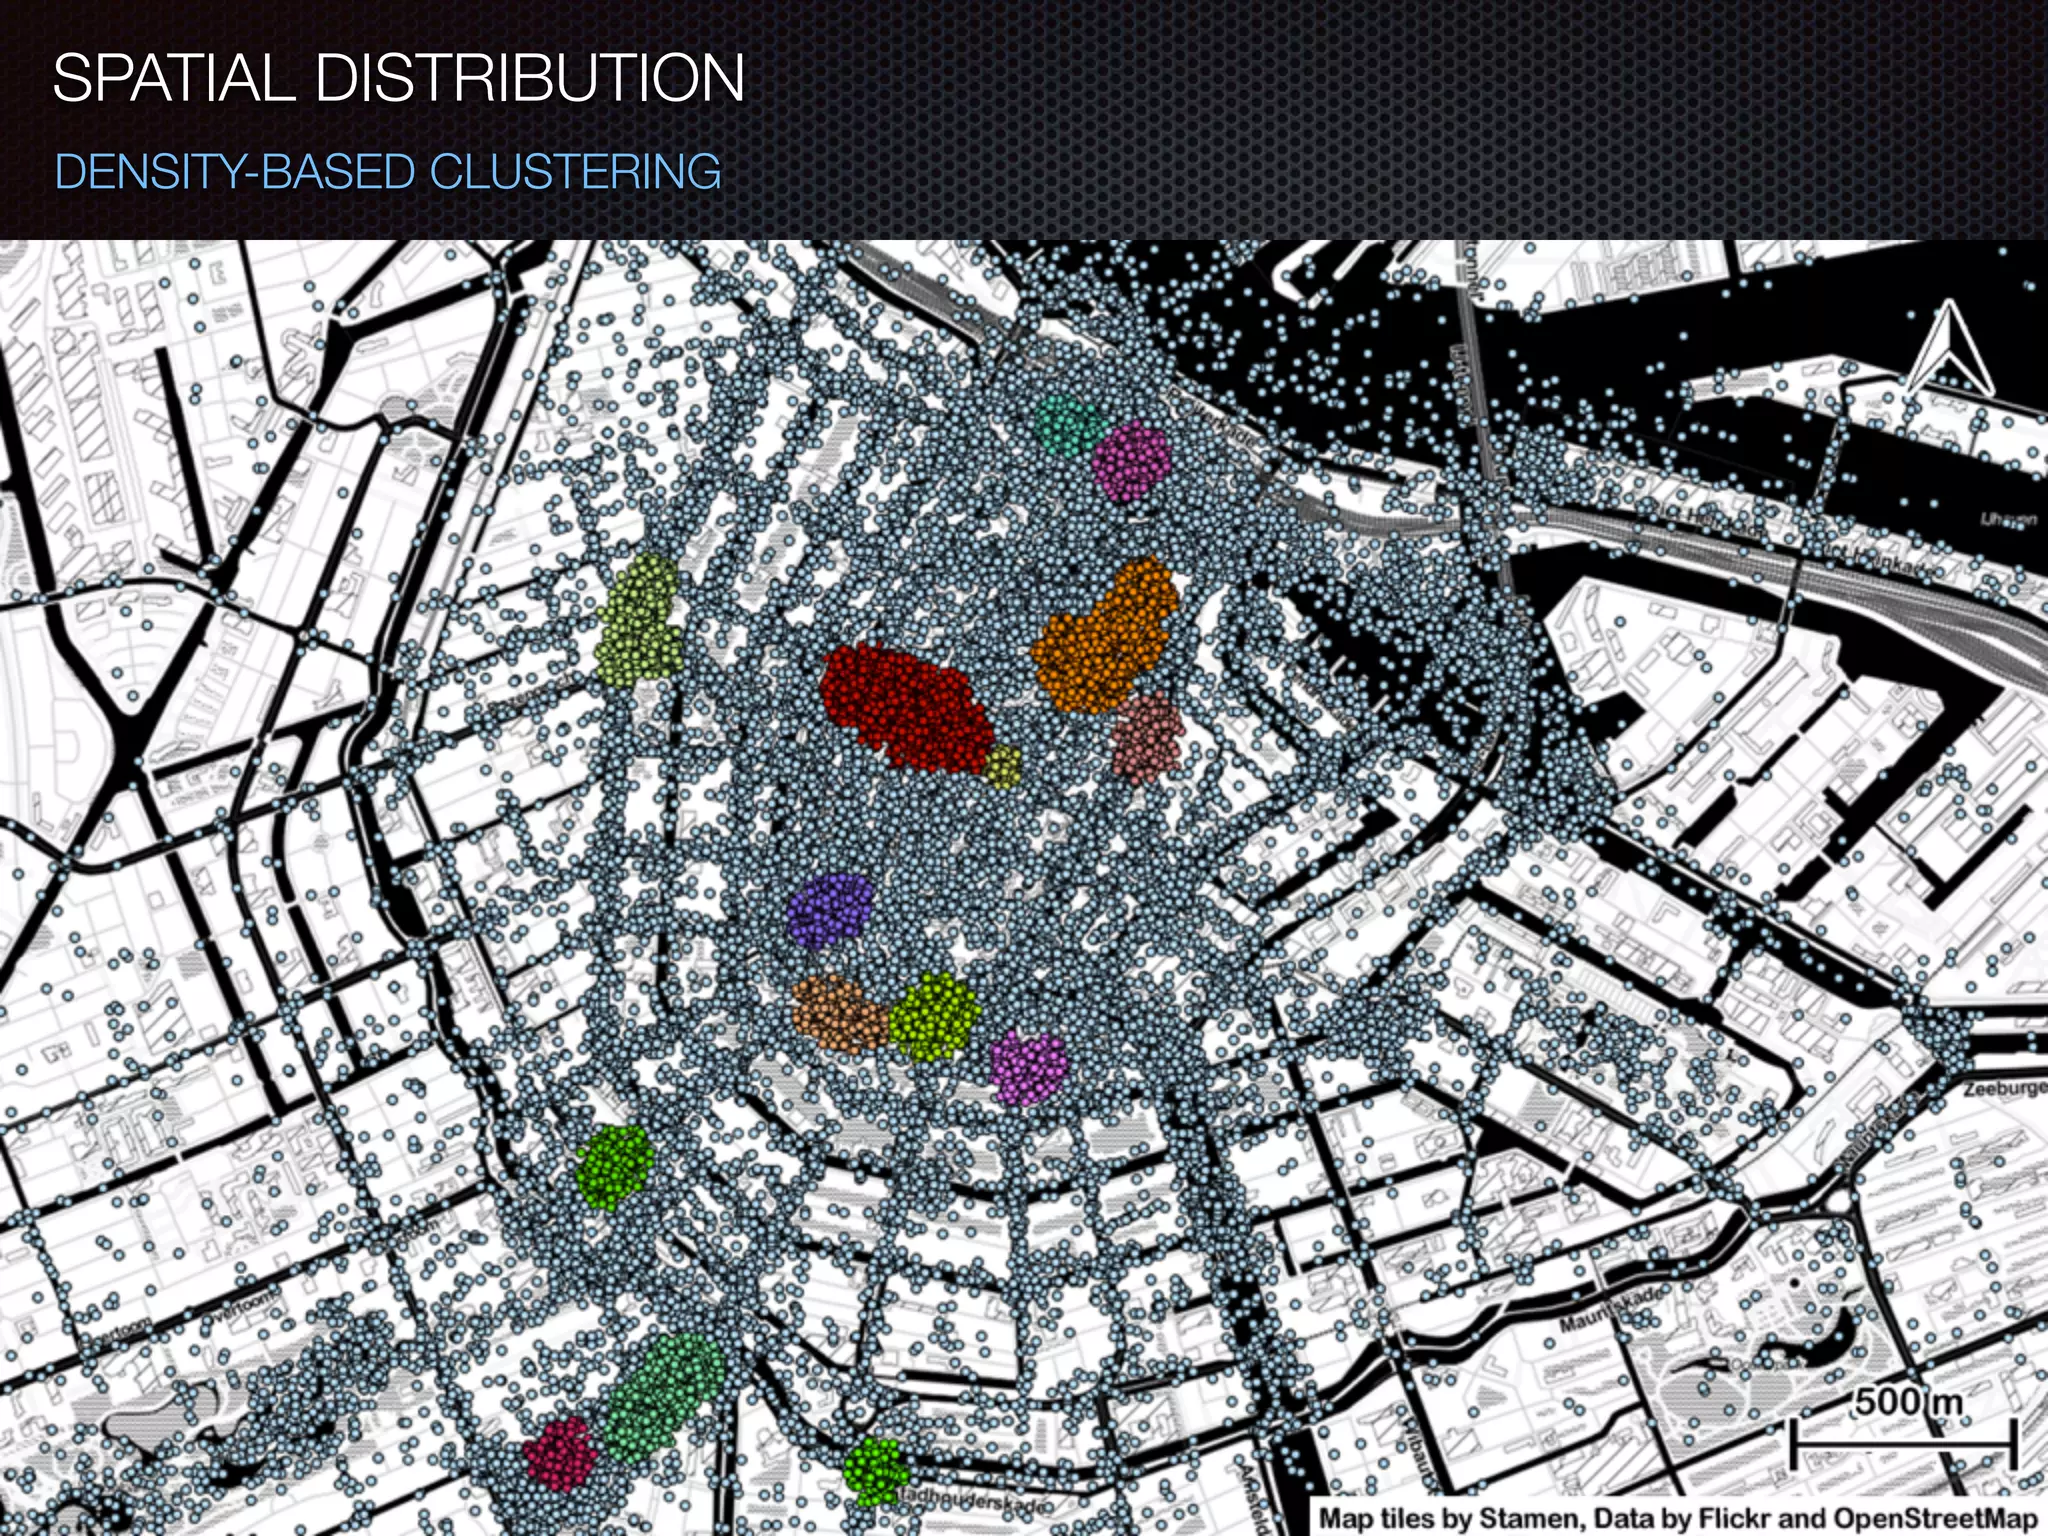
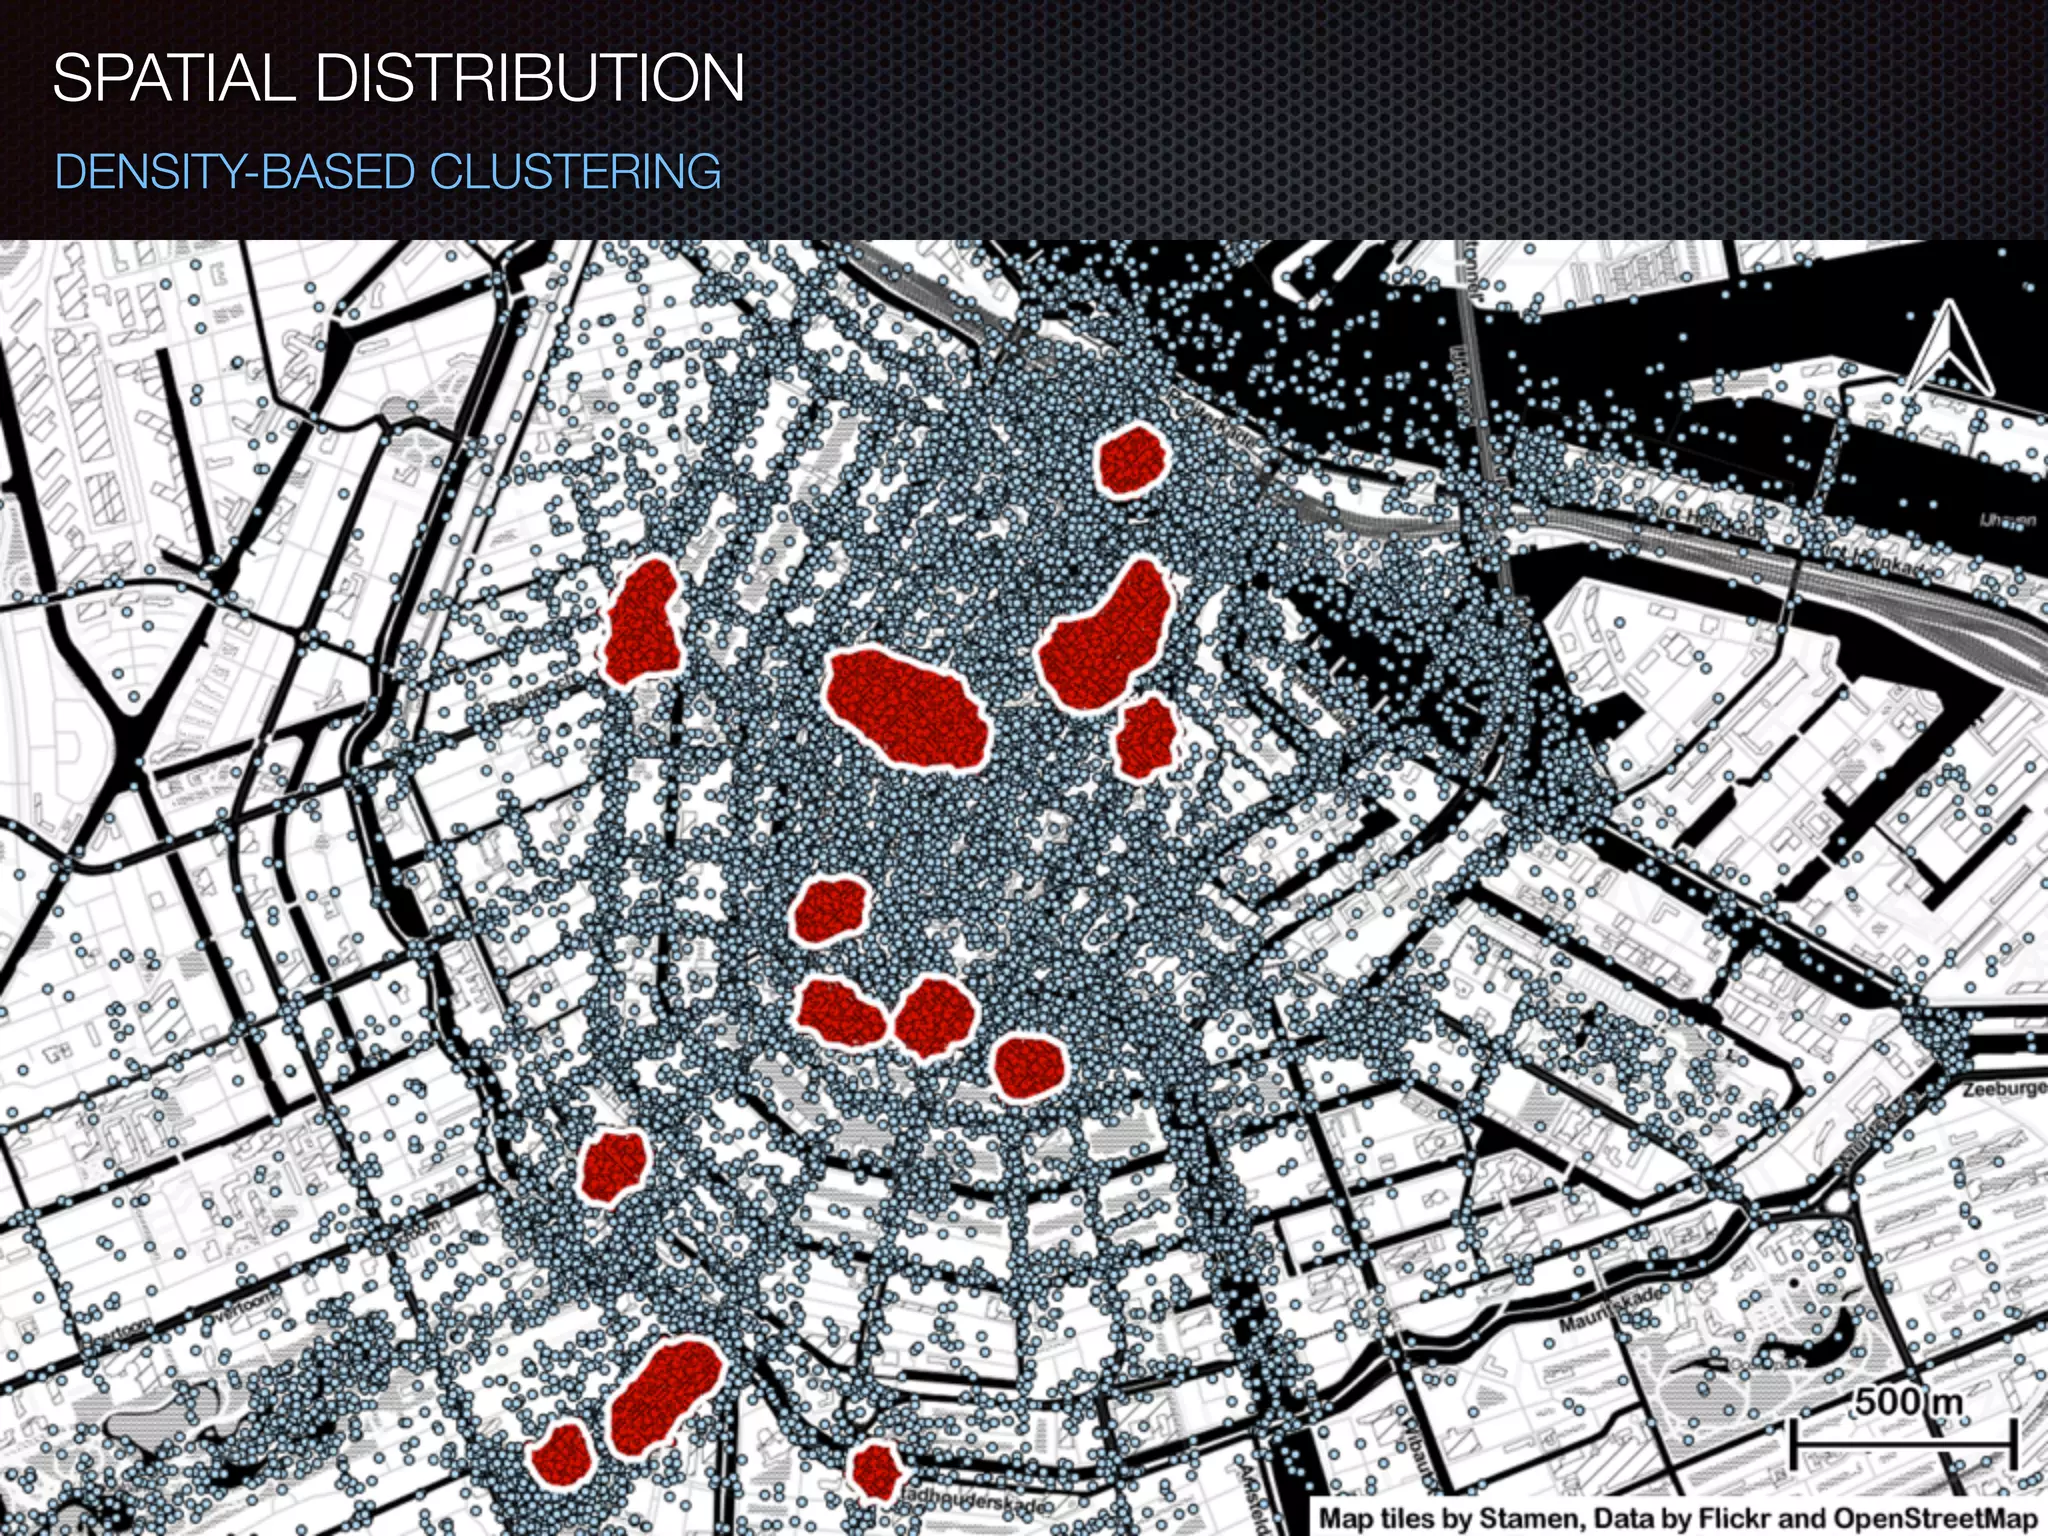
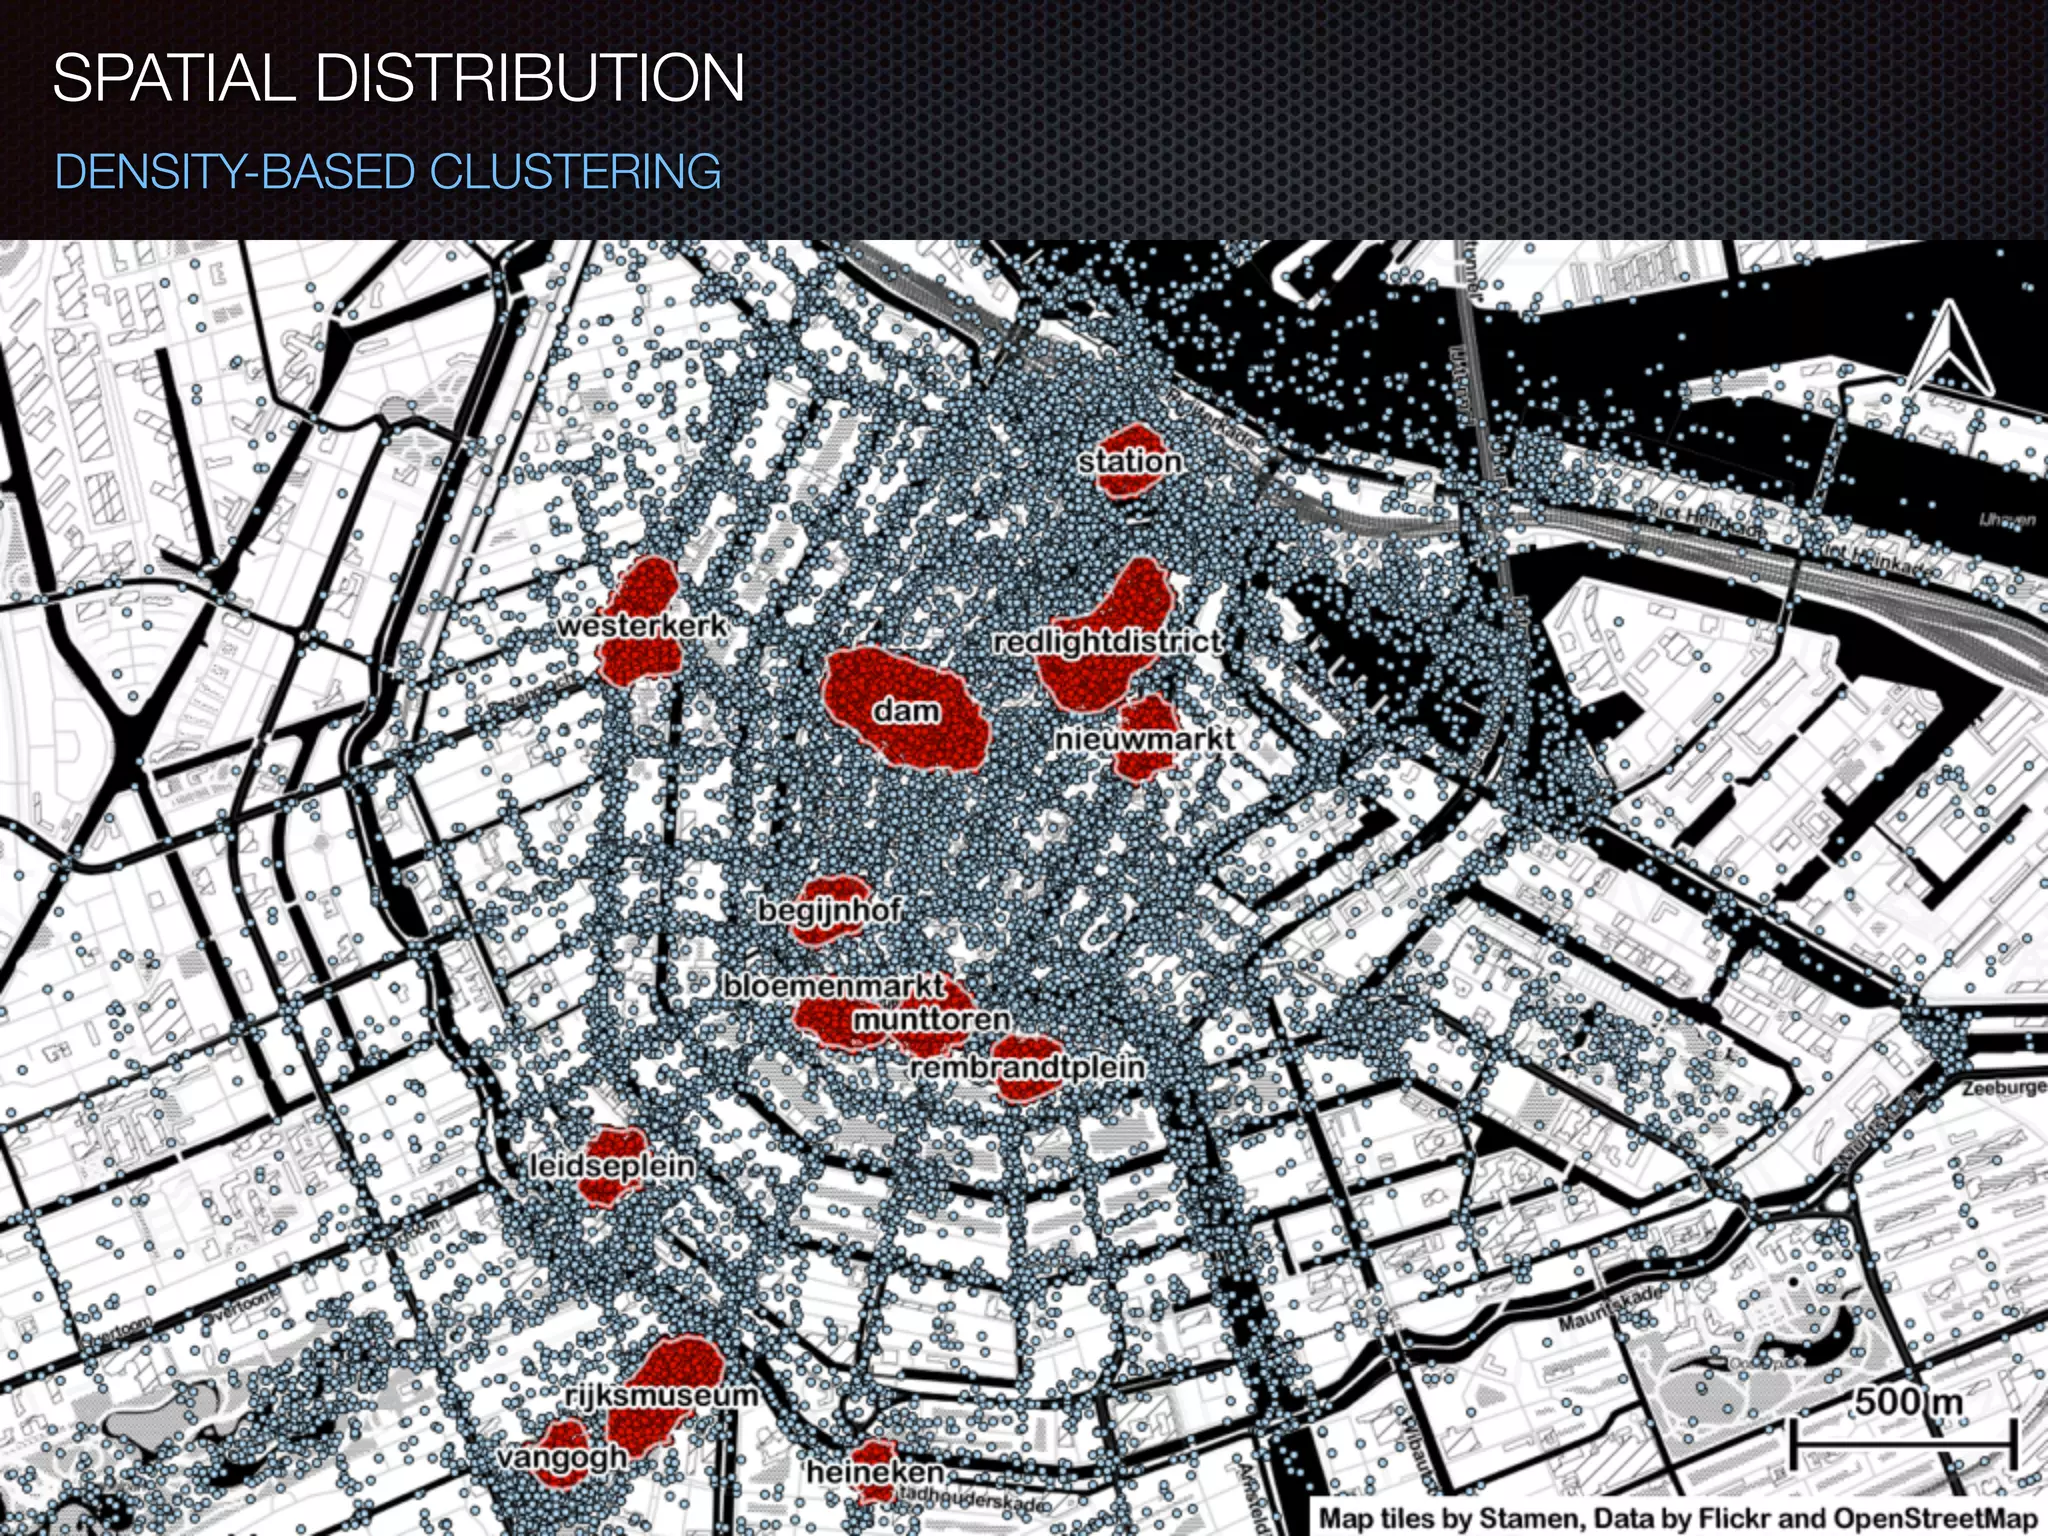
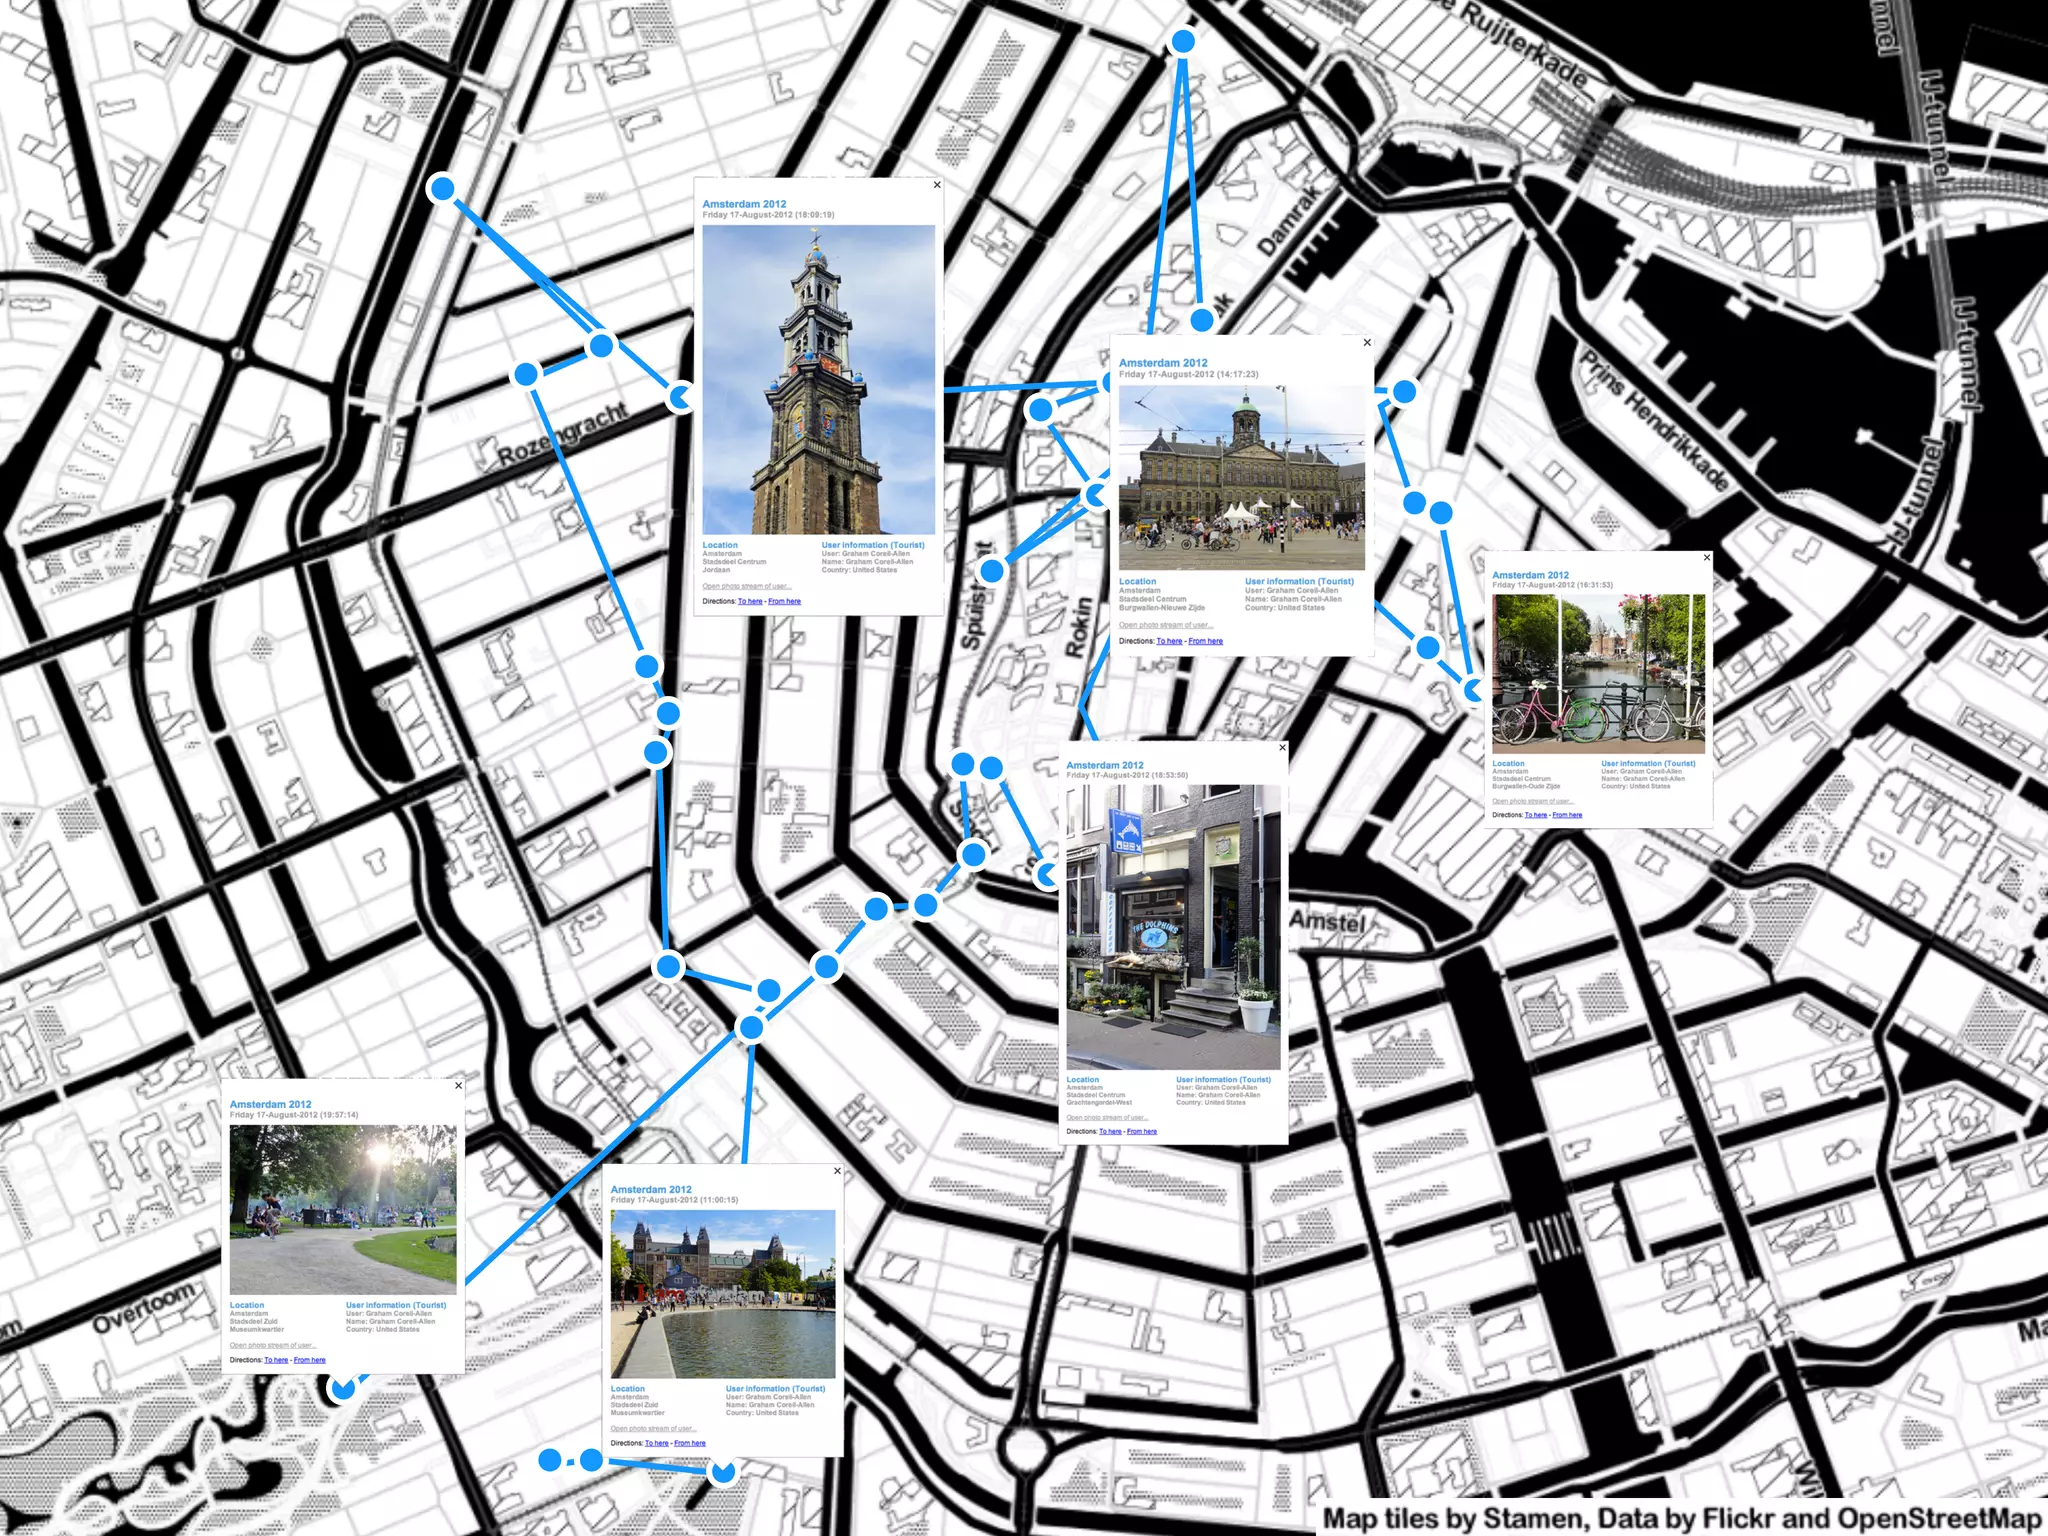
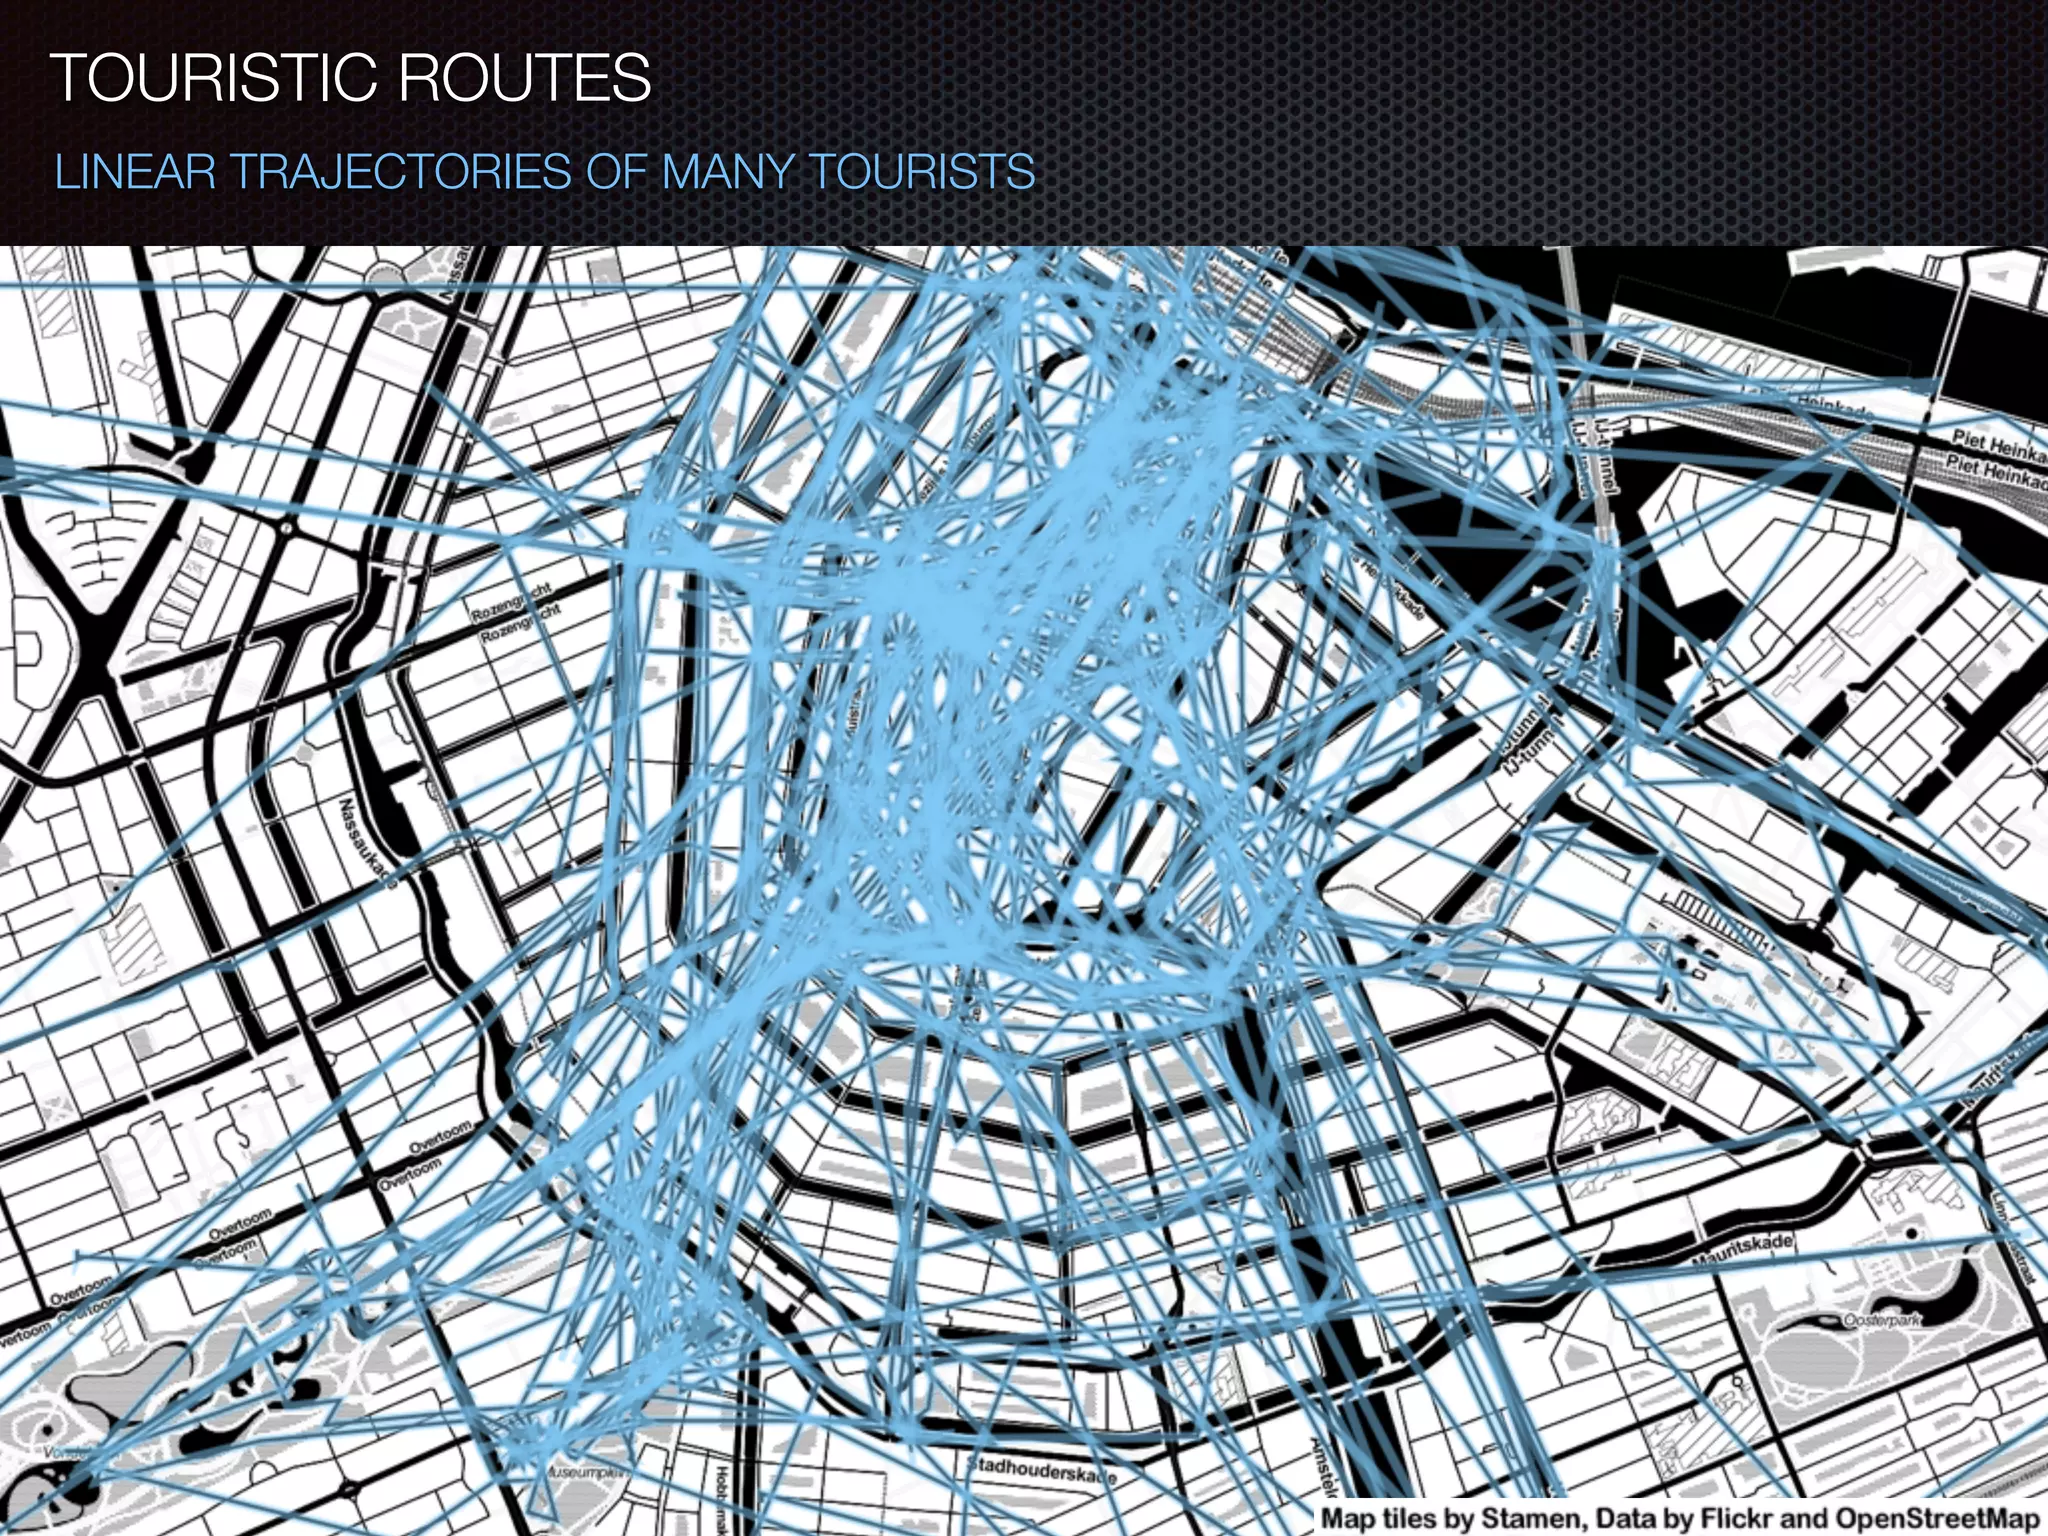
This document discusses a research project aimed at analyzing spatial and temporal patterns of tourists in Amsterdam using geotagged Flickr photos. It outlines methodologies for data collection and analysis, focusing on detecting tourist distributions, clustering, and popular routes based on metadata from the photos. The results aim to provide insights for managing tourism in the rapidly growing city, alongside suggestions for future research opportunities.


![SL presentation2008[1]](https://cdn.slidesharecdn.com/ss_thumbnails/e60a2f9f-9fa0-4c8d-a693-42b48d65d5b9-150422000137-conversion-gate01-thumbnail.jpg?width=640&height=640&fit=bounds)


![[DSC Europe 25] Dragana Ilic - AI for Big Data in Astronomy.pptx](https://cdn.slidesharecdn.com/ss_thumbnails/8palya86qaatvjhva1ms-2-dragana-ilic-ai-ilic-251208151906-652b819c-thumbnail.jpg?width=640&height=640&fit=bounds)


![[DSC Europe 25] Boris Perkovic - Lost in performance.pptx](https://cdn.slidesharecdn.com/ss_thumbnails/uq5hrp7vsuahqkxzifux-1-251204082258-fd2ee09d-thumbnail.jpg?width=640&height=640&fit=bounds)


![[DSC Europe 25] Marija Vlajkovic & Andrea Radonjanin - Integration of AI tool...](https://cdn.slidesharecdn.com/ss_thumbnails/qf1jrglttoc3bm8s3aop-final-integration-of-ai-tools-251208151905-394f3a6a-thumbnail.jpg?width=640&height=640&fit=bounds)
![[DSC Europe 25] Nikola Rajovic - Hardware Technologies Under the Hood: RISC-V...](https://cdn.slidesharecdn.com/ss_thumbnails/o2gptrmtoyqndgoshwgq-dsc2025-tenstorrent-rajovic-251205090438-814685f5-thumbnail.jpg?width=640&height=640&fit=bounds)


![[DSC Europe 25] Vid Stimac - Policy Parsimony: Between Oversimplifying and Ov...](https://cdn.slidesharecdn.com/ss_thumbnails/eqlepagzqp2rhg3gbluh-dsc-stimac-251120-251205090438-059e7f54-thumbnail.jpg?width=640&height=640&fit=bounds)
![[DSC Europe 25] Max Talanov - Non digital NNs.pptx](https://cdn.slidesharecdn.com/ss_thumbnails/wif8tr3gtua74qvtopke-non-digital-nns-251205090438-26b0eea6-thumbnail.jpg?width=640&height=640&fit=bounds)
