Intellectual property Strategy
•Download as DOC, PDF•
1 like•656 views

Intellectual property Strategy - the role of intellectual property in strategy evolution - an early draft of a potential book

Recommended
Recommended
More Related Content
Viewers also liked
Viewers also liked (6)
Similar to Intellectual property Strategy
Similar to Intellectual property Strategy (20)
More from Murray Hunter
More from Murray Hunter (20)
Recently uploaded
Recently uploaded (20)
Intellectual property Strategy
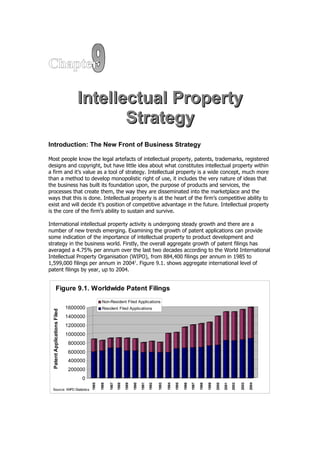
- 1. Chapter Intellectual Property Strategy Introduction: The New Front of Business Strategy Most people know the legal artefacts of intellectual property, patents, trademarks, registered designs and copyright, but have little idea about what constitutes intellectual property within a firm and it’s value as a tool of strategy. Intellectual property is a wide concept, much more than a method to develop monopolistic right of use, it includes the very nature of ideas that the business has built its foundation upon, the purpose of products and services, the processes that create them, the way they are disseminated into the marketplace and the ways that this is done. Intellectual property is at the heart of the firm’s competitive ability to exist and will decide it’s position of competitive advantage in the future. Intellectual property is the core of the firm’s ability to sustain and survive. International intellectual property activity is undergoing steady growth and there are a number of new trends emerging. Examining the growth of patent applications can provide some indication of the importance of intellectual property to product development and strategy in the business world. Firstly, the overall aggregate growth of patent filings has averaged a 4.75% per annum over the last two decades according to the World International Intellectual Property Organisation (WIPO), from 884,400 filings per annum in 1985 to 1,599,000 filings per annum in 20041. Figure 9.1. shows aggregate international level of patent filings by year, up to 2004. Figure 9.1. Worldwide Patent Filings Non-Resident Filed Applications 1600000 Resident Filed Applications Patent Applications Filed 1400000 1200000 1000000 800000 600000 400000 200000 0 1987 1989 1991 1992 1993 1994 1996 1998 2000 2002 2003 1985 1986 1988 1990 1995 1997 1999 2001 2004 Source: WIPO Statistics
- 2. The figures show that most of the increase in patent filing activity is by non-residents filing in other jurisdictions, which is increasing at the rate of 7.4% per annum. The significance of this is that it is an indicator of the spread of firm internationalisation in their expansion strategies. Figure 9.2. shows from which countries the majority of patent filing activity is coming from, where the top 5 countries, Japan, USA, Republic of Korea, China and the European Union are receiving 75% of all patent filings undertaken worldwide. This roughly equates with the relative importance of these markets to the World economy, except for the Republic of Korea, which as a single market is relatively small in World importance. Figure 9.2. Twenty Largest Patent Filing Countries 2004 Poland Italy Argentina Singapore Hong Kong (SAR) Norw ay Mexico France India Brazil United Kingdom Russian Federation Australia Canada Germ any European Patent Office China Korea, Rep. USA Japan 0 50000 100000 150000 200000 250000 300000 350000 400000 450000 Number of Patent Filings Resident Patent File Applications Source: WIPO Statistics Non-Resident Patent File Applications As a rough indicator of the level of innovation within particular countries is a comparison of the number of resident patents filed per Million population in each country. Japan and the Republic of Korea have the highest rates of resident patent applications per Million population. The World average is 148 per Million population for those countries where statistics are available. Figure 9.3. shows a country ranking compared to the World average, highlighted by an arrow. Focusing on the Asia-Pacific region Figure 9.4. shows the number of resident international patent in the region in 2006. International patent filings are more relevant than domestic patent filings as the international filings figures are a better indicator of the countries international influence in the global business arena. Countries like Japan, Republic of Korea, China and Australia are far in front of the rest of the Asia-Pacific region. In the Asian grouping India had 627 international patent filings during 2006 and Singapore 402. Both countries have invested in R&D very heavily, with India expected to become an industrial giant in the near future and Singapore publicly emulating the Korean Research model in cluster development, in large investments like the biotechnology Biopolis2. Although aggregate filings are low in the rest of the Asian region, Malaysia stands out with some relative success with its National Policies on projects such as the Multimedia Super Corridor (MSC) in generating new patent filings, notwithstanding the criticisms levelled at such projects by media and industry commentators3. The Asian region, all would agree, still has a long way to go, however issues like innovation and research and development commercialisation are on the top of policy agendas in these countries at this time4.
- 3. Figure 9.3. Number of Resient Patent Filings per Million Population 2004 M exic o 5 India 7 Turkey 7 Thailand 11 B razil 21 A rgentina 28 B eligium 50 C hina 51 C zec h R epublic 61 P o land 62 S pain 67 Hungary 75 Ukraine 86 B elarus 108 Italy 111 C anada 125 Netherlands 134 S ingapo re 147 Wo rld A verage 148 World Average R us s ian 160 S witzerland 217 Is rael 227 F ranc e 236 A us tria 275 S weden 308 UK 320 No rway 335 D enmark 347 F inland 385 New Z ealand 402 A us tralia 479 G ermany 587 US A 645 Ko rea, R ep. 2189 2884 J apan 0 500 1000 1500 2000 2500 3000 Number of Resident Patent Filings/Million Population 2004 Source: WIPO Statistics Figure 9.4. International Patents Filed by Residents in Asia-Pacific Region 2006 Vietnam 9 12 Thailand Singapore 402 15 Philippines New Zealand 316 54 Malaysia 5935 Republic Korea 4 Dem. Rep Korea 26906 Japan India 627 6 Indonesia 3910 China 1 Brunei Darussalam 2139 Australia 0 5000 10000 15000 20000 25000 30000 Number of International Patents Filed by Residents Source: WIPO Statistices An important measure of productivity and efficiency in research, development and potential commercialisation (as the figures don’t tell us how many patents are actually commercialised), is the rate of patent filings per USD Million spent on R&D. Figure 9.5. shows the number of resident patents filed per USD Million spent on National R&D.
- 4. Figure 9.5. Resident Patent Filings per USD 1.0 Million R&D Expenditure 0.08 Belgium 0.14 Turkey 0.21 Mexico 0.23 Israel 0.23 Canada 0.23 India 0.26 Netherlands 0.27 Spain 0.28 Czech Republic 0.29 Sw eden 0.29 Sw itzerland 0.3 Brazil 0.37 Italy 0.41 France 0.41 Finland 0.43 Austria 0.46 Denm ark 0.51 Thailand 0.54 Hungary 0.56 Norw ay 0.61 Argentina 0.62 UK 0.71 USA 0.78 China 0.81 World Average 0.92 Germ any 0.99 Poland 1.13 Australia 1.18 Singapore 1.46 Russian 1.5 Ukraine 1.67 New Zealand 3.15 Belarus 3.49 Japan 4.6 Korea, Rep. 0 1 2 3 4 5 Number of Resident Patent Filings per USD 1 Million R&D Expenditure Source: WIPO Statistics Both the Republic of Korea and Japan have very high rates of patent applications per USD Million spent on research and development expenditure. Again as is the case of patent filings per Million population, most countries above the world average are industrialised and emerging countries. It is almost impossible to generalise the reasons for the ranking position of each country as each country has their own unique research and development models and cultural approaches to the development of intellectual property, which proves successful to them. Ironically, some countries like Singapore that emulated some of the European and faired better. Other countries like the Russian Federation, Ukraine and Belarus have come out of the Communist block and manage to produce above average intellectual property outputs relative to the research dollars put in. Japan has its own well known model of nexus between government, research institutions, universities, financial institutions and business5, which produces high outputs. Other commentators would disagree about the success of the model and claim high patent application is an integral part of Japanese business strategy6. Turning to the technology categories where patent applications are filed provides some indication about the nature of the World’s industry mix and where money is being spent on research and development. Figure 9.6. shows the major categories of technology where patent applications are filed. An important additional piece of information is the rate of growth in terms of patent applications to provide some indication of the activity within each category. Semiconductors, information technology, pharmaceuticals and cosmetics are the largest groups of growth. Surprisingly, biotechnology over the last five years has displayed negative growth from 9,001 applications filed in 2002 down to 6,952 applications filed in 2006. As these figures are based on the accepted international patent classifications, it is possible that biotechnology patents tend to be filed under their potential applications, i.e., pharmaceuticals and cosmetics, etc. Conversely, this could indicate a trend toward maintaining proprietary knowledge within the firms choosing to develop new intellectual property and maintain maximum secrecy about processes from their competitors.
- 5. Figure 9.6. Major Categories of International Patent Applications 2006 Consumer Goods & Civil Engineering, Building, Mining Other Transport Equipment 2% 1% Electrical devices & 3% 5% electrical engineering Mechanical Components 6% 3% Machine Tools, Engines, Audio-Visual Thermal Process 4% 5% Telecommunications Materials Processing, 8% Textiles & Paper 3% Information Technology 8% Industrial Processes, Handling & Printing Semiconductors 7% 3% Agriculture and Food Processing Optics 2% 2% Pharmaceuticals & Cosmetics Analysis & Medical Biotechnology Organic, 8% Technology 4% Material & Surface Macromolecular & 13% Technology Chemical Engineering Polymer Chemistry Source: WIPO Statistics 5% 2% 7% Further, short technology lifecycles in the biotechnology arena due to exponential growth in discoveries may also discourage patent applications. Figure 9.7. Main Areas of Patent Filing Growth 2006 28% 30% 22% 25% 21% 17% 16% 20% 15% 13% 11% 13% 13% 13% 12% 12% 11% 15% 11% Percentage Growth (%) 8% 9% 8% 8% 10% 5% 0% -5% -5% Optics Organic, Biotechnology Mechanical Audio-Visual Chemical Industrial Civil Engineering, Information Agriculture and Food Machine Tools, Transport Electrical devices & Semiconductors Analysis & Medical Materials Pharmaceuticals & Consumer Goods & Telecommunications Material & Surface Source: WIPO Statistics
- 6. Growth figures in Figure 9.7. can be misleading in areas of agriculture and food where agricultural food and processing machinery patent applications is stagnant and actually showed a 3% decline in applications between 2005 and 2006. However agriculture applications and food technology is consistently increasing at a rate of 17% per annum, showing the focus of the industry over the last half decade. Within the analytical instruments category, laboratory instruments are showing around 7% growth per annum, but imaging technology in the medical field is showing 15% growth and is becoming the largest area of category development. Within the organic, macromolecular chemistry and polymer category, fine chemicals are showing almost no growth, while polymers are growing at 19% per annum. Who are the people and organisations filing patents? This varies according to the technology area and country. For example in the area of pharmaceuticals and cosmetics most applicants are the companies involved in the industry. Very few patent applications would come from individual inventors, research institutions or universities. However very generally across all categories and countries large corporations would be responsible for approximately 25% of all applications, followed by medium to large companies making another 30% of all applications. Universities and research institutes would be responsible for 15% of applications, small to medium companies specialising in an industry another 15% of applications and individual inventors filing the balance 15% of patent applications. At this point it is worth mentioning that only a very small percentage of patents filed are actually commercialised and also a large number of patents filed are also allowed to lapse before they are examined and approved by the patents office. Sometimes this is done for a reason, which be discussed later in this chapter. Before moving on into a more detailed discussion of intellectual property strategy it is worth summarising the trends the statistics shown are indicating; • The aggregate growth in patent filings has generally been in line with world economic growth however some technology sectors like semiconductors, information technology and pharmaceuticals are showing much higher than world economic growth. This indicates that some emerging industries are taking on much more importance in the world economy than before and most of them are technologically relatively new fields of research and development and it will be sometime before they become mature industries. • There is growing internationalisation of patent filing in jurisdictions outside applicant resident countries especially through the Patent Cooperation Treaty (PCT) system indicating that patent applicants view the potential for their inventions on a multi- market or global basis, rather than their own domestic markets. This indicates a much more global orientation towards markets and business in the last few decades is being taken. • There is a rapid growth in patent applications from the East Asian region which indicates the emergence and growing importance of the region in global business and innovation. • Some countries perform better per-capita and per amount of R&D funds spent than other countries indicating that different countries have developed different levels of innovation and research efficiency, and • Finally, intellectual property is an important part of corporate strategy. A number of other issues regarding intellectual property are also putting great influence upon business strategy. Today, market leadership within an industry can be short lived if a company does not continue to invest in new technology. The Disktronics factory in Melbourne Australia during the 1980s was the only factory in the Southern Hemisphere that could produce compact discs. The company had a USD 10 Million investment in the technology only to find within a few years that compact discs reproduction technology could be undertaken with equipment at a fraction of the cost with personal computers having the same ability to
- 7. burn disks by the 1990’s. Likewise, the telegram industry has almost faded out around the world with the advent of a number of alternative communication technologies. The continued emergence of new technology is one of the primary drivers of new opportunity where exploitation leads to the creation of new markets and even new industries. This infers the need by business to spend large resources on research and development to convert new technology advances into new products. Rapid technology advances increases the risk of investing in new technology as there is a potential that the technology may become superseded before the investment can be recovered. This places the long term survival of the firm into question in today’s business environment, where large investments have been made in specific technologies and strategies. The replacement of existing technologies is happening so fast that 40% of the Fortune 500 companies that existed in 1975 do not exist today7. Now, on average new products launched in the last five years make up 33% of most successful companies profits8. In some industries, mobile phones, televisions, white goods and automobiles, etc this figure is 100%. The cost of new technology is a powerful driver for firms to expand product distribution over a large number of international markets to recover investment costs quicker. New technologies are thus a push factor for the globalisation of companies due to the need to obtain greater economies of scale, hence the need to protect technology through the international intellectual property system is a very important corporate issue. Rapid technology advances not only increase risk as discussed above but have created a situation where a single firm cannot keep up with all advances in the industry. This has provided new opportunities for small specialised firms to develop specific technologies as we see in the information technology and biotechnology industries. New forms of strategic alliances are being created with a number of companies involved with universities and research institutions where the benefits of the new technology development is being shared among a number of organisations and individuals. Consequently the role of intellectual property is becoming valuable as a means of division and means of exchange as an instrument in commercial transactions based on licensing agreements. Intellectual property has become a tradable item of packaged technology in patents, trademarks and copyright to enable other companies to benefit from them. Intellectual property in the information technology industry is now a product in its own right, forming part of a whole product sold to the consumer. Intellectual property is a source of revenue and a market strategy for its developers. On your PC you will most likely have the trademarks and products of Microsoft, Adobe and Norton. This has led to the development of intellectual property portfolios where a collection of patents, trademarks and copyright is held for the purpose of gaining revenue through licensing. This trend has given rise to a new industry of legal enforcement where individuals and companies, termed as ‘patent trolls’ seek out patent infringers for the purpose of enforcing patent rights and seeking damages or licence fees9. The expansion of intellectual property rights is being used by corporations to gain competitive advantage through monopolising certain pieces of science, technology and even everyday language for their exclusive use. In the opinion of Michael Perelman intellectual property rights have gone far beyond protection for useful inventions and copyrights for music and literature10. A number of absurdities have occurred in the US patent system have occurred where overzealous companies and attorneys have attempted to enforce rights far beyond the original intentions of intellectual property legislation and create right monopolies on everyday words and phrases. For example, the American Society of Composers, Authors and Publishers (ASCAP) tried to sue the American girl scouts for signing ‘Row, Row, Row Your Boat’ around campfires until there was a public backlash11. The American National Basketball Association (NBA) launched a suit against America Online (AOL) over the publishing of game scores and statistics on its website12. A person managed to patent the correct way to lift a box13. Ralph Lauren won a case in the appeals court in 2000 against US Polo Association for using the word ‘Polo’ as its magazine name14. The Australian Institute of Management (AIM) was asked to change the name of a 20 year old training course called ‘Effective Negotiation Skills’ on their website because a US
- 8. training group Karras had a US trademark over the terms ‘Effective Negotiating’ , ‘Advanced Effective Negotiating’ and ‘Effective Sales Negotiating’15 People have been able to gain patents for colours and specific numbers16 and the courts have even dismissed a claim from a patient whose doctor without the patient’s knowledge patented genetic material from his body17. A little more than a decade ago searching patent databases involved the physical travelling to patent offices and searching microfilm or employing a patent attorney to undertake the search for a fee. Over the last decade most patent offices have begun to provide online access to their databases. At first many of these databases were restricted and not particularly user friendly, however these search systems are being overhauled and updated to make access and search protocols very easy. Just recently Google launched its patent search product on its website which provides search access for full texts of US patents online. The now easy access to intellectual property databases online provides much quicker dissemination of science and technology around the world. Certainly this trend is of benefit to scientists and inventors of developing countries in the Asian region as information that once took many months to obtain is now online. There is likely to be effects from the ease of access of intellectual property information online. Firstly, there will be a speed up of the process of inventing around patents where inventions such as new chemical compounds are either reengineered along a different route to ‘go around’ or break the existing patent, thus leading to shorter protection times for existing inventors. Secondly there is likely to be an increase in challenges to existing patents based on prior knowledge by other inventors. The General Intellectual Property Structure: What is What in IP Traditionally companies have been managed in terms of their physical assets and still to a great degree companies in the South-East Asian region are operated within this paradigm. Businesses tend to be thought of in terms of the buildings, production facilities, retail and wholesale outlets and networks they control, items that can basically be purchased, owned and controlled and disposed of with relative ease. Businesses use these assets to implement their strategies and fulfil their functions to exert influence over the marketplace. Competitors are fairly easily able to emulate market leaders in assets and basic marketing strategies that would potentially appear to be the most successful path. The whole management, financial and accounting procedure within corporate organisations is based on the utilisation, consumption, movement and acquisition of these physical items. However when examining the values of businesses in the region, one finds that their market values far exceed their net tangible asset values (total assets minus total liabilities). The difference in the market and net tangible asset value is the value of the firm’s intellectual property. Table 9.1. below shows the various values for some major firms in the South-East Asian Region. Table 9.1. Net Tangible, Market and Intangible Values for Some Listed Companies in the South-East Asian Region Company Country Net Tangible Intangible Market Value Asset Value Asset Value The shift from the industrial to the knowledge paradigm, even in traditional manufacturing industries has a number of consequences for business strategy and the intellectual property structure is a major influence upon the way firms need to develop, implement and exercise their strategy options. Companies have focused on guarding their physical assets which is relatively simple are the objects are tangible and can be locked up and secured. However
- 9. history has shown when top management moves from one firm to another there can be dire consequences for the former company. One of the most dramatic examples of this was the move of Lee Iacocca in 1979 to Chrysler taking a number of top Ford marketing executives with him. Ford lost a substantial amount of its market know-how and eventually market share to Chrysler. This showed corporate America that know-how is one of the most important forms of intellectual property a company can posses and led to the development of management contracts with secrecy, confidential information and exclusivesity clauses to prevent former managers utilising their know how in the same industry after they leave company service. Usually large payout provisions exist to secure these rights for the company over their employees. To fully understand the importance of intellectual property and its true value to the strategy of a firm, one has to appreciate its embedded ness within the core of the company’s mission and objectives and that intellectual property itself highlights the company’s competencies that it uses in its core strategies. To view intellectual property otherwise would miss the very concepts of creating barriers to entry for potential competitors, creating competitive advantage over competitors and understanding the relative nature of the concept. Intellectual property is also at the heart of winning customers ‘hearts and minds’, gaining trust and reputation in the market place and making a strong emotional connection with customers, which is at the heart of any company’s core mission. Figure 9.8. shows the integration between a firms core mission and intellectual property. Figure 9.8. Integration between a Firm’s Core Mission and Intellectual Property 1. Recognition 2. Desirability To develop public recognition and carry over To enable companies to delivery good certain desired values to consumers products with superior performance to competitors, new features, extended product life, etc, so that products are competitive and desirable. Trademarks and certain Copyright Patents, Registered Designs and Information Proprietary Knowledge 3. Form 4. Emotional Connection To develop recognisable literary and visual To maximise financial returns for production forms that add value and assist in creating an undertaken by the company, add to product inherent desirability to the form of differentiation and develop an emotional communication between company and connection with consumers. consumer. Copyrights and Trademarks Brands and Trademarks Adapted from Otto A. Stamm 200018 If intellectual property is viewed as a box of tools that can be combined in a particular way to fulfil marketing and protection objectives, then intellectual property strategy can be harnessed to benefit the firm greatly. Thus using intellectual property in this way is the best way to safeguard and protect a company’s products and position in the market place. Intellectual property tools will have different values in different industries, but the general array of tools useful to a firm, which can be utilised in different mixes to achieve an overall business strategy is shown in figure 9.9. The three prime influences on the firm are the advent of new technologies, product life cycles and competition. The firm must be able to apply gathered knowledge to create its source of proprietary knowledge to form the core and basis of its general business strategies to apply to the market place against existing competitors, who will be undertaking their own cycle of strategy development and implementation. The success of the firm’s strategy involves packaging its intellectual property into the correct mix of strategies and protections to develop differentiation and relative competitive advantage over its competitors. Skills and knowledge creatively applied to developing a general business strategy to maintain a
- 10. sustained competitive advantage, which utilises recognition symbols, customer relationships, emotional connections with consumers, correct product forms that are desirable, manifested in patents, designs, proprietary knowledge, trademarks and copyright, supported by various employee agreements. Figure 9.9. The General Tools of Intellectual Property in Business Strategy Influence of New Product Development Technology - Invention (new to the world) - New to company product Competitors - New Style, variant or benefits Patent, Registered Design, Proprietary Influence of Knowledge (secrecy and Product non-disclosure Lifecycle agreements) Process Development (manufacturing) Patent, Proprietary Knowledge (secrecy and non-disclosure The Market agreements) The General Business Market Strategy Place Strategy Market parameters (mix) Values Channels Expectations Knowledge Emotions Image & Story (target) Knowledge, Creativity, Recognition Branding, Trademarks, Potential Copyright Emotional Connections Some parts of intellectual property are easier to copy and emulate by others. This is why continual improvement, change and new product development are the best methods of protection and maintaining a relative competitive advantage over competitors. Failure to improve, change and develop new products will render companies in slow technology emerging industries as a seller of generic products, like in the pharmaceutical, household cleaning, cosmetics and agricultural chemical industries. In the case of fast emerging technology industries companies will become completely irreverent to the market which itself may quickly cease to exist, as is the case in mobile telephones, personal computers and electronic media storage. Figure 9.10. shows the IP/market scenarios with competitive advantage in slow and fast technology emerging industries. Figure 9.10. a. shows the scenario of a slow emerging technology market where changes in technology as well as being steady, tend to be incremental. In the early years, patents are relied upon for protection, but through time as more companies develop new ways to produce the same product, relative competitive advantage can only be improved through a new technology development. Once a new product based on the new technology is launched into the market and consumers except that technology, the existing market based on the old technology continues, but as more companies enter the market, it becomes difficult to differentiate between different products and the market begins resembling a commodity market. Price discounting will become the primary strategy to maintain market share. As further advances in technology continue to change product form, other methods of intellectual property protection like registered designs to protect the form and branding become more important protection than patents. The situation in the scenario of fast emerging technology markets, shown in Figure 9.10. b. is usually a market protected by patents through the complete evolution of the market as new emerging technology changes the basic technology behind the basic product form. As the new technology is proven to be
- 11. more efficient and cost effective to consumers, the market for the old product will eventually die out. Figure 9.10. IP/market scenarios with competitive advantage in slow and fast technology emerging industries a. Slow Emerging Technology Market Air Fresheners Branding Primary Used IP Protection Relative Competitive Advantage Registered Designs Liquid Air Fresheners Patents Car Air fresheners Failure to advance IP and convert into new products results in competition in a price sensitive market where Gel Air Fresheners brands don’t attract consumer recognition 1960s 1970s 1990s Time b. Fast Emerging Technology Market Electronic Media Storage Primary Used IP Protection Relative Competitive Advantage Patents Pen Drives Compact Rapid decline of media Disks use after introduction of new media until product ceases to be used anymore, Companies must cease operations or switch Floppy Disks to new technology 1960s 1970s 1990s Time To the firm, the most important aspects of the intellectual property mix are those components that assist the product to sell. There is little point developing a new product that has good protection, if it does not sell well in the market. It is rarely a patented technology that sells the product. More likely, it will be the perception of it the company portrays to consumers. When Nike developed the encapsulated gas membrane within the sole of the
- 12. shoe, it was introduced as “Nike Air’, conjuring an image of the product’s desirability through consumer emotions and aspirations, identifying with the emotional rewards in sport and leisure with the slogan ‘just do it’. Although the technology of the shoe may have been brilliant, it was the intellectual property of branding, trademarks and copyright that developed the real value for the company. As was seen, some parts of the concept was quickly emulated by others, but not the complete winning intellectual property mix, so Nike’s was able to maintain a relative competitive advantage over its competitors. The images of Mercedes Benz, Harley Davidson, Apple, Listerine, Coca Cola, Marlboro and Calvin Klein conjure up emotional responses in consumers about image rather than technical interest for the actual product artefacts themselves. So far the discussion has tried to show how widely intellectual property is used in business and the role it plays in market dynamics. The concept of intellectual property strategy goes far beyond legalistic definitions and institutions, and used as part of the overall firm strategy, although it may not have been recognised as such. Intellectual property strategy is a craft like other strategy formation and lies at the very heart of companies’ value. The intention of the intellectual property legal framework is to provide moral, economic and legal rights to creators in their creations and to the rights of the public in accessing those creations and to promote creativity and dissemination and application of those results, to encourage fair trade, which would contribute to social and economic development19. However many commentators are strongly critical of the system
- 13. 1 WIPO Patent Report: Statistics on Worldwide Patent Activities, World Intellectual Property Association, 2006 Edition, http://www.wipo.int/freepublications/en/patents/931/wipo_pub_931.pdf (accessed 15th March 2007) 2 Agency for Science, Technology and Research, Biopolis: A World Class Research Complex, http://www.a- star.edu.sg/astar/biopolis/index.do (accessed 20 December 2005). 3 Chee, Y.H., Malaysia’s New Dream: Biovalley, Online Asia Times, http://www.atimes.com/atimes/Southeast_Asia/EL24Ae01.html (accessed 15 December 2005) 4 Ninth Malaysia Plan 2006-2010, The Economic Planning Unit, Prime Minister’s Department, May 2006. 5 Ouchi, W., G., (1984), The M-Form Society, Reading, Mass., Addison-Wesley. 6 Arai, H., (1999), The Japanese Experience in Wealth Creation. Geneva, World Intellectual Property Organisation. 7 Griffin, A., (1997), The Drivers of NPD Success: The PDMA Report, Chicago, Product Development & Management Association. 8 Foster, R., N., (2000), ‘Managing Technological Innovation for the Next 25 Years’, Research-Technology Management, 43, 1., Jan/Feb., P. 20. 9 Paltorak, A., On ‘Patent Trolls’ and Injunctive Relief, www.ipfrontline.com (accessed 16th May 2006). 10 Perelman, M., (2001), Steal the Idea: Intellectual Property and the Corporate Confiscation of Creativity, Palgrave. 11 Elisabeth Bumiller,(1996), “ASCAP Tries to Levy Campfire Royalties from Girl Scouts and Regrets It,” New York Times, 17 December. 12 Annon., (1996), “America Online Faces Lawsuit by NBA Over Data on Games,” Wall Street Journal, 29 August. 13 Walsh, M., (1996), “Patently Ridiculous, Some Say; People Dunk Basketballs. People Lift Boxes. Should the Patent Office Protect Their ‘Inventions’?” Legal Times, 19 August, S32. 14 Shulman, S., (2001), “PB&J Patent Punch-Up,” Technology Review 104, May. 15 James, D., (2000), “Trademarks: Latest Word on the Internet: It’s Legal Chaos,” Business Review Weekly (Australia), 4 February. 16 Garfinkel, S., (1995), “A Prime Legal Patent: Legal Rights to a Number Upset Programmers and Lawyers,” Scientific American, 273, July, P. 30. 17 Boyle, J.,(1996), Shamans, Software, and Spleens, Cambridge, Mass., Harvard University Press, pp. 21–24. 18 Stamm, O., A., (1993), ‘Intellectual Property Rights and Competitive Strategy: A Multinational Pharmaceutical Firm’, in Wallerstein, M., B., Mogee, M., A., and Scheon, R., A., (Editors), Global Dimensions of Intellectual Rights in Science and Technology, Washington D.C., Office of International Affairs Research Council, The National Academy of Sciences, P. 221. 19 WIPO, undated, Understanding Intellectual Property, Geneva, World Intellectual Property Organisation, Publication 895(E), P. 4., (accessed at www.wipo.int/publications, 24 February 2007)