SlideShare a Scribd company logo
1 of 32
Books on Politics Network-
2004
Objective: To analyse a graphical
representation of a network
Coral reef
food web,
Cuba
233 vertices
3,753 edges
Data: http://datadryad.org/resource/doi:10.5061/dryad.c213h
Objective: To analyse a graphical
representation of a network
CMT111
Students,
Cardiff
26 vertices
30 edges
Objective: To analyse a graphical
representation of a network
Purchase of political books,
USA
105 vertices
441 edges
Data courtesy of Valdis Kreb available at: http://www-personal.umich.edu/~mejn/netdata/
Limitations
• Data limited: Number of purchases missing from
database, date of purchase, buyer data e.g.way voted
• No weights : Number of buyers who purchased both
books
• Mathematica’s definitions (hubs, k-cliques)
Mathematica
• Importing data
• Will not read as wide a variety of CSV formats as Gephi
• Can read .gml, .gv, .dot, .graphml, .gxl, .col, .g6, .s6, .gw, .net, .tgf
• Use Map or create a rule to show links (->) from one column of a CSV onto
another
• Other attributes
• More difficult to show vertex/edge attributes than in Gephi but still ppssiblt to
highlight using HighlightGraph[g, x]
• Built-in functions
• Very intuitive and well documented:
https://reference.wolfram.com/language/guide/GraphsAndNetworks.html
Book frequent purchase of both
books (endpoints) -
from Amazon ‘people who
bought this also bought’
NODE LINK
This graph is
unweighted: edges do not have associated weights
undirected: all edges travel in both directions
contains loops: no vertex is linked directly to itself
simple: undirected, unweighted, loop-free and lacks multiple edges
incomplete: each vertex is not connected to every other vertex
cyclic: contains at least one cycle
not bipartite: vertices cannot be divided into two disjoint sets
UndirectedGraphQ[books]
WeightedGraphQ[books]
CompleteGraphQ[books]
SimpleGraphQ[books]
BipartiteGraphQ[books]
LoopFreeGraphQ[books]
AcyclicGraphQ[books]
{6, 4, 4, 23, 8, 7, 11, 8, 25, 16, 15, 18, 25, 13, 9, 5, 3, 5, 3, 5, 10, 5, 7, 9, 9,
5, 9, 9, 3, 4, 20, 11, 5, 9, 5, 10, 5, 7, 7, 8, 18, 8, 6, 5, 5, 6, 4, 18, 4, 8, 3, 6,
5, 5, 6, 4, 4, 5, 13, 5, 6, 4, 6, 4, 9, 7, 21, 6, 4, 5, 7, 15, 22, 21, 16, 16, 13, 7,
5, 8, 4, 4, 9, 8, 23, 5, 14, 5, 5, 6, 5, 8, 3, 7, 7, 4, 6, 6, 5, 12, 12, 5, 4, 2, 3}
VertexDegree[books]
Vertex degrees:
Histogram[VertexDegree[books], ChartStyle -> Blue,
AxesLabel -> {HoldForm[Vertex degree], HoldForm[Frequency]},
PlotLabel -> None, LabelStyle -> {14, GrayLevel[0]}]
MatrixForm[GraphDistanceMatrix[books]]
Distance matrix
Array plot: distance matrix
ArrayPlot[GraphDistanceMatrix[books]]
Max[Flatten[GraphDistanceMatrix[books]]]
OR
GraphDiameter[books]
Diameter = 7
Radius = 4
GraphRadius[books]
Maximum and minimum eccentricities of any vertex:
Eccentricity Centrality
HighlightGraph[books, VertexList[books],
VertexSize ->
Thread[VertexList[books] ->
Rescale[EccentricityCentrality[books]]]]
Increases as maximum distances to every other reachable node increases
Closeness Centrality
HighlightGraph[books, VertexList[books],
VertexSize ->
Thread[VertexList[books] ->
Rescale[ClosenessCentrality[books]]]]
Increases as average distance to other nodes increases
Betweenness Centrality
HighlightGraph[books, VertexList[books],
VertexSize ->
Thread[VertexList[books] ->
Rescale[BetweennessCentrality[books]]]]
Increases as node lies on more shortest paths between other node-pairs
Degree Centrality
HighlightGraph[books, VertexList[books],
VertexSize ->
Thread[VertexList[books] ->
Rescale[DegreeCentrality[books]]]]
Increases as vertex degree increases
a = ListPlot[EccentricityCentrality[books], Filling -> Axis, PlotStyle -> Red]
b = ListPlot[ClosenessCentrality[books], Filling -> Axis, PlotStyle -> Magenta]
c = ListPlot[RadialityCentrality[books], Filling -> Axis, PlotStyle -> Cyan]
d = ListPlot[DegreeCentrality[books], Filling -> Axis]
gg = GraphicsGrid[{{a, b}, {c, d}}]
Export["CentralityGrid.png", gg]
Eccentricity Closeness
Radiality Degree
Dual Hub
HighlightGraph[books, GraphHub[books]]
Nodes with the highest vertex degree are returned
Hub Neighbours
HighlightGraph[books, NeighborhoodGraph[books, GraphHub[books]]]
CommunityGraphPlot[books]
Communities: Small world graph (Modular)
Graph partition:
minimises number of endpoints having edges in each part
HighlightGraph[books,FindGraphPartition[books]]
Graph communities:
maximises edges joining nodes within communities
with relatively fewer edges joining to nodes in other
communities
HighlightGraph[books, FindGraphCommunities[books]]
Centrality - showing bifurcation
partitioning based on edge centrality
CommunityGraphPlot[books, FindGraphCommunities[books, Method -> "Centrality"]]
ation - “Uncovering the overlapping community structure of comple
Finds largest k-
cliques first
then reduces k
CommunityGraphPlot[books, FindGraphCommunities[books, Method -> "CliquePercolation"]]
[1] Palla et al., Nature 435, 814-818 (2005)
Cliques
Largest set of connected vertices
HighlightGraph[books, Subgraph[books, FindClique[books]]]
Cliques
Largest set of connected vertices within 2 edges of each other
HighlightGraph[books, Subgraph[books, FindKClique[books, 2]]]
Cliques
Largest set of connected vertices within 3 edges of each other
HighlightGraph[books, Subgraph[books, FindKClique[books, 3]]]
Cliques
Largest set of connected vertices within 4 edges of each other
HighlightGraph[books, Subgraph[books, FindKClique[books, 4]]]
Cliques
Largest set of connected vertices within 5 edges of each other
HighlightGraph[books, Subgraph[books, FindKClique[books, 5]]]
Cliques
Largest set of connected vertices within 6 edges of each other
HighlightGraph[books, Subgraph[books, FindKClique[books, 6]]]
Cliques
Largest set of connected vertices within 7 (=diameter)
edges of each other
HighlightGraph[books, Subgraph[books, FindKClique[books, 7]]]
Lessons & Conclusions
• Mathematica Vs Gephi on Data Visualization
• Gephi struggles with larger datasets, crashes on OS X, cannot ‘undo’
• Gephi good a pulling apart larger datasets for easier visualisation, takes a wider range of
input formats, can visualise ‘multiple graphs’ more easily
• All the other functions within Mathematica at your disposal to aid network analysis e.g. Plot
• Source of Data Sets
• Working with a dataset of sufficient size but not so big that it cannot be comprehended.
• Analysis of sub-networks

More Related Content

Similar to Book buyer network

Text clustering
Text clusteringText clustering
Text clustering
KU Leuven
 
資料視覺化_透過Orange3進行_無須寫程式直接使用_碩士學程_202403.pdf
資料視覺化_透過Orange3進行_無須寫程式直接使用_碩士學程_202403.pdf資料視覺化_透過Orange3進行_無須寫程式直接使用_碩士學程_202403.pdf
資料視覺化_透過Orange3進行_無須寫程式直接使用_碩士學程_202403.pdf
FEG
 

Similar to Book buyer network (20)

A new link based approach for categorical data clustering
A new link based approach for categorical data clusteringA new link based approach for categorical data clustering
A new link based approach for categorical data clustering
 
Bba 2001
Bba 2001Bba 2001
Bba 2001
 
Simplicial closure and simplicial diffusions
Simplicial closure and simplicial diffusionsSimplicial closure and simplicial diffusions
Simplicial closure and simplicial diffusions
 
Engineering Data Science Objectives for Social Network Analysis
Engineering Data Science Objectives for Social Network AnalysisEngineering Data Science Objectives for Social Network Analysis
Engineering Data Science Objectives for Social Network Analysis
 
Network sampling, community detection
Network sampling, community detectionNetwork sampling, community detection
Network sampling, community detection
 
105575916 maths-edit-new
105575916 maths-edit-new105575916 maths-edit-new
105575916 maths-edit-new
 
Simplicial closure and higher-order link prediction (SIAMNS18)
Simplicial closure and higher-order link prediction (SIAMNS18)Simplicial closure and higher-order link prediction (SIAMNS18)
Simplicial closure and higher-order link prediction (SIAMNS18)
 
Lx3520322036
Lx3520322036Lx3520322036
Lx3520322036
 
15857 cse422 unsupervised-learning
15857 cse422 unsupervised-learning15857 cse422 unsupervised-learning
15857 cse422 unsupervised-learning
 
GraphDatabases
GraphDatabasesGraphDatabases
GraphDatabases
 
Introduction to graph databases in term of neo4j
Introduction to graph databases in term of neo4jIntroduction to graph databases in term of neo4j
Introduction to graph databases in term of neo4j
 
Lec 3.pptx
Lec 3.pptxLec 3.pptx
Lec 3.pptx
 
Group and Community Detection in Social Networks
Group and Community Detection in Social NetworksGroup and Community Detection in Social Networks
Group and Community Detection in Social Networks
 
Text clustering
Text clusteringText clustering
Text clustering
 
Data Curation and Debugging for Data Centric AI
Data Curation and Debugging for Data Centric AIData Curation and Debugging for Data Centric AI
Data Curation and Debugging for Data Centric AI
 
Cluster analysis using spss
Cluster analysis using spssCluster analysis using spss
Cluster analysis using spss
 
Clustering techniques
Clustering techniquesClustering techniques
Clustering techniques
 
Gradoop: Scalable Graph Analytics with Apache Flink @ FOSDEM 2016
Gradoop: Scalable Graph Analytics with Apache Flink @ FOSDEM 2016Gradoop: Scalable Graph Analytics with Apache Flink @ FOSDEM 2016
Gradoop: Scalable Graph Analytics with Apache Flink @ FOSDEM 2016
 
資料視覺化_透過Orange3進行_無須寫程式直接使用_碩士學程_202403.pdf
資料視覺化_透過Orange3進行_無須寫程式直接使用_碩士學程_202403.pdf資料視覺化_透過Orange3進行_無須寫程式直接使用_碩士學程_202403.pdf
資料視覺化_透過Orange3進行_無須寫程式直接使用_碩士學程_202403.pdf
 
Start From A MapReduce Graph Pattern-recognize Algorithm
Start From A MapReduce Graph Pattern-recognize AlgorithmStart From A MapReduce Graph Pattern-recognize Algorithm
Start From A MapReduce Graph Pattern-recognize Algorithm
 

Recently uploaded

Modular Monolith - a Practical Alternative to Microservices @ Devoxx UK 2024
Modular Monolith - a Practical Alternative to Microservices @ Devoxx UK 2024Modular Monolith - a Practical Alternative to Microservices @ Devoxx UK 2024
Modular Monolith - a Practical Alternative to Microservices @ Devoxx UK 2024
Victor Rentea
 
+971581248768>> SAFE AND ORIGINAL ABORTION PILLS FOR SALE IN DUBAI AND ABUDHA...
+971581248768>> SAFE AND ORIGINAL ABORTION PILLS FOR SALE IN DUBAI AND ABUDHA...+971581248768>> SAFE AND ORIGINAL ABORTION PILLS FOR SALE IN DUBAI AND ABUDHA...
+971581248768>> SAFE AND ORIGINAL ABORTION PILLS FOR SALE IN DUBAI AND ABUDHA...
?#DUbAI#??##{{(☎️+971_581248768%)**%*]'#abortion pills for sale in dubai@
 
Why Teams call analytics are critical to your entire business
Why Teams call analytics are critical to your entire businessWhy Teams call analytics are critical to your entire business
Why Teams call analytics are critical to your entire business
panagenda
 

Recently uploaded (20)

Emergent Methods: Multi-lingual narrative tracking in the news - real-time ex...
Emergent Methods: Multi-lingual narrative tracking in the news - real-time ex...Emergent Methods: Multi-lingual narrative tracking in the news - real-time ex...
Emergent Methods: Multi-lingual narrative tracking in the news - real-time ex...
 
Navigating the Deluge_ Dubai Floods and the Resilience of Dubai International...
Navigating the Deluge_ Dubai Floods and the Resilience of Dubai International...Navigating the Deluge_ Dubai Floods and the Resilience of Dubai International...
Navigating the Deluge_ Dubai Floods and the Resilience of Dubai International...
 
Cyberprint. Dark Pink Apt Group [EN].pdf
Cyberprint. Dark Pink Apt Group [EN].pdfCyberprint. Dark Pink Apt Group [EN].pdf
Cyberprint. Dark Pink Apt Group [EN].pdf
 
Artificial Intelligence Chap.5 : Uncertainty
Artificial Intelligence Chap.5 : UncertaintyArtificial Intelligence Chap.5 : Uncertainty
Artificial Intelligence Chap.5 : Uncertainty
 
Ransomware_Q4_2023. The report. [EN].pdf
Ransomware_Q4_2023. The report. [EN].pdfRansomware_Q4_2023. The report. [EN].pdf
Ransomware_Q4_2023. The report. [EN].pdf
 
Modular Monolith - a Practical Alternative to Microservices @ Devoxx UK 2024
Modular Monolith - a Practical Alternative to Microservices @ Devoxx UK 2024Modular Monolith - a Practical Alternative to Microservices @ Devoxx UK 2024
Modular Monolith - a Practical Alternative to Microservices @ Devoxx UK 2024
 
AWS Community Day CPH - Three problems of Terraform
AWS Community Day CPH - Three problems of TerraformAWS Community Day CPH - Three problems of Terraform
AWS Community Day CPH - Three problems of Terraform
 
Boost Fertility New Invention Ups Success Rates.pdf
Boost Fertility New Invention Ups Success Rates.pdfBoost Fertility New Invention Ups Success Rates.pdf
Boost Fertility New Invention Ups Success Rates.pdf
 
"I see eyes in my soup": How Delivery Hero implemented the safety system for ...
"I see eyes in my soup": How Delivery Hero implemented the safety system for ..."I see eyes in my soup": How Delivery Hero implemented the safety system for ...
"I see eyes in my soup": How Delivery Hero implemented the safety system for ...
 
Web Form Automation for Bonterra Impact Management (fka Social Solutions Apri...
Web Form Automation for Bonterra Impact Management (fka Social Solutions Apri...Web Form Automation for Bonterra Impact Management (fka Social Solutions Apri...
Web Form Automation for Bonterra Impact Management (fka Social Solutions Apri...
 
Exploring the Future Potential of AI-Enabled Smartphone Processors
Exploring the Future Potential of AI-Enabled Smartphone ProcessorsExploring the Future Potential of AI-Enabled Smartphone Processors
Exploring the Future Potential of AI-Enabled Smartphone Processors
 
Biography Of Angeliki Cooney | Senior Vice President Life Sciences | Albany, ...
Biography Of Angeliki Cooney | Senior Vice President Life Sciences | Albany, ...Biography Of Angeliki Cooney | Senior Vice President Life Sciences | Albany, ...
Biography Of Angeliki Cooney | Senior Vice President Life Sciences | Albany, ...
 
2024: Domino Containers - The Next Step. News from the Domino Container commu...
2024: Domino Containers - The Next Step. News from the Domino Container commu...2024: Domino Containers - The Next Step. News from the Domino Container commu...
2024: Domino Containers - The Next Step. News from the Domino Container commu...
 
CNIC Information System with Pakdata Cf In Pakistan
CNIC Information System with Pakdata Cf In PakistanCNIC Information System with Pakdata Cf In Pakistan
CNIC Information System with Pakdata Cf In Pakistan
 
DBX First Quarter 2024 Investor Presentation
DBX First Quarter 2024 Investor PresentationDBX First Quarter 2024 Investor Presentation
DBX First Quarter 2024 Investor Presentation
 
EMPOWERMENT TECHNOLOGY GRADE 11 QUARTER 2 REVIEWER
EMPOWERMENT TECHNOLOGY GRADE 11 QUARTER 2 REVIEWEREMPOWERMENT TECHNOLOGY GRADE 11 QUARTER 2 REVIEWER
EMPOWERMENT TECHNOLOGY GRADE 11 QUARTER 2 REVIEWER
 
Apidays New York 2024 - Passkeys: Developing APIs to enable passwordless auth...
Apidays New York 2024 - Passkeys: Developing APIs to enable passwordless auth...Apidays New York 2024 - Passkeys: Developing APIs to enable passwordless auth...
Apidays New York 2024 - Passkeys: Developing APIs to enable passwordless auth...
 
+971581248768>> SAFE AND ORIGINAL ABORTION PILLS FOR SALE IN DUBAI AND ABUDHA...
+971581248768>> SAFE AND ORIGINAL ABORTION PILLS FOR SALE IN DUBAI AND ABUDHA...+971581248768>> SAFE AND ORIGINAL ABORTION PILLS FOR SALE IN DUBAI AND ABUDHA...
+971581248768>> SAFE AND ORIGINAL ABORTION PILLS FOR SALE IN DUBAI AND ABUDHA...
 
Why Teams call analytics are critical to your entire business
Why Teams call analytics are critical to your entire businessWhy Teams call analytics are critical to your entire business
Why Teams call analytics are critical to your entire business
 
presentation ICT roal in 21st century education
presentation ICT roal in 21st century educationpresentation ICT roal in 21st century education
presentation ICT roal in 21st century education
 

Book buyer network

  • 1. Books on Politics Network- 2004
  • 2. Objective: To analyse a graphical representation of a network Coral reef food web, Cuba 233 vertices 3,753 edges Data: http://datadryad.org/resource/doi:10.5061/dryad.c213h
  • 3. Objective: To analyse a graphical representation of a network CMT111 Students, Cardiff 26 vertices 30 edges
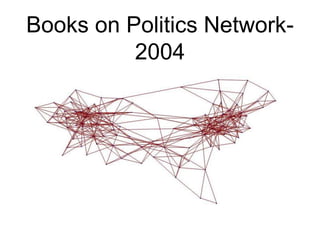
  • 4. Objective: To analyse a graphical representation of a network Purchase of political books, USA 105 vertices 441 edges Data courtesy of Valdis Kreb available at: http://www-personal.umich.edu/~mejn/netdata/
  • 5. Limitations • Data limited: Number of purchases missing from database, date of purchase, buyer data e.g.way voted • No weights : Number of buyers who purchased both books • Mathematica’s definitions (hubs, k-cliques)
  • 6. Mathematica • Importing data • Will not read as wide a variety of CSV formats as Gephi • Can read .gml, .gv, .dot, .graphml, .gxl, .col, .g6, .s6, .gw, .net, .tgf • Use Map or create a rule to show links (->) from one column of a CSV onto another • Other attributes • More difficult to show vertex/edge attributes than in Gephi but still ppssiblt to highlight using HighlightGraph[g, x] • Built-in functions • Very intuitive and well documented: https://reference.wolfram.com/language/guide/GraphsAndNetworks.html
  • 7. Book frequent purchase of both books (endpoints) - from Amazon ‘people who bought this also bought’ NODE LINK
  • 8. This graph is unweighted: edges do not have associated weights undirected: all edges travel in both directions contains loops: no vertex is linked directly to itself simple: undirected, unweighted, loop-free and lacks multiple edges incomplete: each vertex is not connected to every other vertex cyclic: contains at least one cycle not bipartite: vertices cannot be divided into two disjoint sets UndirectedGraphQ[books] WeightedGraphQ[books] CompleteGraphQ[books] SimpleGraphQ[books] BipartiteGraphQ[books] LoopFreeGraphQ[books] AcyclicGraphQ[books]
  • 9. {6, 4, 4, 23, 8, 7, 11, 8, 25, 16, 15, 18, 25, 13, 9, 5, 3, 5, 3, 5, 10, 5, 7, 9, 9, 5, 9, 9, 3, 4, 20, 11, 5, 9, 5, 10, 5, 7, 7, 8, 18, 8, 6, 5, 5, 6, 4, 18, 4, 8, 3, 6, 5, 5, 6, 4, 4, 5, 13, 5, 6, 4, 6, 4, 9, 7, 21, 6, 4, 5, 7, 15, 22, 21, 16, 16, 13, 7, 5, 8, 4, 4, 9, 8, 23, 5, 14, 5, 5, 6, 5, 8, 3, 7, 7, 4, 6, 6, 5, 12, 12, 5, 4, 2, 3} VertexDegree[books] Vertex degrees: Histogram[VertexDegree[books], ChartStyle -> Blue, AxesLabel -> {HoldForm[Vertex degree], HoldForm[Frequency]}, PlotLabel -> None, LabelStyle -> {14, GrayLevel[0]}]
  • 11. Array plot: distance matrix ArrayPlot[GraphDistanceMatrix[books]]
  • 12. Max[Flatten[GraphDistanceMatrix[books]]] OR GraphDiameter[books] Diameter = 7 Radius = 4 GraphRadius[books] Maximum and minimum eccentricities of any vertex:
  • 13. Eccentricity Centrality HighlightGraph[books, VertexList[books], VertexSize -> Thread[VertexList[books] -> Rescale[EccentricityCentrality[books]]]] Increases as maximum distances to every other reachable node increases
  • 14. Closeness Centrality HighlightGraph[books, VertexList[books], VertexSize -> Thread[VertexList[books] -> Rescale[ClosenessCentrality[books]]]] Increases as average distance to other nodes increases
  • 15. Betweenness Centrality HighlightGraph[books, VertexList[books], VertexSize -> Thread[VertexList[books] -> Rescale[BetweennessCentrality[books]]]] Increases as node lies on more shortest paths between other node-pairs
  • 16. Degree Centrality HighlightGraph[books, VertexList[books], VertexSize -> Thread[VertexList[books] -> Rescale[DegreeCentrality[books]]]] Increases as vertex degree increases
  • 17. a = ListPlot[EccentricityCentrality[books], Filling -> Axis, PlotStyle -> Red] b = ListPlot[ClosenessCentrality[books], Filling -> Axis, PlotStyle -> Magenta] c = ListPlot[RadialityCentrality[books], Filling -> Axis, PlotStyle -> Cyan] d = ListPlot[DegreeCentrality[books], Filling -> Axis] gg = GraphicsGrid[{{a, b}, {c, d}}] Export["CentralityGrid.png", gg] Eccentricity Closeness Radiality Degree
  • 18. Dual Hub HighlightGraph[books, GraphHub[books]] Nodes with the highest vertex degree are returned
  • 21. Graph partition: minimises number of endpoints having edges in each part HighlightGraph[books,FindGraphPartition[books]]
  • 22. Graph communities: maximises edges joining nodes within communities with relatively fewer edges joining to nodes in other communities HighlightGraph[books, FindGraphCommunities[books]]
  • 23. Centrality - showing bifurcation partitioning based on edge centrality CommunityGraphPlot[books, FindGraphCommunities[books, Method -> "Centrality"]]
  • 24. ation - “Uncovering the overlapping community structure of comple Finds largest k- cliques first then reduces k CommunityGraphPlot[books, FindGraphCommunities[books, Method -> "CliquePercolation"]] [1] Palla et al., Nature 435, 814-818 (2005)
  • 25. Cliques Largest set of connected vertices HighlightGraph[books, Subgraph[books, FindClique[books]]]
  • 26. Cliques Largest set of connected vertices within 2 edges of each other HighlightGraph[books, Subgraph[books, FindKClique[books, 2]]]
  • 27. Cliques Largest set of connected vertices within 3 edges of each other HighlightGraph[books, Subgraph[books, FindKClique[books, 3]]]
  • 28. Cliques Largest set of connected vertices within 4 edges of each other HighlightGraph[books, Subgraph[books, FindKClique[books, 4]]]
  • 29. Cliques Largest set of connected vertices within 5 edges of each other HighlightGraph[books, Subgraph[books, FindKClique[books, 5]]]
  • 30. Cliques Largest set of connected vertices within 6 edges of each other HighlightGraph[books, Subgraph[books, FindKClique[books, 6]]]
  • 31. Cliques Largest set of connected vertices within 7 (=diameter) edges of each other HighlightGraph[books, Subgraph[books, FindKClique[books, 7]]]
  • 32. Lessons & Conclusions • Mathematica Vs Gephi on Data Visualization • Gephi struggles with larger datasets, crashes on OS X, cannot ‘undo’ • Gephi good a pulling apart larger datasets for easier visualisation, takes a wider range of input formats, can visualise ‘multiple graphs’ more easily • All the other functions within Mathematica at your disposal to aid network analysis e.g. Plot • Source of Data Sets • Working with a dataset of sufficient size but not so big that it cannot be comprehended. • Analysis of sub-networks