SlideShare a Scribd company logo
1 of 18
Midlatitude Cyclones
http://www.physicalgeography.net/fundamentals/7s.html
The Midlatitude Cyclone
• The midlatitude
cyclone is the most
important storm of the
midlatitudes.
• At the heart of the
midlatitude cyclone is
an area of low
pressure as much as
1000 miles (1600 KM)
across.
http://ww2010.atmos.uiuc.edu/(Gh)/guides/mtr/prs/lwprs/def.rxml
The Midlatitude Cyclone
• The low pressure cell
produces converging
counterclockwise wind
flow that pulls together two
unlike air masses.
• Relatively cool air from the
high latitudes is brought
together with relatively
warm air from the
subtropics.
• These unlike air masses
do not mix readily.
– Instead, abrupt transition
zones known as fronts
develop between air
masses.
http://www.physicalgeography.net/fundamentals/7s.html
The Midlatitude Cyclone
• At the surface, a
mature midlatitude
cyclone has a cool
sector and a warm
sector, separated by a
cold front and a warm
front.
– A cold front is cold air
advancing under warm
air.
– A warm front is warm
air advancing over cold
air.
http://www.physicalgeography.net/fundamentals/7s.html
The Midlatitude Cyclone
• Figure one in the lab book shows a typical well developed midlatitude cyclone in the
Northern Hemisphere mapped with isobars.
• The lowest pressure is at the heart of the storm, but a trough of low pressure extends
down the length of the cold front as well.
• As the whole storm migrates eastward in the flow of westerlies, air converges
counterclockwise into the low.
• The cold front typically advances faster than the storm itself and eventually catches
up with the warm front.
– Figure 1b shows a cross section of the storm.
http://www.physicalgeography.net/fundamentals/7s.html
The Midlatitude Cyclone
• Figure two in the lab book shows the life cycle of
a midlatitude cyclone, beginning with the early
development of the storm along the polar front,
through maturity, and finally the process of
occlusion, in which the cold front catches up with
the warm front, lifting all of the warm air off the
ground.
• After occlusion, the storm generally begins to
lose strength and die.
http://www.physicalgeography.net/fundamentals/7s.html
Link to animation of midlatitude cyclone
The Midlatitude Cyclone
• The cross sections shown in
Figure 2 help illustrate the
reasons for the weather typically
brought by these storms.
• Generally, the heaviest
precipitation is associated with
the cold front.
• The abrupt uplift of the warm air
along the advancing, steeply
sloping cold front causes the
adiabatic cooling needed to
produce clouds and
precipitation.
• Because of the more gentle
slope of the warm front, this
region of the storm is usually
associated with more
widespread but less intense
precipitation than the cold front.
http://www.geography.hunter.cuny.edu/~tbw/wc.notes/9.weather.patterns/mid_cyclone_stages.htm
http://ww2010.atmos.uiuc.edu/(Gh)/guides/mtr/cyc/def.rxml
Fronts on Weather Maps
• There are four common
kinds of fronts.
• Cold fronts develop where
the cold air is actively
advancing under warm air.
• Warm fronts occur when the
warm air is actively
advancing over cold air.
• Occluded fronts develop
when the cold front catches
up with a warm front.
• Stationary fronts represent
boundaries between unlike
air masses, but neither air
mass is actively advancing.
– Figure 3 shows the
commonly used weather
map symbols for these four
kinds of fronts.
Fronts on Weather Maps
• While it might seem that the most obvious way
to recognize a front would be an abrupt change
in temperature from one weather station to
another, such changes are not always obvious
on weather maps.
• Fronts often represent transition zones that may
be 10 miles (15 KM) or more wide.
• It is quite possible that the spacing of weather
stations is such that a sharp difference in
temperature is not clearly visible on a weather
map.
Fronts on Weather Maps
• Figure 4 in the lab book
shows a section of a
hypothetical weather map in
the Northern Hemisphere
showing isobars, a cold
front, and ten weather
stations.
• The model shows the
temperature, dew point, and
wind direction.
• In the example in the lab
book, the temperature is 40°
F, the dew point is 27° and
the wind is coming from the
northeast at 15 knots.
http://ww2010.atmos.uiuc.edu/(Gh)/guides/mtr/af/frnts/cfrnt/dwp.rxml
Fronts on Weather Maps
• The pattern of dew point temperatures may be
helpful in locating the position of a front.
• Dew points are usually lower in the relatively dry
cold air than in the warm air, and so generally
there is a drop in dew point temperatures across
a front.
Fronts on Weather Maps
• Wind direction is another useful indication of the location of a front.
• Notice in Figure 4 that a wind direction shift is observed from one
side of the front to the other.
• In this example, the wind direction in the cold sector suggests that
the cold air is advancing, and therefore, pushing the position of the
cold front toward the southeast.
• Also notice the “kink” in the isobars at the position of the front.
• A cold front is associated with a trough of low pressure.
• As a cold front passes, the pressure trend changes from falling to
rising.
http://ww2010.atmos.uiuc.edu/(Gh)/guides/mtr/cyc/wnd.rxml
www.atmos.millersville.edu/.../Fronts_Module.htm
Fronts and Wind
Meteograms
• Meteograms are charts that plot changes in a wide range of weather
conditions for a location over a 25-hour period.
• Meteograms may appear in several different formats, but all contain
the same general information.
• Figure 5 is a typical meteogram.
• The top chart shows temperature (TMPF), dew point (DWPF), and
relative humidity (RELH).
• Below the temperature charts, information such as current weather
conditions (WSYM or WX) and wind direction and speed are shown.
• A middle chart shows the elevation of the cloud base and visibility
(VSBY), while precipitation amounts (P061 or PREC) are shown
below.
• In the bottom chart, atmospheric pressure (PMSL) is plotted.
• The date and time of the meteogram is in ZULU or Greenwich
Mean Time.
http://www.atmos.washington.edu/~regulski/descript/gfs_d1_plots/kpae.mg.gif
Meteograms
• Meteograms clearly show changing trends in
weather, such as that associated with the
passing of a midlatitude cyclone.
• For example, in Figure 5, notice the change in
wind direction, the drop in temperature, the
decreasing visibility and lower cloud cover, and
the onset of precipitation associated with the
passing of a front.
• The trough of the front passed through
Boothville, Louisiana, at about 1200Z on
January 9, 2004.

More Related Content

What's hot

Temperate Cyclones
Temperate CyclonesTemperate Cyclones
Temperate CyclonesJohn Lanser
 
Weather And Climate
Weather And ClimateWeather And Climate
Weather And ClimateMrs. Henley
 
ITCZ-1, Climatology Chapter-Climatology Chapter
ITCZ-1, Climatology Chapter-Climatology ChapterITCZ-1, Climatology Chapter-Climatology Chapter
ITCZ-1, Climatology Chapter-Climatology ChapterKaium Chowdhury
 
Types of fog
Types of fogTypes of fog
Types of fogJean_Diaz
 
Air masses and fronts
Air masses and frontsAir masses and fronts
Air masses and frontseudalddiaz
 
Weather fronts
Weather frontsWeather fronts
Weather frontsRyot2012
 
Indian summer monsoon
Indian summer monsoonIndian summer monsoon
Indian summer monsoonsumitvikram
 
Working with climate data
Working with climate dataWorking with climate data
Working with climate dataNAP Events
 
Atmosphere, weather and climate
Atmosphere, weather and climateAtmosphere, weather and climate
Atmosphere, weather and climatekrferraro
 
Physical Geography Lecture 08 - Precipitation, Air Masses, and Storms 110216
Physical Geography Lecture 08 - Precipitation, Air Masses, and Storms 110216Physical Geography Lecture 08 - Precipitation, Air Masses, and Storms 110216
Physical Geography Lecture 08 - Precipitation, Air Masses, and Storms 110216angelaorr
 
El Nino Southern Oscillation
El Nino Southern OscillationEl Nino Southern Oscillation
El Nino Southern OscillationAl-Nure Mubin
 

What's hot (20)

Temperate Cyclones
Temperate CyclonesTemperate Cyclones
Temperate Cyclones
 
Clouds and precipitation
Clouds and precipitationClouds and precipitation
Clouds and precipitation
 
Fronts
FrontsFronts
Fronts
 
Weather and climate
Weather and climateWeather and climate
Weather and climate
 
Weather And Climate
Weather And ClimateWeather And Climate
Weather And Climate
 
ITCZ-1, Climatology Chapter-Climatology Chapter
ITCZ-1, Climatology Chapter-Climatology ChapterITCZ-1, Climatology Chapter-Climatology Chapter
ITCZ-1, Climatology Chapter-Climatology Chapter
 
Types of fog
Types of fogTypes of fog
Types of fog
 
weather and climate
weather and climateweather and climate
weather and climate
 
Wind currents
Wind currentsWind currents
Wind currents
 
Air masses and fronts
Air masses and frontsAir masses and fronts
Air masses and fronts
 
Weather forecasting
Weather forecastingWeather forecasting
Weather forecasting
 
Weather fronts
Weather frontsWeather fronts
Weather fronts
 
Climate data management
Climate data managementClimate data management
Climate data management
 
Indian summer monsoon
Indian summer monsoonIndian summer monsoon
Indian summer monsoon
 
Working with climate data
Working with climate dataWorking with climate data
Working with climate data
 
Atmosphere, weather and climate
Atmosphere, weather and climateAtmosphere, weather and climate
Atmosphere, weather and climate
 
Physical Geography Lecture 08 - Precipitation, Air Masses, and Storms 110216
Physical Geography Lecture 08 - Precipitation, Air Masses, and Storms 110216Physical Geography Lecture 08 - Precipitation, Air Masses, and Storms 110216
Physical Geography Lecture 08 - Precipitation, Air Masses, and Storms 110216
 
Cloud Development & Classification
Cloud Development & ClassificationCloud Development & Classification
Cloud Development & Classification
 
El Nino Southern Oscillation
El Nino Southern OscillationEl Nino Southern Oscillation
El Nino Southern Oscillation
 
Thunderstorms
ThunderstormsThunderstorms
Thunderstorms
 

Viewers also liked

Midlatitude cyclones
Midlatitude cyclonesMidlatitude cyclones
Midlatitude cycloneslschmidt1170
 
Cyclones - Understanding Storm Systems
Cyclones - Understanding Storm SystemsCyclones - Understanding Storm Systems
Cyclones - Understanding Storm SystemsJohn Johnston
 
20130217 midlatitude cyclones
20130217 midlatitude cyclones20130217 midlatitude cyclones
20130217 midlatitude cyclonesStuart Kirkham
 
Midlatitude Cyclone Tracking Spring 2014
Midlatitude Cyclone Tracking Spring 2014Midlatitude Cyclone Tracking Spring 2014
Midlatitude Cyclone Tracking Spring 2014Stuart Kirkham
 
Weather and climate
Weather and climateWeather and climate
Weather and climateAra Lucas
 
Flood Wall Design Proposal
Flood Wall Design ProposalFlood Wall Design Proposal
Flood Wall Design ProposalChristopher Cho
 
Wind And Natural Gas Justin Peters
Wind And Natural Gas Justin PetersWind And Natural Gas Justin Peters
Wind And Natural Gas Justin PetersTrisha Cherveny
 
Midlatitude Cyclone Maps Fall 2013
Midlatitude Cyclone Maps Fall 2013Midlatitude Cyclone Maps Fall 2013
Midlatitude Cyclone Maps Fall 2013Stuart Kirkham
 
Cyclones
CyclonesCyclones
Cyclonesaloksir
 
Global and Local Winds
Global and Local WindsGlobal and Local Winds
Global and Local Windsrebelbrindley
 
Winds and Wind System
Winds and Wind SystemWinds and Wind System
Winds and Wind SystemLen Garcia
 
2nd Standard: Air and Water (Environmental Science, EVS)
2nd Standard: Air and Water (Environmental Science, EVS) 2nd Standard: Air and Water (Environmental Science, EVS)
2nd Standard: Air and Water (Environmental Science, EVS) theeducationdesk
 
vertical axis wind turbine
vertical axis wind turbinevertical axis wind turbine
vertical axis wind turbineiviral1992
 
Wind Power Point Presentation
Wind Power Point PresentationWind Power Point Presentation
Wind Power Point PresentationKurt Kublbeck
 

Viewers also liked (19)

Midlatitude cyclones
Midlatitude cyclonesMidlatitude cyclones
Midlatitude cyclones
 
Cyclones - Understanding Storm Systems
Cyclones - Understanding Storm SystemsCyclones - Understanding Storm Systems
Cyclones - Understanding Storm Systems
 
20130217 midlatitude cyclones
20130217 midlatitude cyclones20130217 midlatitude cyclones
20130217 midlatitude cyclones
 
Fet geography gr 10 12 - web#d070
Fet   geography gr 10 12 - web#d070Fet   geography gr 10 12 - web#d070
Fet geography gr 10 12 - web#d070
 
Midlatitude Cyclone Tracking Spring 2014
Midlatitude Cyclone Tracking Spring 2014Midlatitude Cyclone Tracking Spring 2014
Midlatitude Cyclone Tracking Spring 2014
 
Weather and climate
Weather and climateWeather and climate
Weather and climate
 
Flood Wall Design Proposal
Flood Wall Design ProposalFlood Wall Design Proposal
Flood Wall Design Proposal
 
Levees
LeveesLevees
Levees
 
Wind And Natural Gas Justin Peters
Wind And Natural Gas Justin PetersWind And Natural Gas Justin Peters
Wind And Natural Gas Justin Peters
 
Midlatitude Cyclone Maps Fall 2013
Midlatitude Cyclone Maps Fall 2013Midlatitude Cyclone Maps Fall 2013
Midlatitude Cyclone Maps Fall 2013
 
Cyclones
CyclonesCyclones
Cyclones
 
Global and Local Winds
Global and Local WindsGlobal and Local Winds
Global and Local Winds
 
Wind
WindWind
Wind
 
Winds and Wind System
Winds and Wind SystemWinds and Wind System
Winds and Wind System
 
2nd Standard: Air and Water (Environmental Science, EVS)
2nd Standard: Air and Water (Environmental Science, EVS) 2nd Standard: Air and Water (Environmental Science, EVS)
2nd Standard: Air and Water (Environmental Science, EVS)
 
vertical axis wind turbine
vertical axis wind turbinevertical axis wind turbine
vertical axis wind turbine
 
Cyclone
CycloneCyclone
Cyclone
 
Global and local winds
Global and local windsGlobal and local winds
Global and local winds
 
Wind Power Point Presentation
Wind Power Point PresentationWind Power Point Presentation
Wind Power Point Presentation
 

Similar to Lab eight midlatitude cyclones

Earth surface wind system ppt.
Earth surface wind system ppt.Earth surface wind system ppt.
Earth surface wind system ppt.AnkitAbhilashSwain
 
Global atmospheric and oceanic circulation
Global atmospheric and oceanic circulationGlobal atmospheric and oceanic circulation
Global atmospheric and oceanic circulationMark Andersen
 
Forecasting the weather powerpoint
Forecasting the weather powerpointForecasting the weather powerpoint
Forecasting the weather powerpointkathryngraham
 
Natural Science: Weather and Storms
Natural Science: Weather and StormsNatural Science: Weather and Storms
Natural Science: Weather and StormsShamie Garcia
 
Making the invisible visible
Making the invisible visibleMaking the invisible visible
Making the invisible visibleWania Pereira
 
Clouds, air masses and fronts 6.2
Clouds, air masses and fronts 6.2Clouds, air masses and fronts 6.2
Clouds, air masses and fronts 6.2Kella Randolph
 
Geography Elective/Pure: Weather and climate notes
Geography Elective/Pure: Weather and climate notesGeography Elective/Pure: Weather and climate notes
Geography Elective/Pure: Weather and climate notesDodge Lim
 
General Atmospheric CirculationUnit 6bGeneral Ci
General Atmospheric CirculationUnit 6bGeneral CiGeneral Atmospheric CirculationUnit 6bGeneral Ci
General Atmospheric CirculationUnit 6bGeneral CiMatthewTennant613
 
Synoptic Charts
Synoptic ChartsSynoptic Charts
Synoptic ChartsMr Shipp
 
WATER RESOURCES ENGINEERING MODULE 1 NOTES
WATER RESOURCES ENGINEERING MODULE 1 NOTESWATER RESOURCES ENGINEERING MODULE 1 NOTES
WATER RESOURCES ENGINEERING MODULE 1 NOTESReshmaMRaju
 
Climate & weather T1 GR12.pptx
Climate & weather T1 GR12.pptxClimate & weather T1 GR12.pptx
Climate & weather T1 GR12.pptxCALLYNKINSEY
 

Similar to Lab eight midlatitude cyclones (20)

Capter 5 Climate of Ethiopia and the Horn GeES 1011.pdf
Capter 5 Climate of Ethiopia and the Horn GeES 1011.pdfCapter 5 Climate of Ethiopia and the Horn GeES 1011.pdf
Capter 5 Climate of Ethiopia and the Horn GeES 1011.pdf
 
Earth surface wind system ppt.
Earth surface wind system ppt.Earth surface wind system ppt.
Earth surface wind system ppt.
 
Global atmospheric and oceanic circulation
Global atmospheric and oceanic circulationGlobal atmospheric and oceanic circulation
Global atmospheric and oceanic circulation
 
Forecasting the weather powerpoint
Forecasting the weather powerpointForecasting the weather powerpoint
Forecasting the weather powerpoint
 
Natural Science: Weather and Storms
Natural Science: Weather and StormsNatural Science: Weather and Storms
Natural Science: Weather and Storms
 
Making the invisible visible
Making the invisible visibleMaking the invisible visible
Making the invisible visible
 
2019 tg atmosphere2 atmospheric circulation
2019 tg atmosphere2 atmospheric circulation2019 tg atmosphere2 atmospheric circulation
2019 tg atmosphere2 atmospheric circulation
 
Clouds, air masses and fronts 6.2
Clouds, air masses and fronts 6.2Clouds, air masses and fronts 6.2
Clouds, air masses and fronts 6.2
 
2 W&C OVERVIEW PPT
2 W&C OVERVIEW PPT 2 W&C OVERVIEW PPT
2 W&C OVERVIEW PPT
 
Weather and climate
Weather and climateWeather and climate
Weather and climate
 
Geography Elective/Pure: Weather and climate notes
Geography Elective/Pure: Weather and climate notesGeography Elective/Pure: Weather and climate notes
Geography Elective/Pure: Weather and climate notes
 
Weather and Climate
Weather and Climate Weather and Climate
Weather and Climate
 
Circulation
CirculationCirculation
Circulation
 
Elements of climate and weather
Elements of climate and weatherElements of climate and weather
Elements of climate and weather
 
General Atmospheric CirculationUnit 6bGeneral Ci
General Atmospheric CirculationUnit 6bGeneral CiGeneral Atmospheric CirculationUnit 6bGeneral Ci
General Atmospheric CirculationUnit 6bGeneral Ci
 
Climate
ClimateClimate
Climate
 
Synoptic Charts
Synoptic ChartsSynoptic Charts
Synoptic Charts
 
WATER RESOURCES ENGINEERING MODULE 1 NOTES
WATER RESOURCES ENGINEERING MODULE 1 NOTESWATER RESOURCES ENGINEERING MODULE 1 NOTES
WATER RESOURCES ENGINEERING MODULE 1 NOTES
 
Climate & weather T1 GR12.pptx
Climate & weather T1 GR12.pptxClimate & weather T1 GR12.pptx
Climate & weather T1 GR12.pptx
 
Weather
WeatherWeather
Weather
 

More from Lisa Schmidt

Chapter 1 A World Of Regions
Chapter 1 A World Of RegionsChapter 1 A World Of Regions
Chapter 1 A World Of RegionsLisa Schmidt
 
The giant ancient forest you cannot see coyote crossing
The giant ancient forest you cannot see   coyote crossingThe giant ancient forest you cannot see   coyote crossing
The giant ancient forest you cannot see coyote crossingLisa Schmidt
 
Summer geog lab 2016 schmidt
Summer geog lab 2016 schmidtSummer geog lab 2016 schmidt
Summer geog lab 2016 schmidtLisa Schmidt
 
Summer geog 101 2016 schmidt
Summer geog 101 2016 schmidtSummer geog 101 2016 schmidt
Summer geog 101 2016 schmidtLisa Schmidt
 
Summer 2016 geog 110 schmidt
Summer 2016 geog 110 schmidtSummer 2016 geog 110 schmidt
Summer 2016 geog 110 schmidtLisa Schmidt
 
Daylight saving time may have health costs la times
Daylight saving time may have health costs   la timesDaylight saving time may have health costs   la times
Daylight saving time may have health costs la timesLisa Schmidt
 
Daylight saving time could end in california the sacramento bee
Daylight saving time could end in california   the sacramento beeDaylight saving time could end in california   the sacramento bee
Daylight saving time could end in california the sacramento beeLisa Schmidt
 
Ch 3 worksheet edited
Ch 3 worksheet editedCh 3 worksheet edited
Ch 3 worksheet editedLisa Schmidt
 
Intro spring 2016 geog 101 l
Intro spring 2016 geog 101 lIntro spring 2016 geog 101 l
Intro spring 2016 geog 101 lLisa Schmidt
 
Syllabus geography 102 spring 2016
Syllabus geography 102 spring 2016Syllabus geography 102 spring 2016
Syllabus geography 102 spring 2016Lisa Schmidt
 
Could a great quake strike on the enigmatic san jacinto fault temblor
Could a great quake strike on the enigmatic san jacinto fault    temblorCould a great quake strike on the enigmatic san jacinto fault    temblor
Could a great quake strike on the enigmatic san jacinto fault temblorLisa Schmidt
 
Introspringonlinegeog110 14 wk
Introspringonlinegeog110 14 wkIntrospringonlinegeog110 14 wk
Introspringonlinegeog110 14 wkLisa Schmidt
 
Spring 2016 syllabus geog 110 sect 71
Spring 2016 syllabus geog 110 sect 71Spring 2016 syllabus geog 110 sect 71
Spring 2016 syllabus geog 110 sect 71Lisa Schmidt
 
Spring geog 101 mon 2016 schmid
Spring geog 101 mon 2016 schmidSpring geog 101 mon 2016 schmid
Spring geog 101 mon 2016 schmidLisa Schmidt
 
Geog lab syllabus wed spring 2016
Geog lab syllabus wed spring 2016Geog lab syllabus wed spring 2016
Geog lab syllabus wed spring 2016Lisa Schmidt
 
Will exxon have to pay for years of misleading the public bill moyers
Will exxon have to pay for years of misleading the public    bill moyersWill exxon have to pay for years of misleading the public    bill moyers
Will exxon have to pay for years of misleading the public bill moyersLisa Schmidt
 
Periodic table's 7th row completed with discovery of four new elements ifl ...
Periodic table's 7th row completed with discovery of four new elements   ifl ...Periodic table's 7th row completed with discovery of four new elements   ifl ...
Periodic table's 7th row completed with discovery of four new elements ifl ...Lisa Schmidt
 

More from Lisa Schmidt (20)

Chapter 1 A World Of Regions
Chapter 1 A World Of RegionsChapter 1 A World Of Regions
Chapter 1 A World Of Regions
 
Eastern europe
Eastern europeEastern europe
Eastern europe
 
The giant ancient forest you cannot see coyote crossing
The giant ancient forest you cannot see   coyote crossingThe giant ancient forest you cannot see   coyote crossing
The giant ancient forest you cannot see coyote crossing
 
Summer geog lab 2016 schmidt
Summer geog lab 2016 schmidtSummer geog lab 2016 schmidt
Summer geog lab 2016 schmidt
 
Summer geog 101 2016 schmidt
Summer geog 101 2016 schmidtSummer geog 101 2016 schmidt
Summer geog 101 2016 schmidt
 
Summer 2016 geog 110 schmidt
Summer 2016 geog 110 schmidtSummer 2016 geog 110 schmidt
Summer 2016 geog 110 schmidt
 
Daylight saving time may have health costs la times
Daylight saving time may have health costs   la timesDaylight saving time may have health costs   la times
Daylight saving time may have health costs la times
 
Daylight saving time could end in california the sacramento bee
Daylight saving time could end in california   the sacramento beeDaylight saving time could end in california   the sacramento bee
Daylight saving time could end in california the sacramento bee
 
Ch 3 worksheet edited
Ch 3 worksheet editedCh 3 worksheet edited
Ch 3 worksheet edited
 
Intro spring 2016
Intro spring 2016Intro spring 2016
Intro spring 2016
 
Intro spring 2016 geog 101 l
Intro spring 2016 geog 101 lIntro spring 2016 geog 101 l
Intro spring 2016 geog 101 l
 
Syllabus geography 102 spring 2016
Syllabus geography 102 spring 2016Syllabus geography 102 spring 2016
Syllabus geography 102 spring 2016
 
Could a great quake strike on the enigmatic san jacinto fault temblor
Could a great quake strike on the enigmatic san jacinto fault    temblorCould a great quake strike on the enigmatic san jacinto fault    temblor
Could a great quake strike on the enigmatic san jacinto fault temblor
 
Introspringonlinegeog110 14 wk
Introspringonlinegeog110 14 wkIntrospringonlinegeog110 14 wk
Introspringonlinegeog110 14 wk
 
Spring 2016 syllabus geog 110 sect 71
Spring 2016 syllabus geog 110 sect 71Spring 2016 syllabus geog 110 sect 71
Spring 2016 syllabus geog 110 sect 71
 
Spring geog 101 mon 2016 schmid
Spring geog 101 mon 2016 schmidSpring geog 101 mon 2016 schmid
Spring geog 101 mon 2016 schmid
 
Geog lab syllabus wed spring 2016
Geog lab syllabus wed spring 2016Geog lab syllabus wed spring 2016
Geog lab syllabus wed spring 2016
 
Will exxon have to pay for years of misleading the public bill moyers
Will exxon have to pay for years of misleading the public    bill moyersWill exxon have to pay for years of misleading the public    bill moyers
Will exxon have to pay for years of misleading the public bill moyers
 
Periodic table's 7th row completed with discovery of four new elements ifl ...
Periodic table's 7th row completed with discovery of four new elements   ifl ...Periodic table's 7th row completed with discovery of four new elements   ifl ...
Periodic table's 7th row completed with discovery of four new elements ifl ...
 
Geography basics
Geography basicsGeography basics
Geography basics
 

Lab eight midlatitude cyclones

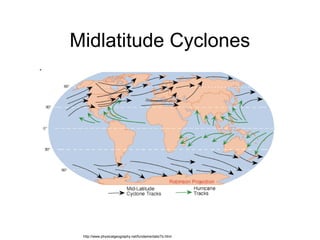
  • 2. The Midlatitude Cyclone • The midlatitude cyclone is the most important storm of the midlatitudes. • At the heart of the midlatitude cyclone is an area of low pressure as much as 1000 miles (1600 KM) across. http://ww2010.atmos.uiuc.edu/(Gh)/guides/mtr/prs/lwprs/def.rxml
  • 3. The Midlatitude Cyclone • The low pressure cell produces converging counterclockwise wind flow that pulls together two unlike air masses. • Relatively cool air from the high latitudes is brought together with relatively warm air from the subtropics. • These unlike air masses do not mix readily. – Instead, abrupt transition zones known as fronts develop between air masses. http://www.physicalgeography.net/fundamentals/7s.html
  • 4. The Midlatitude Cyclone • At the surface, a mature midlatitude cyclone has a cool sector and a warm sector, separated by a cold front and a warm front. – A cold front is cold air advancing under warm air. – A warm front is warm air advancing over cold air. http://www.physicalgeography.net/fundamentals/7s.html
  • 5. The Midlatitude Cyclone • Figure one in the lab book shows a typical well developed midlatitude cyclone in the Northern Hemisphere mapped with isobars. • The lowest pressure is at the heart of the storm, but a trough of low pressure extends down the length of the cold front as well. • As the whole storm migrates eastward in the flow of westerlies, air converges counterclockwise into the low. • The cold front typically advances faster than the storm itself and eventually catches up with the warm front. – Figure 1b shows a cross section of the storm. http://www.physicalgeography.net/fundamentals/7s.html
  • 6. The Midlatitude Cyclone • Figure two in the lab book shows the life cycle of a midlatitude cyclone, beginning with the early development of the storm along the polar front, through maturity, and finally the process of occlusion, in which the cold front catches up with the warm front, lifting all of the warm air off the ground. • After occlusion, the storm generally begins to lose strength and die. http://www.physicalgeography.net/fundamentals/7s.html Link to animation of midlatitude cyclone
  • 7. The Midlatitude Cyclone • The cross sections shown in Figure 2 help illustrate the reasons for the weather typically brought by these storms. • Generally, the heaviest precipitation is associated with the cold front. • The abrupt uplift of the warm air along the advancing, steeply sloping cold front causes the adiabatic cooling needed to produce clouds and precipitation. • Because of the more gentle slope of the warm front, this region of the storm is usually associated with more widespread but less intense precipitation than the cold front. http://www.geography.hunter.cuny.edu/~tbw/wc.notes/9.weather.patterns/mid_cyclone_stages.htm
  • 9. Fronts on Weather Maps • There are four common kinds of fronts. • Cold fronts develop where the cold air is actively advancing under warm air. • Warm fronts occur when the warm air is actively advancing over cold air. • Occluded fronts develop when the cold front catches up with a warm front. • Stationary fronts represent boundaries between unlike air masses, but neither air mass is actively advancing. – Figure 3 shows the commonly used weather map symbols for these four kinds of fronts.
  • 10. Fronts on Weather Maps • While it might seem that the most obvious way to recognize a front would be an abrupt change in temperature from one weather station to another, such changes are not always obvious on weather maps. • Fronts often represent transition zones that may be 10 miles (15 KM) or more wide. • It is quite possible that the spacing of weather stations is such that a sharp difference in temperature is not clearly visible on a weather map.
  • 11. Fronts on Weather Maps • Figure 4 in the lab book shows a section of a hypothetical weather map in the Northern Hemisphere showing isobars, a cold front, and ten weather stations. • The model shows the temperature, dew point, and wind direction. • In the example in the lab book, the temperature is 40° F, the dew point is 27° and the wind is coming from the northeast at 15 knots. http://ww2010.atmos.uiuc.edu/(Gh)/guides/mtr/af/frnts/cfrnt/dwp.rxml
  • 12. Fronts on Weather Maps • The pattern of dew point temperatures may be helpful in locating the position of a front. • Dew points are usually lower in the relatively dry cold air than in the warm air, and so generally there is a drop in dew point temperatures across a front.
  • 13. Fronts on Weather Maps • Wind direction is another useful indication of the location of a front. • Notice in Figure 4 that a wind direction shift is observed from one side of the front to the other. • In this example, the wind direction in the cold sector suggests that the cold air is advancing, and therefore, pushing the position of the cold front toward the southeast. • Also notice the “kink” in the isobars at the position of the front. • A cold front is associated with a trough of low pressure. • As a cold front passes, the pressure trend changes from falling to rising.
  • 16. Meteograms • Meteograms are charts that plot changes in a wide range of weather conditions for a location over a 25-hour period. • Meteograms may appear in several different formats, but all contain the same general information. • Figure 5 is a typical meteogram. • The top chart shows temperature (TMPF), dew point (DWPF), and relative humidity (RELH). • Below the temperature charts, information such as current weather conditions (WSYM or WX) and wind direction and speed are shown. • A middle chart shows the elevation of the cloud base and visibility (VSBY), while precipitation amounts (P061 or PREC) are shown below. • In the bottom chart, atmospheric pressure (PMSL) is plotted. • The date and time of the meteogram is in ZULU or Greenwich Mean Time.
  • 18. Meteograms • Meteograms clearly show changing trends in weather, such as that associated with the passing of a midlatitude cyclone. • For example, in Figure 5, notice the change in wind direction, the drop in temperature, the decreasing visibility and lower cloud cover, and the onset of precipitation associated with the passing of a front. • The trough of the front passed through Boothville, Louisiana, at about 1200Z on January 9, 2004.