Buy Maruti Suzuki for a target of Rs2,050 - Prabhudas Lilladher
•
0 likes•159 views

Given the last three years of flat volumes in the Passenger Car segment (expected latent demand) and new launches, we expect volumes to grow at 12% CAGR over FY14-FY16E period. MSIL has gained market share to the tune of 220bps in the small car segment.

Recommended
Recommended
More Related Content
More from IndiaNotes.com
More from IndiaNotes.com (20)
Recently uploaded
Recently uploaded (20)
Buy Maruti Suzuki for a target of Rs2,050 - Prabhudas Lilladher
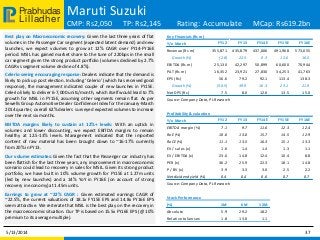
- 1. Lilladher Prabhudas Maruti Suzuki CMP: Rs2,050 TP: Rs2,145 Rating: Accumulate MCap: Rs619.2bn Best play on Macroeconomic recovery: Given the last three years of flat volumes in the Passenger Car segment (expected latent demand) and new launches, we expect volumes to grow at 12% CAGR over FY14-FY16E period. MSIL has gained market share to the tune of 220bps in the small car segment given the strong product portfolio (volumes declined by 2.7% CAGR vs segment volume decline of 4.8%). Celerio seeing encouraging response: Dealers indicate that the demand is likely to pick up post election. Including ‘Celerio’ (which has received good response), the management indicated couple of new launches in FY15E. Celerio likely to deliver 6-7,000 units/month, which itself would lead to 7% growth for MSIL in FY15E, assuming other segments remain flat. As per Sewells Group Automotive Dealer Confidence Index for the January-March 2014 quarter, overall 62% dealers surveyed expected volumes to increase over the next six months. EBITDA margins likely to sustain at 12%+ levels: With an uptick in volumes and lower discounting, we expect EBITDA margins to remain healthy at 12.5-13% levels. Management indicated that the imported content of raw material has been brought down to ~16-17% currently from 20% in FY13. Our volume estimates: Given the fact that the Passenger car industry has been flattish for the last three years, any improvement in macroeconomic scenario could lead to recovery in sales for MSIL. Given its strong product portfolio, we have built in 10% volume growth for FY15E at 1.27m units (led by new launches) and a 14% YoY in FY16E (on account of strong recovery in economy) at 1.45m units. Earnings to grow at ~22% CAGR : Given estimated earnings CAGR of ~22.5%, the current valuations of 18.1x FY15E EPS and 14.8x FY16E EPS seem attractive. We reiterate that MSIL is the best play on the recovery in the macroeconomic situation. Our TP is based on 15.5x FY16E EPS (@ 10% premium to its average multiple). 5/13/2014 37 Key Financials (Rs m) Y/e March FY12 FY13 FY14E FY15E FY16E Revenue (Rs m) 355,871 435,879 437,006 491,968 573,055 Growth (%) (2.8) 22.5 0.3 12.6 16.5 EBITDA (Rs m) 25,130 42,297 50,899 60,600 70,944 PAT (Rs m) 16,352 23,921 27,830 34,253 41,763 EPS (Rs) 56.6 79.2 92.1 113.4 138.3 Growth (%) (30.5) 39.9 16.3 23.1 21.9 Net DPS (Rs) 7.5 8.0 12.0 13.5 15.0 Source: Company Data, PL Research Profitability & valuation Y/e March FY12 FY13 FY14E FY15E FY16E EBITDA margin (%) 7.1 9.7 11.6 12.3 12.4 RoE (%) 10.6 13.0 15.7 14.5 12.9 RoCE (%) 11.1 13.5 16.3 15.1 13.3 EV / sales (x) 1.6 1.4 1.4 1.3 1.1 EV / EBITDA (x) 23.0 14.8 12.4 10.4 8.8 PER (x) 36.2 25.9 22.3 18.1 14.8 P / BV (x) 3.9 3.3 3.0 2.5 2.2 Net dividend yield (%) 0.4 0.4 0.6 0.7 0.7 Source: Company Data, PL Research Stock Performance (%) 1M 6M 12M Absolute 5.9 29.2 18.2 Relative to Sensex 1.8 13.0 1.1
- 2. Lilladher Prabhudas Operating Metrics Maruti Suzuki 5/13/2014 38 Y/e March FY10 FY11 FY12 FY13 FY14E FY15E FY16E A2 segment volumes (nos) 633,190 808,552 709,430 673,009 678,240 763,020 854,582 A3 segment volumes (nos) 99,315 131,410 128,587 176,467 201,715 193,646 222,693 Domestic Volumes (nos) 870,790 1,132,739 1,006,316 1,051,047 1,054,072 1,147,866 1,313,785 Export Volumes (nos) 147,575 138,266 127,379 120,388 99,816 125,000 140,000 Volumes (nos) 1,018,365 1,271,005 1,133,695 1,171,435 1,153,888 1,272,866 1,453,785 Growth (%) 28.6 24.8 (10.8) 3.3 (1.5) 10.3 14.2 Av. Real. / Veh. (Rs) 290,887 288,106 313,904 367,909 380,133 384,502 392,309 Growth (%) 10.5 (1.0) 9.0 17.2 3.3 1.1 2.0 RM cost / veh. (Rs) 220,092 222,959 247,559 286,508 271,340 274,124 280,909 Growth (%) 7.3 1.3 11.0 15.7 (5.3) 1.0 2.5 Contr. / Veh. (Rs) 70,795 65,147 66,345 81,402 108,793 110,378 111,400 Selling expenses (Rs mn) 9,160 11,029 10,136 11,823 13,894 15,947 18,401 Selling exp. / Veh. (Rs) 8,995 8,677 8,941 10,093 12,041 12,528 12,657 Growth (%) (3.5) (3.5) 3.0 12.9 19.3 4.0 1.0 Other exp. / Veh. (Rs) 26,393 30,472 36,736 42,635 51,418 51,898 51,675 Growth (%) (3.8) 15.5 20.6 16.1 20.6 0.9 (0.4) EBITDA / Veh. (Rs) 39,044 29,140 22,166 30,368 46,075 44,428 39,360 Growth (%) (4.4) (25.4) (23.9) 37.0 51.7 (3.6) (11.4) Net Profit / Veh. (Rs) 24,526 18,006 14,195 19,634 28,766 27,598 23,996 Source: Company Data, PL Research
- 3. Lilladher Prabhudas Financials Maruti Suzuki 5/13/2014 39 Income Statement (Rs m) Y/e March FY12 FY13 FY14E FY15E FY16E Net Revenue 355,871 435,879 437,006 491,968 573,055 Direct Expenses 280,656 325,149 313,096 348,923 408,381 % of Net Sales 78.9 74.6 71.6 70.9 71.3 Employee Cost 8,438 10,696 13,681 16,386 18,606 % of Net Sales 2.4 2.5 3.1 3.3 3.2 SG&A Expenses - - - - - % of Net Sales 0.0 0.0 0.0 0.0 0.0 Other Expenses 41,647 57,738 59,330 66,060 75,124 % of Net Sales 11.7 13.2 13.6 13.4 13.1 EBITDA 25,130 42,297 50,899 60,600 70,944 Margin (%) 7.1 9.7 11.6 12.3 12.4 Depreciation 11,384 18,612 20,844 23,243 25,491 PBIT 13,746 23,685 30,055 37,356 45,452 Interest Expenses 552 1,898 1,759 1,735 1,800 PBT 21,203 29,910 36,585 45,070 54,952 Total tax 5,111 5,989 8,755 10,817 13,188 Effective Tax rate (%) 24.1 20.0 23.9 24.0 24.0 PAT 16,092 23,921 27,830 34,253 41,763 Extraordinary Gain/(Loss) (260) - - - - Adjusted PAT 16,352 23,921 27,830 34,253 41,763 Source: Company Data, PL Research Balance Sheet (Rs m) Y/e March FY12 FY13 FY14E FY15E FY16E Share Capital 1,445 1,510 1,510 1,510 1,510 Reserves & Surplus 150,429 184,279 208,270 248,055 278,807 Shareholder's Fund 151,874 185,790 209,781 249,566 280,318 Preference Share Capital - - - - - Total Debt 10,784 13,892 16,851 17,151 17,451 Other Liabilities(net) 2,648 2,364 - - - Deferred Tax Liability 3,023 4,087 5,866 5,866 5,866 Total Liabilities 168,329 206,133 232,497 272,582 303,635 Gross Block 147,347 198,007 237,429 274,433 311,887 Less: Depreciation 72,140 100,015 115,315 132,844 152,164 Net Block 75,207 97,992 122,114 141,589 159,723 Capital Work in Progress 9,419 19,422 12,004 12,454 12,904 Cash & Cash Equivalent 86,096 73,656 107,476 124,811 151,398 Total Current Assets 76,659 74,692 67,674 74,835 86,684 Total Current Liabilities 54,691 51,880 70,473 74,402 96,918 Net Current Assets 21,968 22,812 (2,799) 433 (10,234) Other Assets - - - - - Total Assets 168,329 206,133 232,498 272,582 303,635 Source: Company Data, PL Research
- 4. Lilladher Prabhudas Disclaimer 5/13/2014 80 BUY : Over 15% Outperformance to Sensex over 12-months Accumulate : Outperformance to Sensex over 12-months Reduce : Underperformance to Sensex over 12-months Sell : Over 15% underperformance to Sensex over 12-months Trading Buy : Over 10% absolute upside in 1-month Trading Sell : Over 10% absolute decline in 1-month Not Rated (NR) : No specific call on the stock Under Review (UR) : Rating likely to change shortly This document has been prepared by the Research Division of Prabhudas Lilladher Pvt. Ltd. Mumbai, India (PL) and is meant for use by the recipient only as information and is not for circulation. This document is not to be reported or copied or made available to others without prior permission of PL. It should not be considered or taken as an offer to sell or a solicitation to buy or sell any security. The information contained in this report has been obtained from sources that are considered to be reliable. However, PL has not independently verified the accuracy or completeness of the same. Neither PL nor any of its affiliates, its directors or its employees accept any responsibility of whatsoever nature for the information, statements and opinion given, made available or expressed herein or for any omission therein. Recipients of this report should be aware that past performance is not necessarily a guide to future performance and value of investments can go down as well. The suitability or otherwise of any investments will depend upon the recipient's particular circumstances and, in case of doubt, advice should be sought from an independent expert/advisor. Either PL or its affiliates or its directors or its employees or its representatives or its clients or their relatives may have position(s), make market, act as principal or engage in transactions of securities of companies referred to in this report and they may have used the research material prior to publication. We may from time to time solicit or perform investment banking or other services for any company mentioned in this document. Prabhudas Lilladher Pvt. Ltd. 3rd Floor, Sadhana House, 570, P. B. Marg, Worli, Mumbai 400 018, India. Tel: (91 22) 6632 2222 Fax: (91 22) 6632 2209 PL’s Recommendation Nomenclature Rating Distribution of Research Coverage 27.2% 51.5% 21.4% 0.0% 0% 10% 20% 30% 40% 50% 60% BUY Accumulate Reduce Sell %ofTotalCoverage