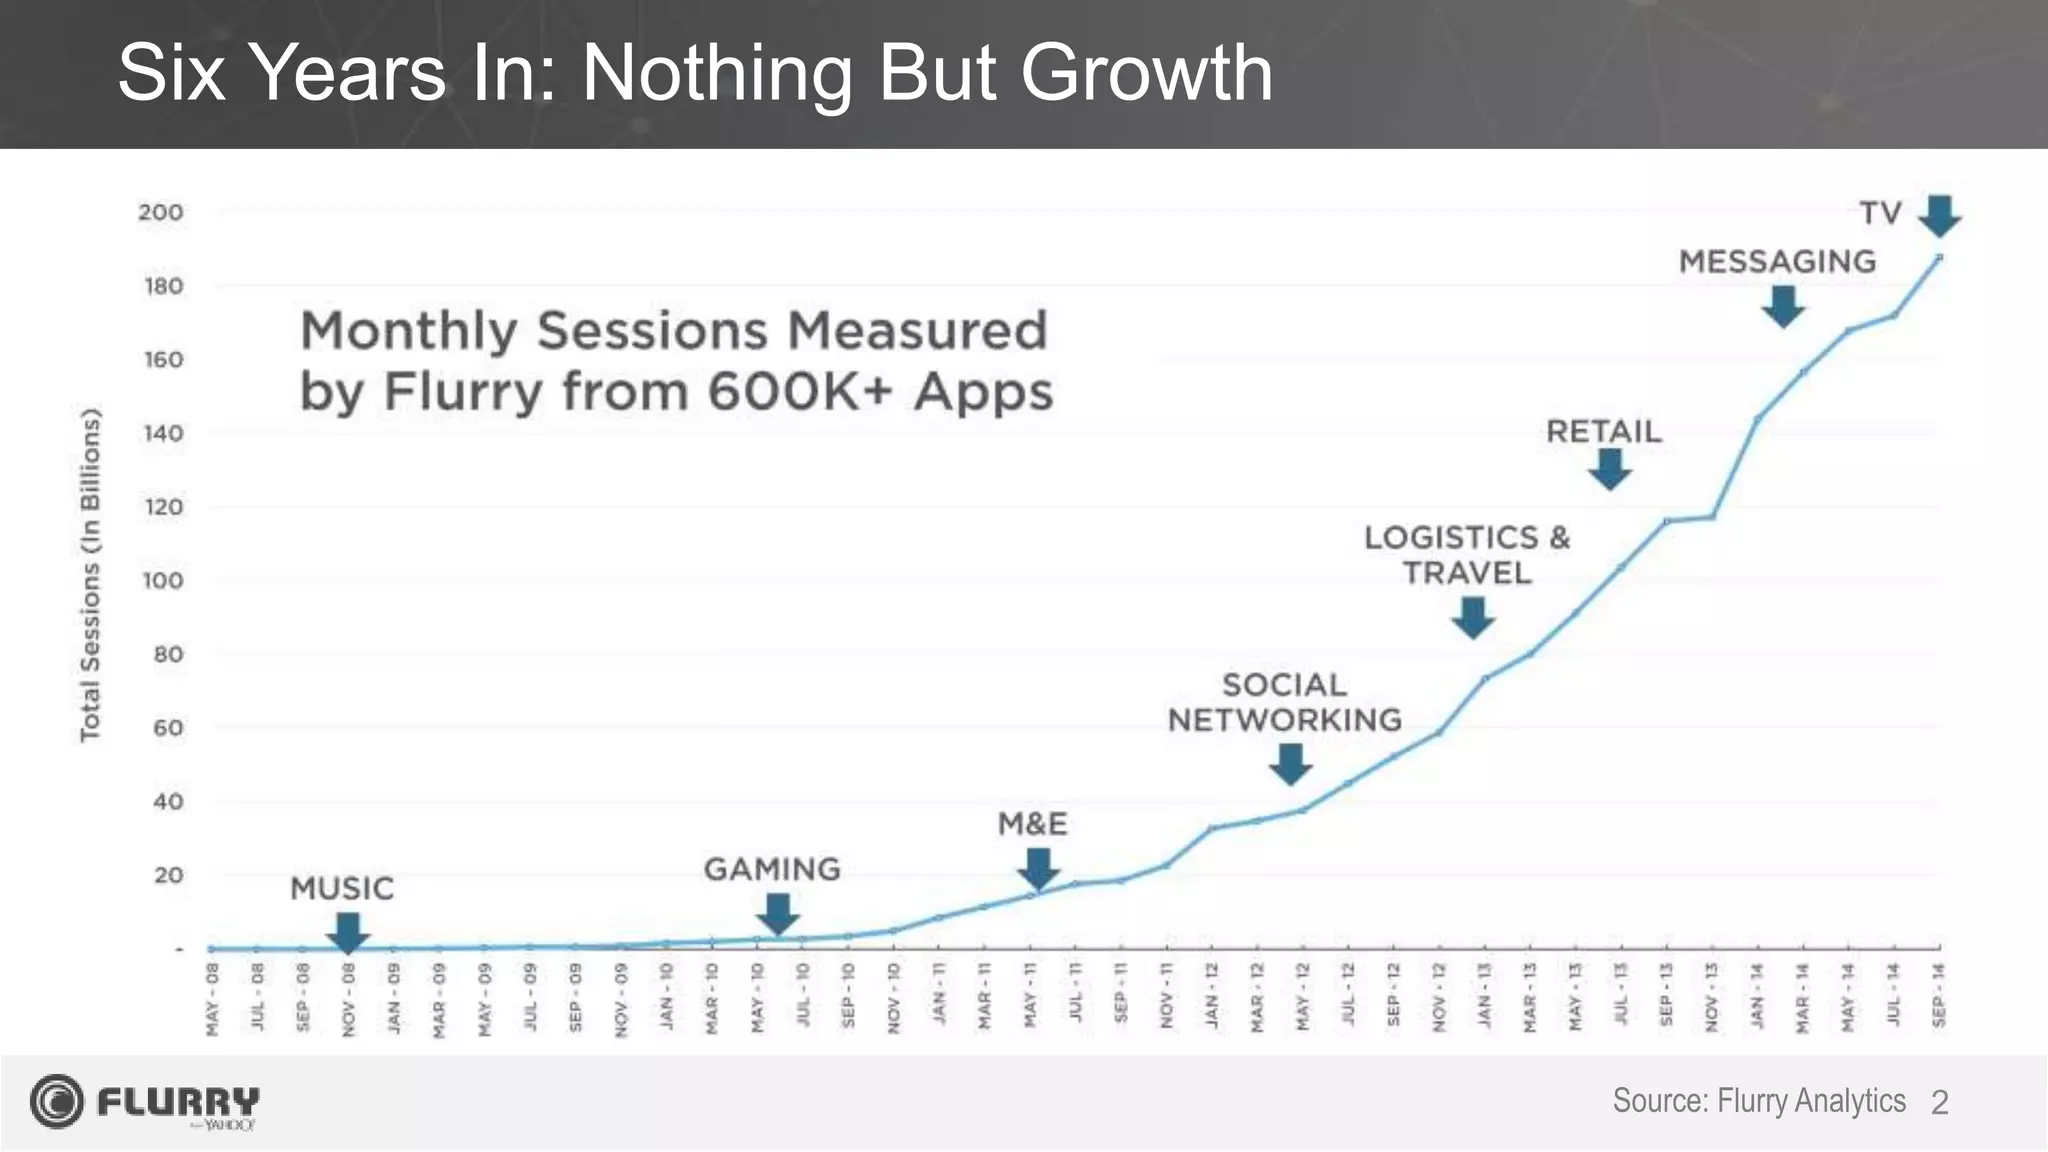
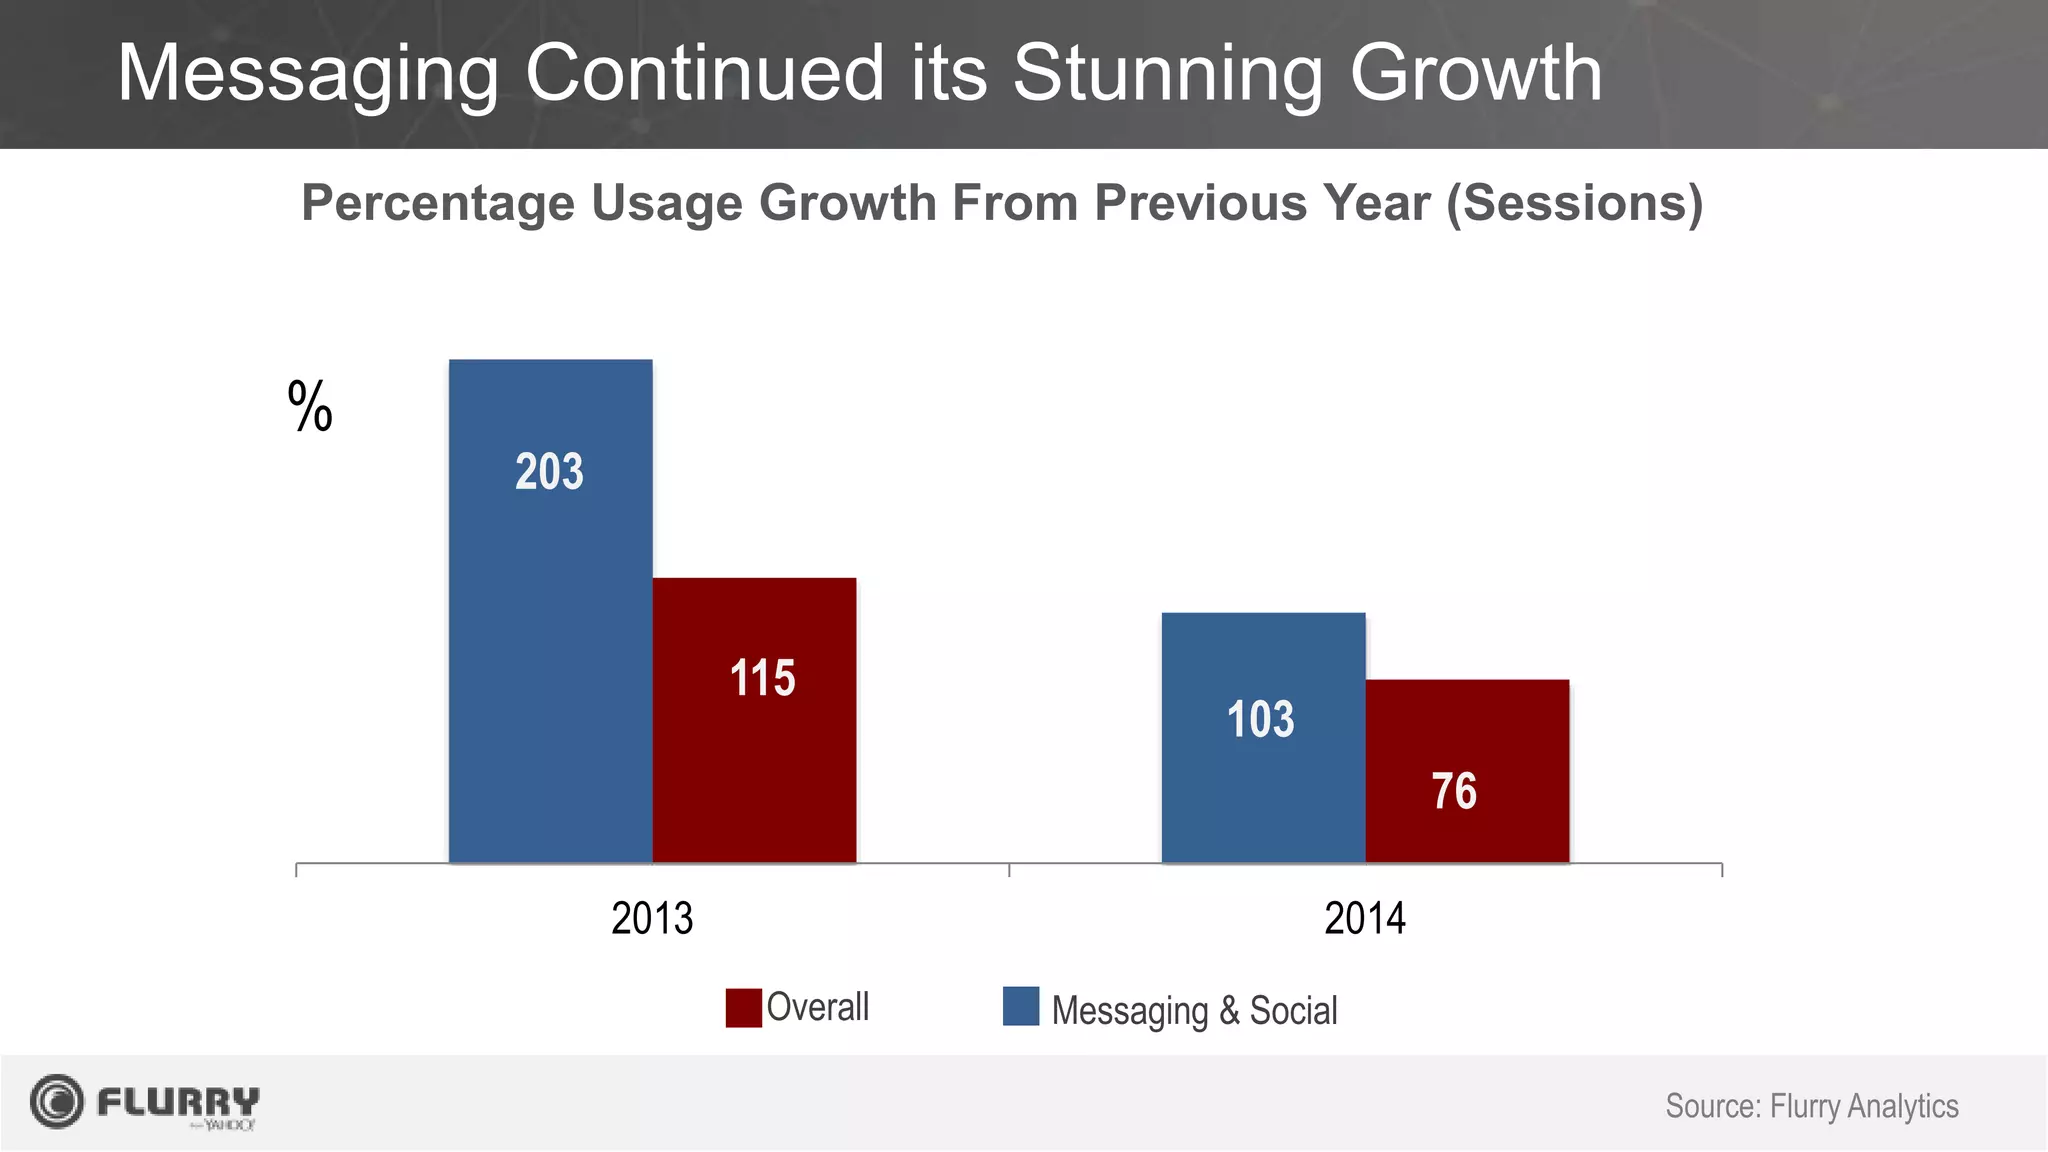
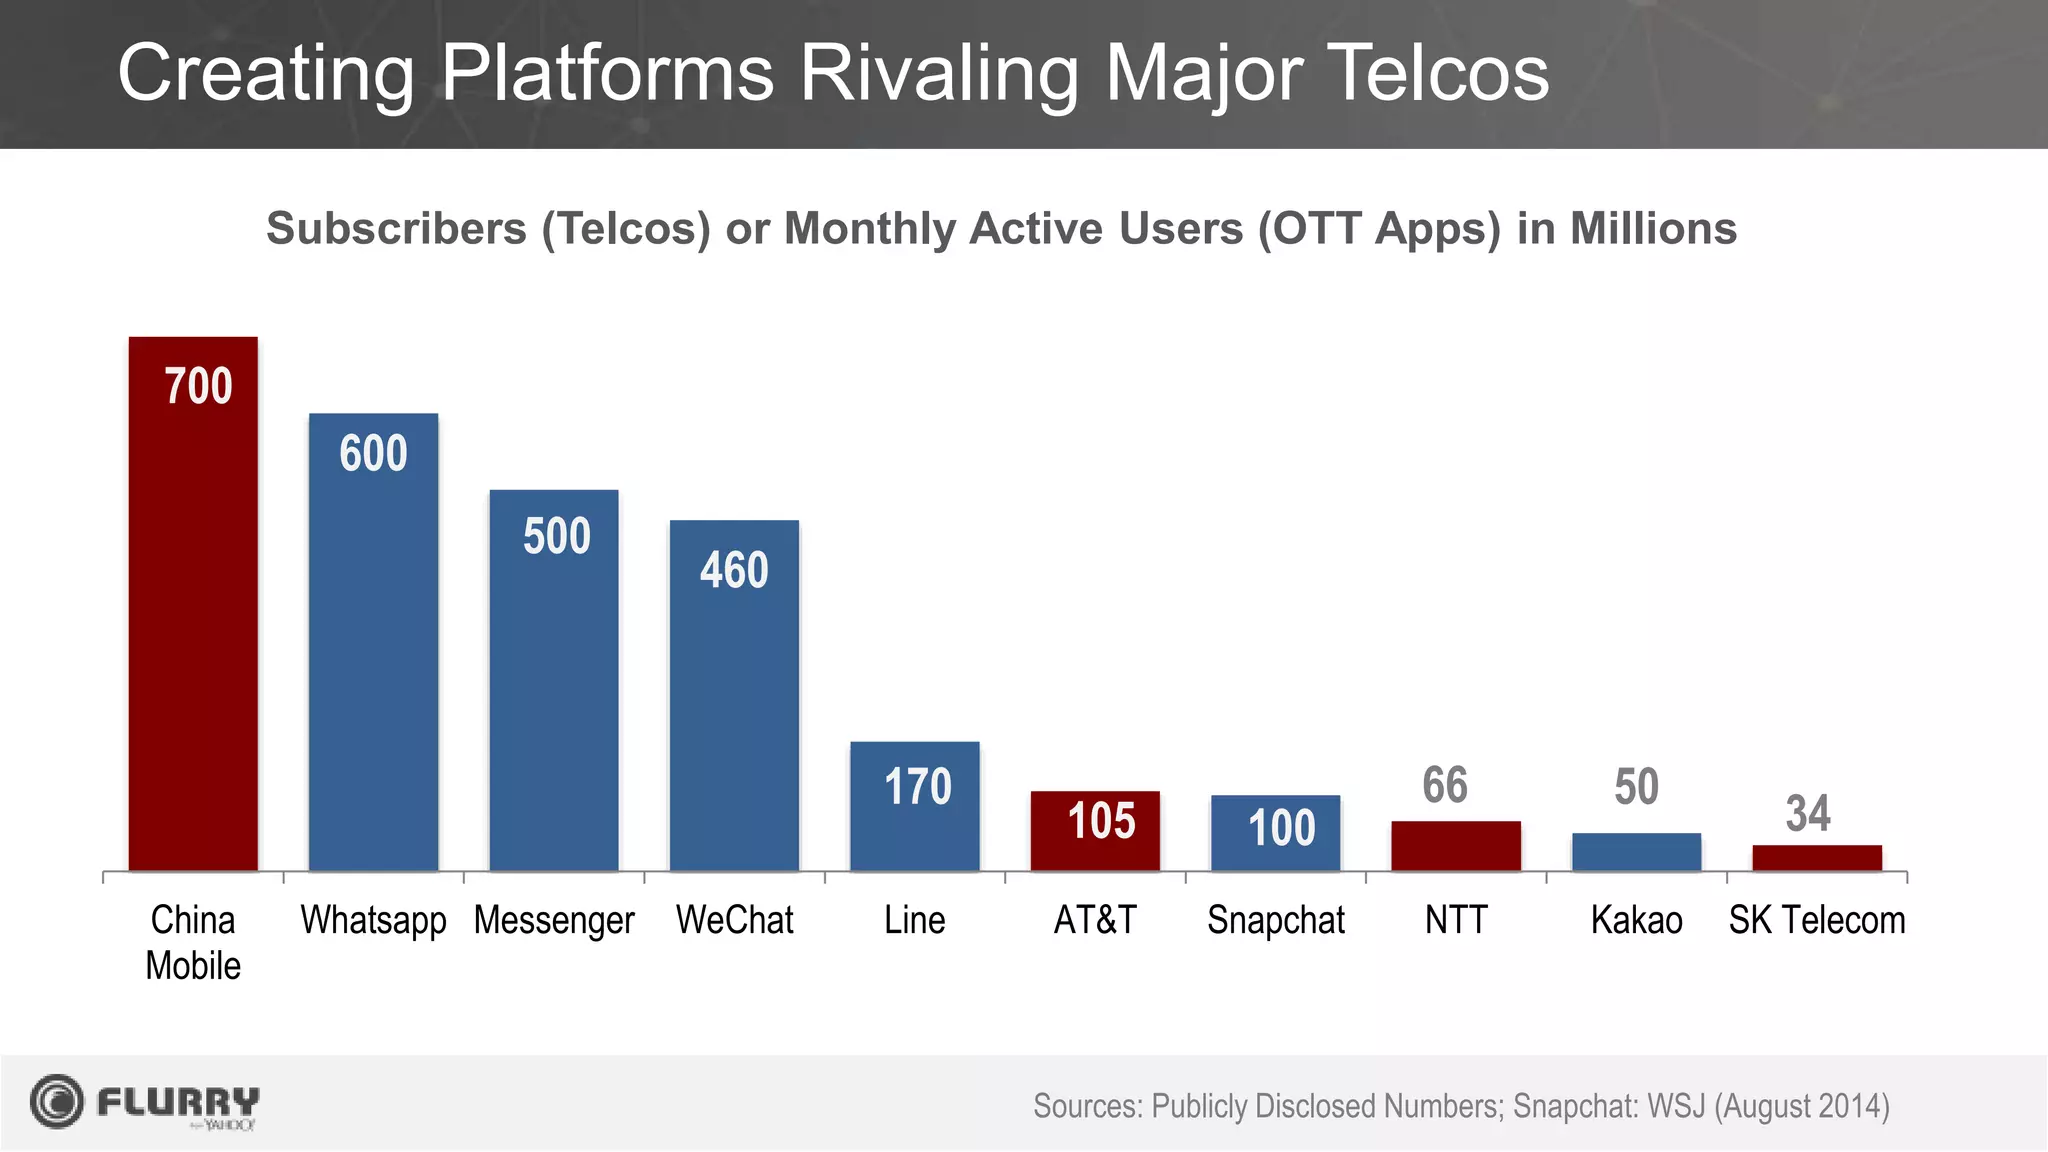
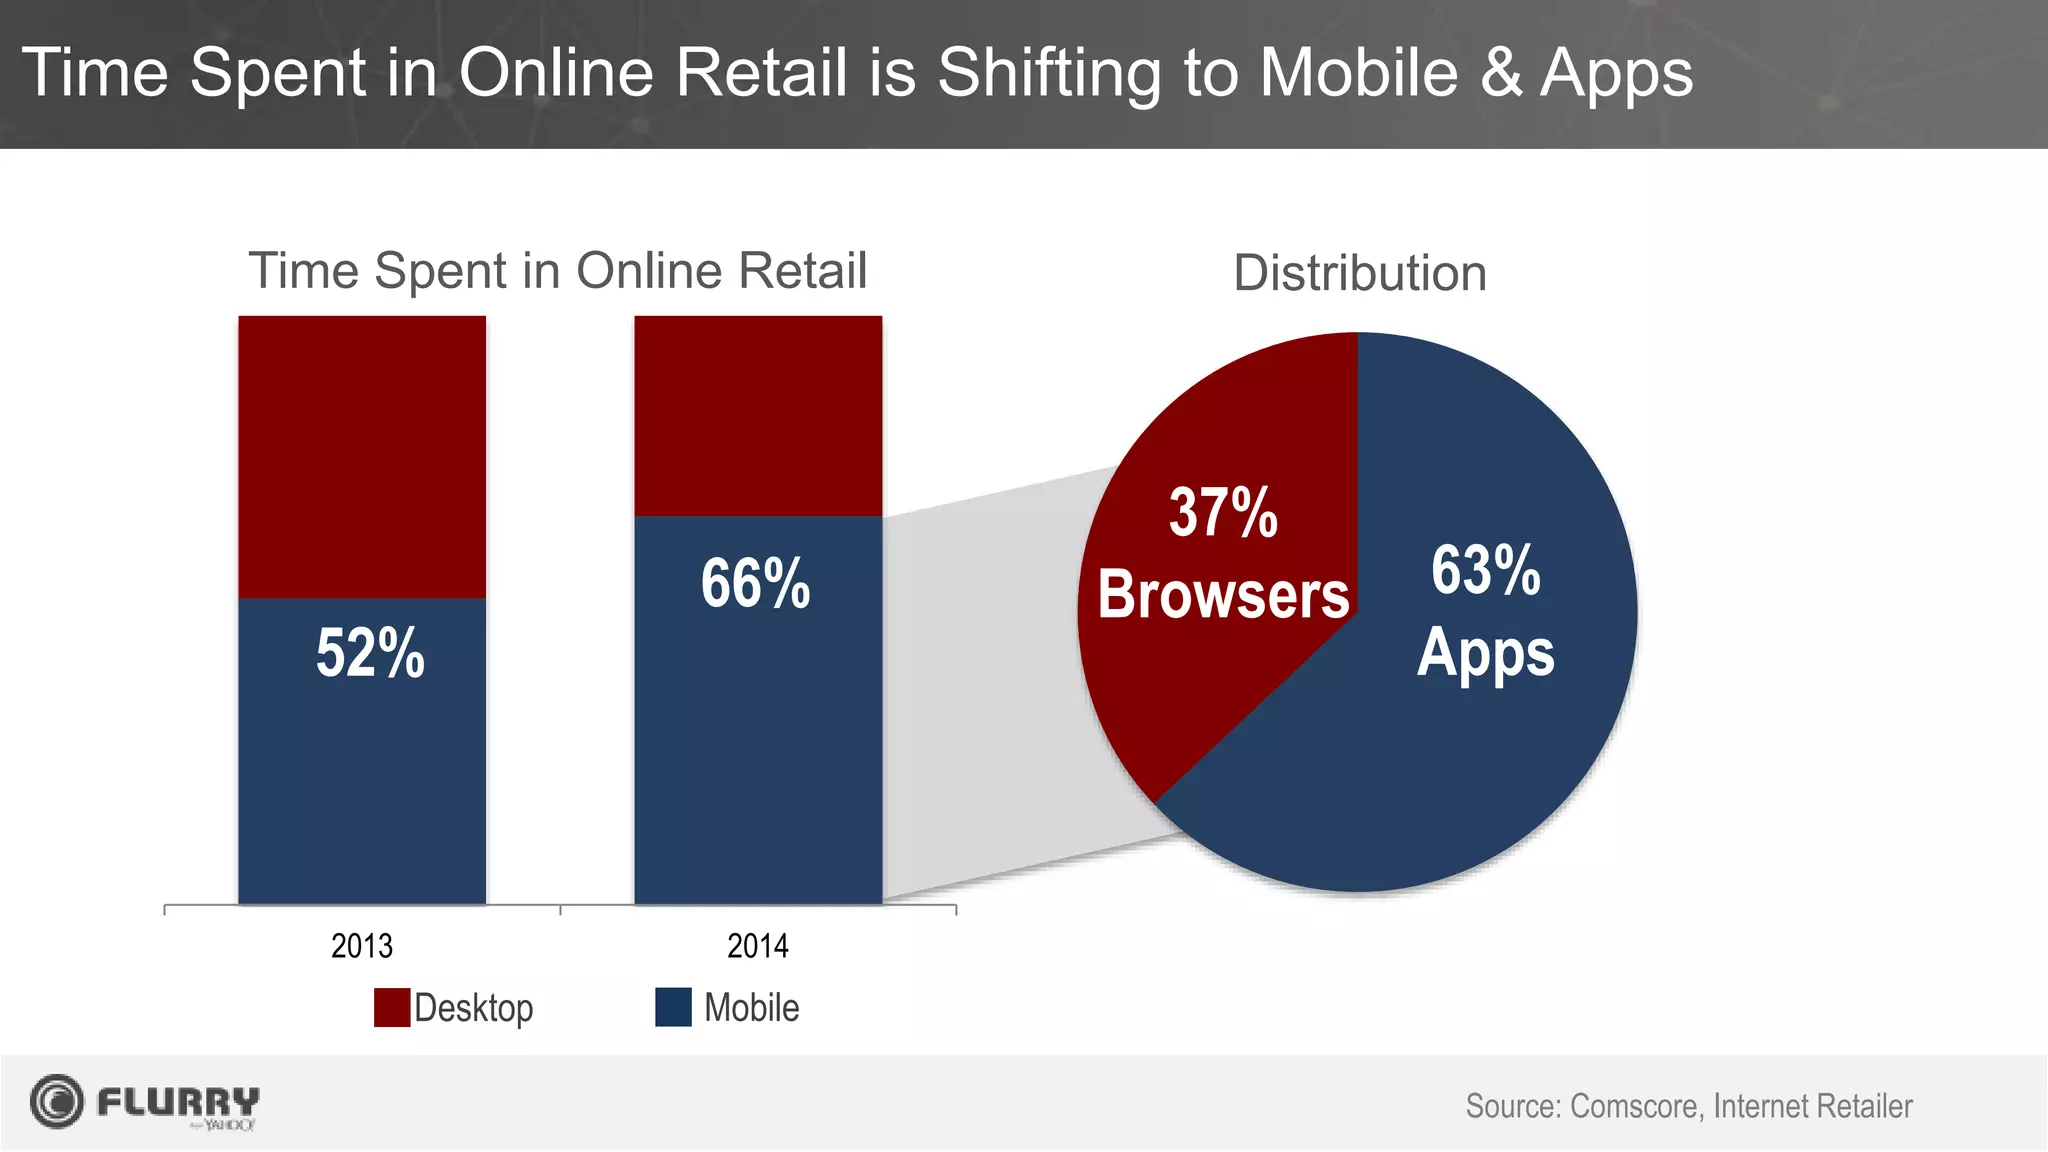
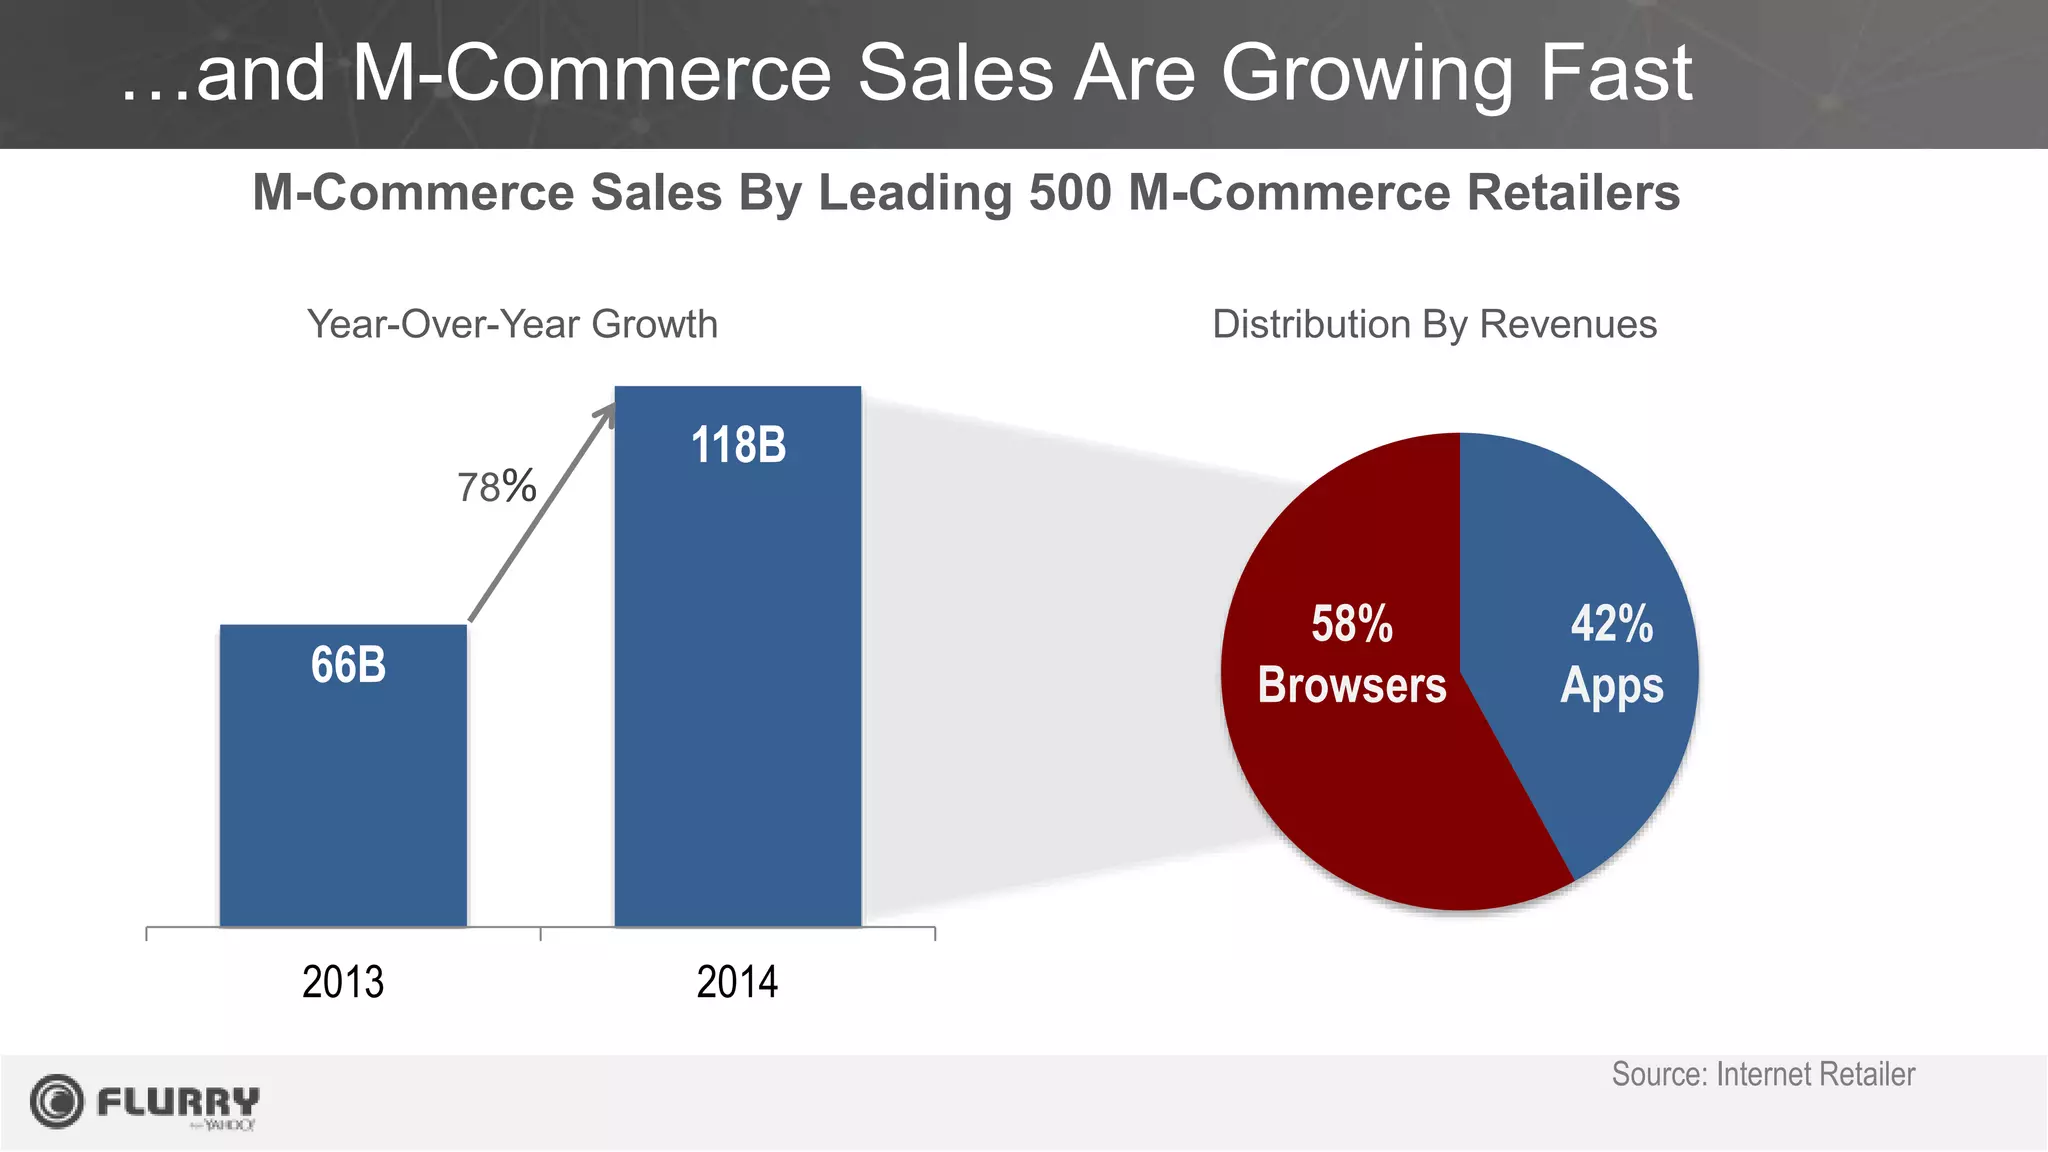
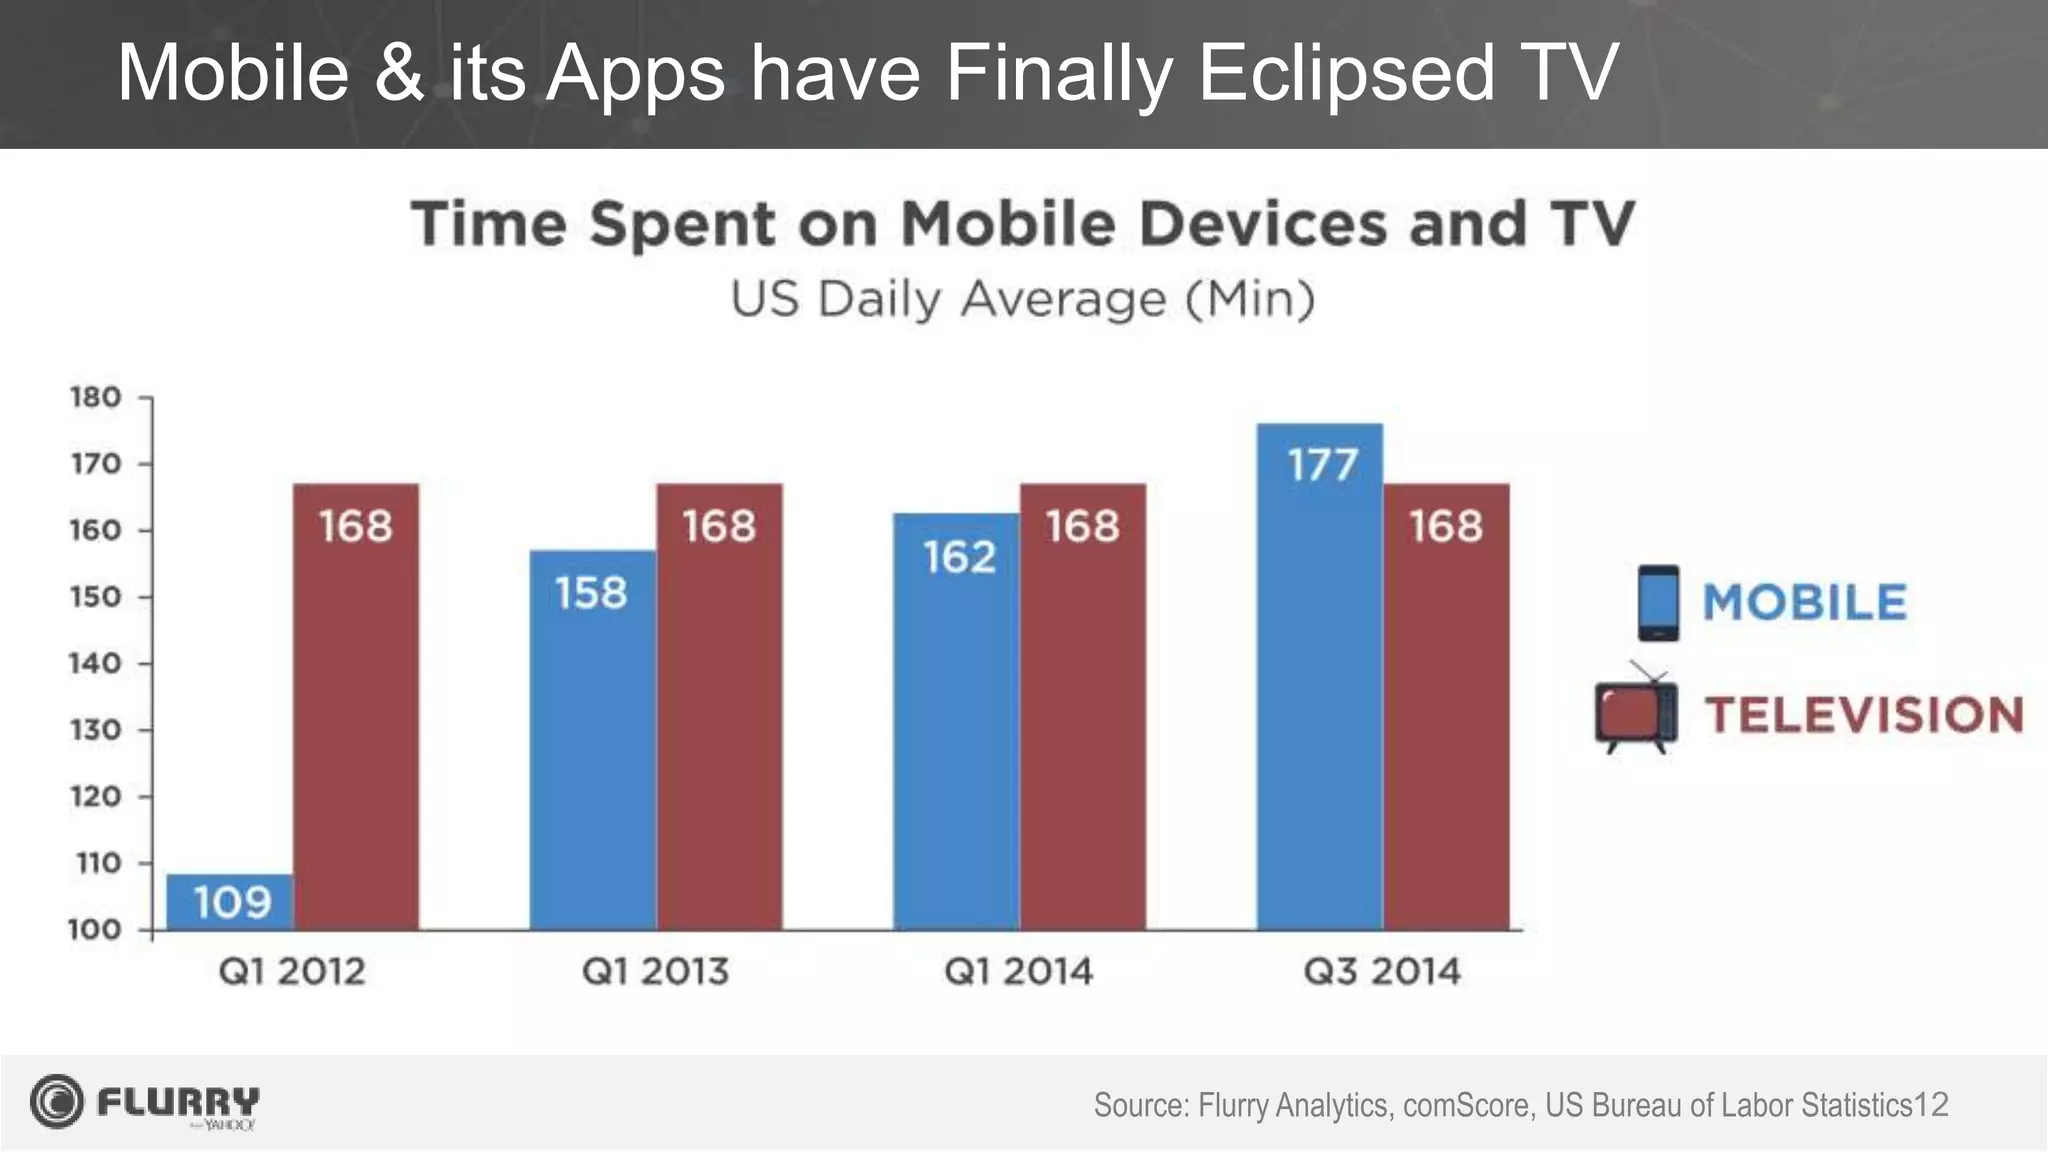
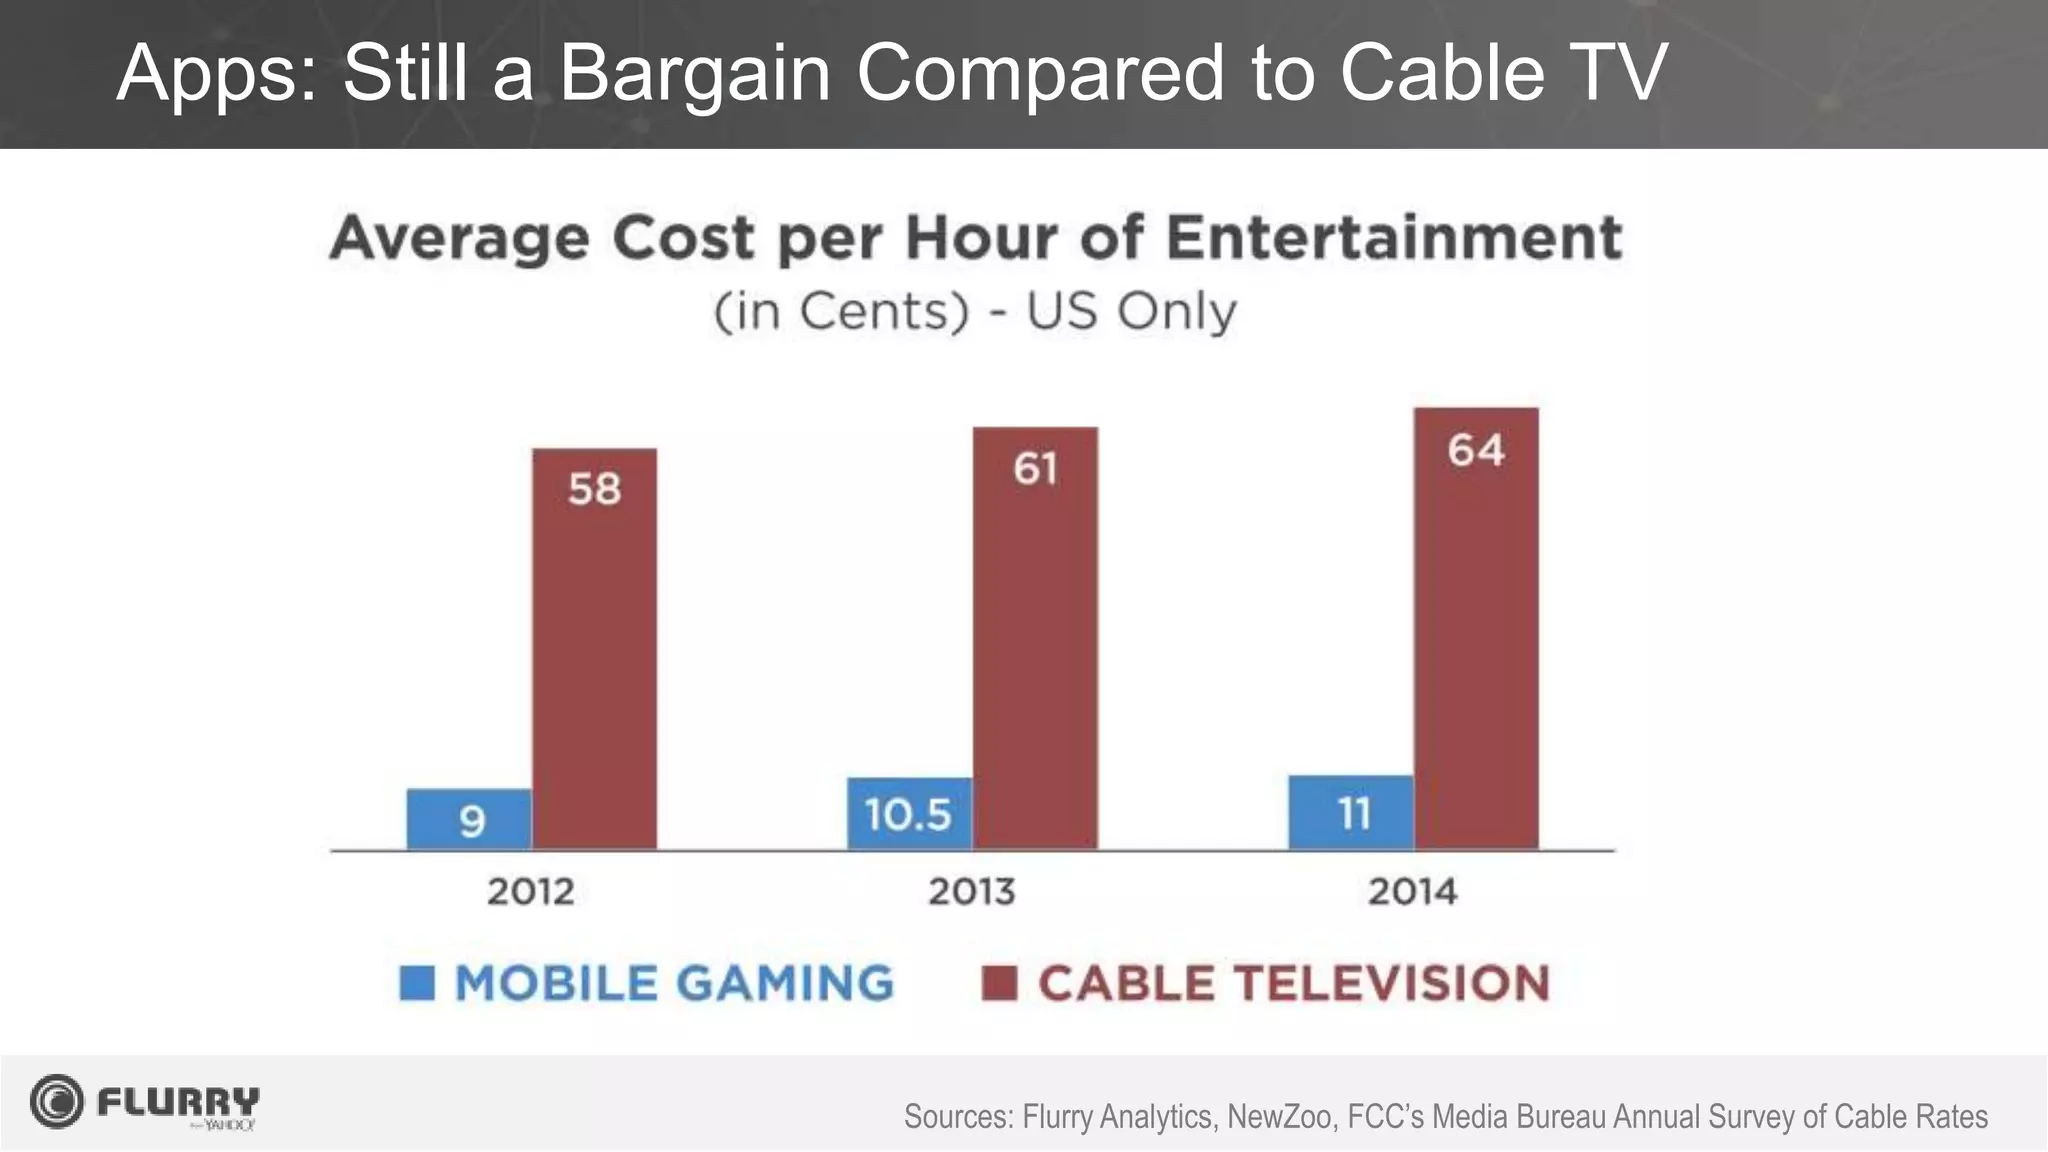
t
Simon Khalaf
Head of Flurry
@flurrymobile
The State of AppNation 2015
Six Years In: Nothing But Growth
Source: Flurry Analytics 2
Growth Drivers: Apps
Sources: Flurry Analytics, Comscore, NetMarketShare (Us Only)
Growth Drivers: Independent App Developers
Source: Flurry Analytics, comScore 4
Growth Drivers: Categories
Mobile Use Grows 76% Year-Over-Year (Sessions)
Source: Flurry Analytics
Messaging Continued its Stunning Growth
2013 2014
Percentage Usage Growth From Previous Year (Sessions)
203
115
103
76
%
Source: Flurry Analytics
Overall Messaging & Social
Creating Platforms Rivaling Major Telcos
China
Mobile
Whatsapp Messenger WeChat Line AT&T Snapchat NTT Kakao SK Telecom
Subscribers (Telcos) or Monthly Active Users (OTT Apps) in Millions
700
600
500
460
170
105 100
66 50
34
Sources: Publicly Disclosed Numbers; Snapchat: WSJ (August 2014)
Productivity: Teens & College Students Using Tablets as PCs
Source: Flurry Analytics, 100K Device Sample, February 2014
Productivity &
Utility App
Usage by Time
of Day
(Tablets Only)
Time Spent in Online Retail is Shifting to Mobile & Apps
2013 2014
Desktop Mobile
52%
66%
Time Spent in Online Retail
Source: Comscore, Internet Retailer
63%
Apps
37%
Browsers
Distribution
21%
68%
…and M-Commerce Sales Are Growing Fast
2013 2014
66B
118B
78%
42%
Apps
58%
Browsers
M-Commerce Sales By Leading 500 M-Commerce Retailers
Source: Internet Retailer
Year-Over-Year Growth Distribution By Revenues
Fueled by Anytime, Anywhere Shopping in Apps
0.0%
1.0%
2.0%
3.0%
4.0%
5.0%
6.0%
7.0%
8.0%
9.0%
5
AM
6
AM
7
AM
8
AM
9
AM
10
AM
11
AM
12
PM
1
PM
2
PM
3
PM
4
PM
5
PM
6
PM
7
PM
8
PM
9
PM
10
PM
11
PM
12
AM
1
AM
2
AM
3
AM
4
AM
Source: Flurry Analytics, 100k Sample, Android Devices Only, Feb 2014
Away Around the House
Distribution of Time Spent in Shopping Apps (US Only)
Mobile & its Apps have Finally Eclipsed TV
Source: Flurry Analytics, comScore, US Bureau of Labor Statistics12
Both Mediums Peaking at Prime Time
0%
10%
20%
30%
40%
50%
60%
70%
5
AM
6
AM
7
AM
8
AM
9
AM
10
AM
11
AM
12
PM
1
PM
2
PM
3
PM
4
PM
5
PM
6
PM
7
PM
8
PM
9
PM
10
PM
11
PM
12
AM
1
AM
2
AM
3
AM
4
AM
Daypart Comparison, Consumers 18+ Using Medium (US Only)
Sources: Michael Zimbalist (2/10), Nielsen National People Meter, Flurry Analytics 100k Sample, February 2014
Television Apps
%AudienceShare
Apps: Still a Bargain Compared to Cable TV
Sources: Flurry Analytics, NewZoo, FCC’s Media Bureau Annual Survey of Cable Rates
t
… Still in the Early Days

The State of AppNation 2015

  • 1.
    t Simon Khalaf Head ofFlurry @flurrymobile The State of AppNation 2015
  • 2.
    Six Years In:Nothing But Growth Source: Flurry Analytics 2
  • 3.
    Growth Drivers: Apps Sources:Flurry Analytics, Comscore, NetMarketShare (Us Only)
  • 4.
    Growth Drivers: IndependentApp Developers Source: Flurry Analytics, comScore 4
  • 5.
    Growth Drivers: Categories MobileUse Grows 76% Year-Over-Year (Sessions) Source: Flurry Analytics
  • 6.
    Messaging Continued itsStunning Growth 2013 2014 Percentage Usage Growth From Previous Year (Sessions) 203 115 103 76 % Source: Flurry Analytics Overall Messaging & Social
  • 7.
    Creating Platforms RivalingMajor Telcos China Mobile Whatsapp Messenger WeChat Line AT&T Snapchat NTT Kakao SK Telecom Subscribers (Telcos) or Monthly Active Users (OTT Apps) in Millions 700 600 500 460 170 105 100 66 50 34 Sources: Publicly Disclosed Numbers; Snapchat: WSJ (August 2014)
  • 8.
    Productivity: Teens &College Students Using Tablets as PCs Source: Flurry Analytics, 100K Device Sample, February 2014 Productivity & Utility App Usage by Time of Day (Tablets Only)
  • 9.
    Time Spent inOnline Retail is Shifting to Mobile & Apps 2013 2014 Desktop Mobile 52% 66% Time Spent in Online Retail Source: Comscore, Internet Retailer 63% Apps 37% Browsers Distribution 21% 68%
  • 10.
    …and M-Commerce SalesAre Growing Fast 2013 2014 66B 118B 78% 42% Apps 58% Browsers M-Commerce Sales By Leading 500 M-Commerce Retailers Source: Internet Retailer Year-Over-Year Growth Distribution By Revenues
  • 11.
    Fueled by Anytime,Anywhere Shopping in Apps 0.0% 1.0% 2.0% 3.0% 4.0% 5.0% 6.0% 7.0% 8.0% 9.0% 5 AM 6 AM 7 AM 8 AM 9 AM 10 AM 11 AM 12 PM 1 PM 2 PM 3 PM 4 PM 5 PM 6 PM 7 PM 8 PM 9 PM 10 PM 11 PM 12 AM 1 AM 2 AM 3 AM 4 AM Source: Flurry Analytics, 100k Sample, Android Devices Only, Feb 2014 Away Around the House Distribution of Time Spent in Shopping Apps (US Only)
  • 12.
    Mobile & itsApps have Finally Eclipsed TV Source: Flurry Analytics, comScore, US Bureau of Labor Statistics12
  • 13.
    Both Mediums Peakingat Prime Time 0% 10% 20% 30% 40% 50% 60% 70% 5 AM 6 AM 7 AM 8 AM 9 AM 10 AM 11 AM 12 PM 1 PM 2 PM 3 PM 4 PM 5 PM 6 PM 7 PM 8 PM 9 PM 10 PM 11 PM 12 AM 1 AM 2 AM 3 AM 4 AM Daypart Comparison, Consumers 18+ Using Medium (US Only) Sources: Michael Zimbalist (2/10), Nielsen National People Meter, Flurry Analytics 100k Sample, February 2014 Television Apps %AudienceShare
  • 14.
    Apps: Still aBargain Compared to Cable TV Sources: Flurry Analytics, NewZoo, FCC’s Media Bureau Annual Survey of Cable Rates
  • 15.
    t … Still inthe Early Days

Editor's Notes

  • #3 Many industries have been disrupted, starting with music in 2008 right with the launch of the iPhone and ending with TV most recently. I’m excited to take you through the mobile disruption we at Flurry have witnessed first hand. From the 540K apps that Flurry tracks, we’re now seeing 5.5 Billion sessions/day 170+ Billion app sessions/month This data (more than Google, Facebook or Twitter) gives us tons of insight into what’s happening in mobile, and we share that knowledge back with advertisers and with the industry on our blog. We’ve been in the app ecosystem since the beginning of smartphones, and we’ve seen key categories emerge to drive growth in the app Economy. Today, nearly ever sector of the mobile economy is seeing explosive growth….